Longitudinal Wobbling in 133La
Abstract
Excited states of 133La have been investigated to search for the wobbling excitation mode in the low-spin regime. Wobbling bands with = 0 and 1 are identified along with the interconnecting = 1, transitions, which are regarded as one of the characteristic features of the wobbling motion. An increase in wobbling frequency with spin implies longitudinal wobbling for 133La, in contrast with the case of transverse wobbling observed in 135Pr. This is the first observation of a longitudinal wobbling band in nuclei. The experimental observations are accounted for by calculations using the quasiparticle-triaxial-rotor (QTR) model, which attribute the appearance of longitudinal wobbling to the early alignment of a proton pair.
The atomic nucleus is a fascinating mesoscopic system, which continues to reveal new collective excitation modes due to improved sensitivity in the experimental techniques cl97 ; je02 ; iw14 . For quadrupole deformed nuclei, loss of axial symmetry generates new types of collective excitations. The novel characteristic rotational features of triaxial nuclei are chirality and wobbling. The focus of the present communication is the wobbling mode, which emerges because a triaxial nucleus can carry collective angular momentum along all three principal axes. In contrast, an axial nucleus cannot rotate about its symmetry axis. The wobbling mode is well known for triaxial-rotor molecules Herzberg . It appears as a family of rotational bands based on excitations with increasing angular momentum components along the two axes with smaller moments of inertia. Its appearance in even-even triaxial nuclei was analyzed by Bohr and Mottelson bohr . It is characterized by an excitation energy, increasing with the angular momentum and enhanced collective = 1, interconnecting transitions with reduced transition probabilities proportional to 1/.
The evidence for this mode in nuclei is rather limited. In a survey mo06 across the nuclear chart using the finite-range liquid-drop model (FRLDM), soft triaxial ground-state shapes are predicted for nuclides around = 62, = 76; = 44, = 64; and = 78, = 116. As reviewed in Ref. SF15 , most of these nuclides seem to execute large-amplitude oscillations only around the axial shape. Partial evidence for stabilization of ground state triaxiality in these regions has been the observation of odd--low staggering of the quasi- band st07 ; zh09 ; lu13 ; to13 . Ref. fr14 discussed the best case, 112Ru: the quasi- band splits at high spin into the one- and two- phonon wobbling bands with the expected . However, the data in 112Ru zh09 do not contain the required information about the values to clearly establish the wobbling character.
More compelling evidence for the wobbling phenomenon was observed in the 160 mass region at high spin in the odd- Lu and Ta isotopes od01 ; sc03 ; am03 ; br05 ; ha09 and at low spin in the 130 mass region in 135Pr ma15 . The presence of the odd quasiparticle in these nuclei modifies the wobbling mode in a substantial way, which provides additional evidence for the triaxial shape. Frauendorf and Dönau have recently analyzed the modifications semiclassically fr14 . They distinguish between two different kinds of wobbling modes for the odd- nuclei. For the “longitudinal” mode, the angular momentum of the odd particle is parallel to the axis with the largest MoI, whereas for the “transverse” mode, it is perpendicular to this axis. The two modes can be recognized by the -dependence of the wobbling energy (= ), which increases or decreases, respectively. It is given by
| (1) |
The wobbling bands observed in the Lu and Ta isotopes are examples of transverse wobbling because the wobbling frequency decreases with increasing spin, which also holds for the very recently reported first observation of transverse wobbling at low spin in 135Pr ma15 . The lowering of wobbling frequency enhances the detection probability and makes it possible to detect pattern of the enhanced reduced transition probabilities for interband transitions, which is a crucial signal for wobbling. In all cases the high-j quasiproton has particle character. Its interaction with the triaxial core aligns its angular momentum with the short axis, and the medium axis has the maximal MoI, which results in transverse wobbling (see Ref. fr14 ).
This Letter reports on observation of longitudinal wobbling in the nucleus 133La, which is an isotone of 135Pr. The phonon band with band head at , is found to decay to the phonon band by , transitions whose multipolarities have been determined on the basis of directional correlation from oriented states (DCO), polarization, and angular distribution measurements. The wobbling frequency is shown to increase with increasing spin indicating longitudinal wobbling. This is the first time that a longitudinal wobbling band has been observed in nuclei. Using the quasiparticle triaxial rotor (QTR) model with and without harmonic frozen approximation (HFA), the transition from transverse to longitudinal wobbling mode is demonstrated to be caused by the early alignment of a pair of positive-parity quasiprotons with the short axis.
A 52-MeV 11B beam from the 14-UD Pelletron at Tata Institute of Fundamental Research (TIFR) was used to populate the excited states of 133La via 126Te(11B, 4n) reaction. A layer of 1.1 mg/cm2-thick enriched 126Te evaporated on an Au backing of 9.9 mg/cm2 served as the target. The emitted rays were detected in Indian National Gamma Array (INGA), which consisted of 21 Compton suppressed clover HPGe detectors coupled with a digital data acquisition system pa12 . A set of 3108 two- and higher-fold events were collected during the experiment. The time stamped data were sorted in a -- cube and angle dependent - matrices, and the RADWARE software package ra95 was used for further analysis of these matrices and cubes.
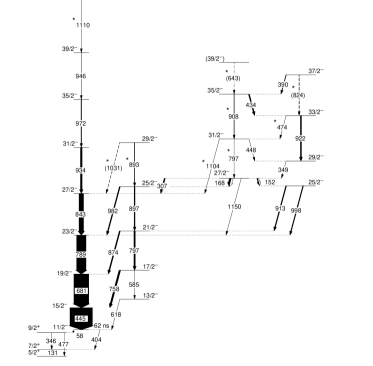
A partial level scheme of 133La containing the negative parity states studied in the present work, is shown in Fig. 1. This level scheme is based on detailed analysis of the -- coincidence relations, cross-over transitions, and relative intensities of the concerned rays. Spin and parity assignments to the states have been made on the basis of the measured DCO ratios () and polarization asymmetries of the transitions depopulating these states. The detectors at 90∘ and 157∘ were used to determine the DCO ratios kr89 . The polarization of rays was extracted from the 90∘ detectors using the formula given in Refs. st99 ; pa00 .
Prior to the present work, the nucleus 133La was studied through heavy-ion fusion evaporation reactions using a small detector array hi91 . The present work confirms the previous results. In addition, we have observed several new -ray transitions; these have been marked with an asterisk in Fig. 1. The yrast and the yrare bands have been extended to and and identified as the = 0 and = 1 phonon wobbling bands, respectively. A dipole band has also been observed at high spin up to . There are a few transitions, not shown in Fig. 1, that were reported in previous work hi91 as feeding into the =1 band. While it would be tempting to speculate that those might be from a possible = 2 band, they are too weak to obtain any conclusive evidence regarding their multipolarities, based on angular distributions and polarization asymmetries.
| I I | Eγ | (Expt.) | (QTR) | Fraction (%) | (Expt.) | (QTR) | (Expt.) | (QTRHFA) |
|---|---|---|---|---|---|---|---|---|
| 13/2 11/2- | 618 | -1.48 | -0.67 | 68.6 | - | 0.665 | - | 1.158/0.299 |
| 17/2 15/2- | 758 | -2.05 | -0.94 | 80.8 | 0.107 | 0.358 | 1.127 | 0.774 /0.324 |
| 21/2 19/2- | 874 | -2.60 | –1.20 | 87.1 | 0.056 | 0.231 | 0.716 | 0.591 /0.311 |
| 25/2 23/2- | 982 | -3.07 | -1.52 | 90.4 | 0.039 | 0.162 | 0.545 | 0.496 / 0.269 |
| 29/2 27/2- | 1031 | - | -1.92 | - | - | 0.119 | - | 0.445 /0.221 |
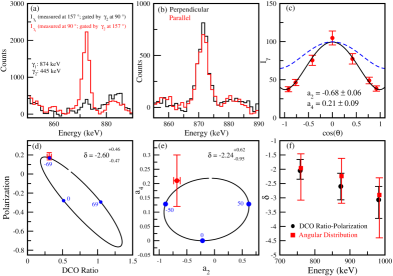
One characteristic feature of wobbling bands is that the transitions between the = 1 and = 0 bands must be of = 1, character od01 . The spectra which have been used to extract the DCO Ratio and Polarization for the 874-keV transition are shown in Figs. 2(a) and (b) respectively. Fig. 2(c) shows the angular distribution plot for this transition. The and the polarization asymmetry for the 874-keV () transition were calculated as a function of mixing ratio (), which is the ratio of the reduced matrix elements for the and components of a parity non-changing = 1 transition. The contour plot of theoretical and polarization along with the experimental values is shown in Fig. 2(d). In the calculation of , the width of the sub-state population () was assumed to be 0.3. This comparison gives a mixing ratio of for the 874-keV transition and firmly confirms its , nature. In Fig. 2(e), the contour plot along with the experimental data point has been shown. The mixing ratios obtained from both the DCO Ratio-Polarization and angular distribution method have been shown in Fig. 2(f) for the 758-, 874- and 982-keV connecting transitions.. However, the mixing ratios for the linking transitions mentioned in Table 1 are from the DCO-Polarization method. The fraction increases for the connecting transitions with increasing spin, indicating enhancement of wobbling with increasing angular momentum.
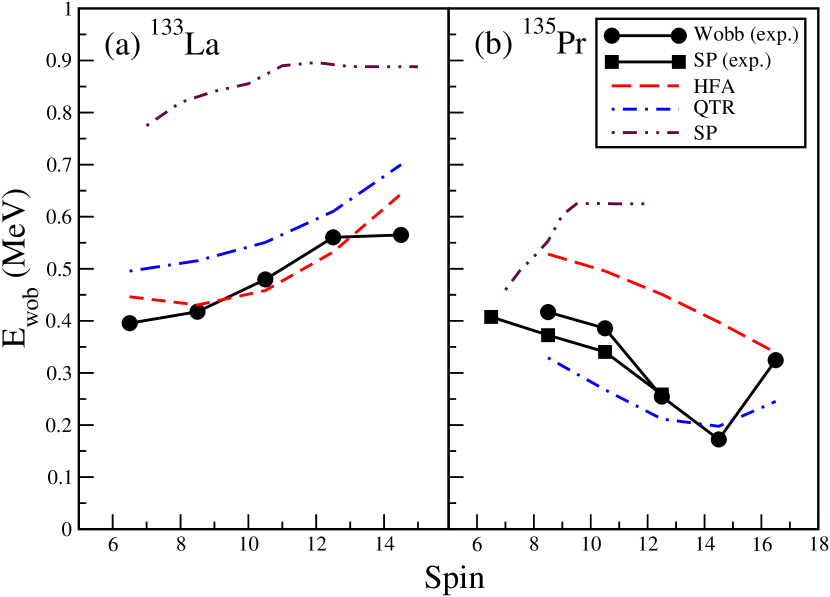
The experimental wobbling energies, (see Eq.(1)) of the isotones 133La and 135Pr are plotted in Fig. 3 as a function of spin. The wobbling frequency for 133La is increasing with angular momentum, which along with the mixing ratios of the interconnecting transitions suggests longitudinal wobbling in 133La fr14 , while it is decreasing in 135Pr, for which transverse wobbling has been established ma15 . The change from longitudinal to transverse in the neighboring isotones is a surprising result and warrants a detailed investigation. For both isotopes, the quasiproton has particle character, i. e., it is expected to align with the short axis, which is confirmed by cranking calculations hi91 ; sem86 . According to the general arguments of Ref. fr14 , both isotones should have been transverse.
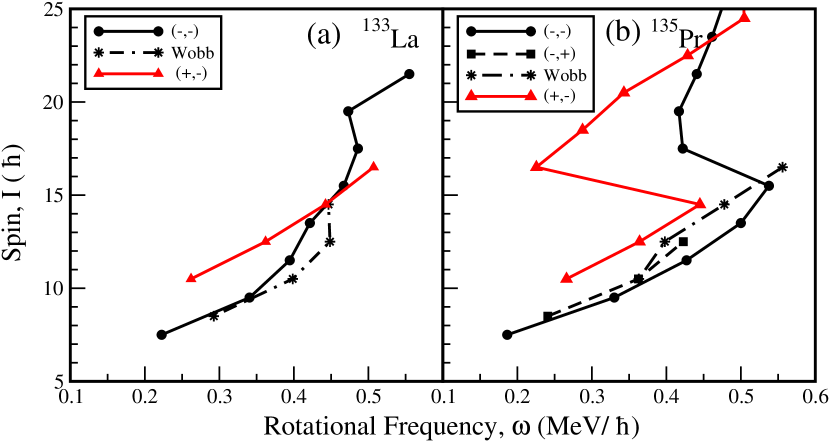
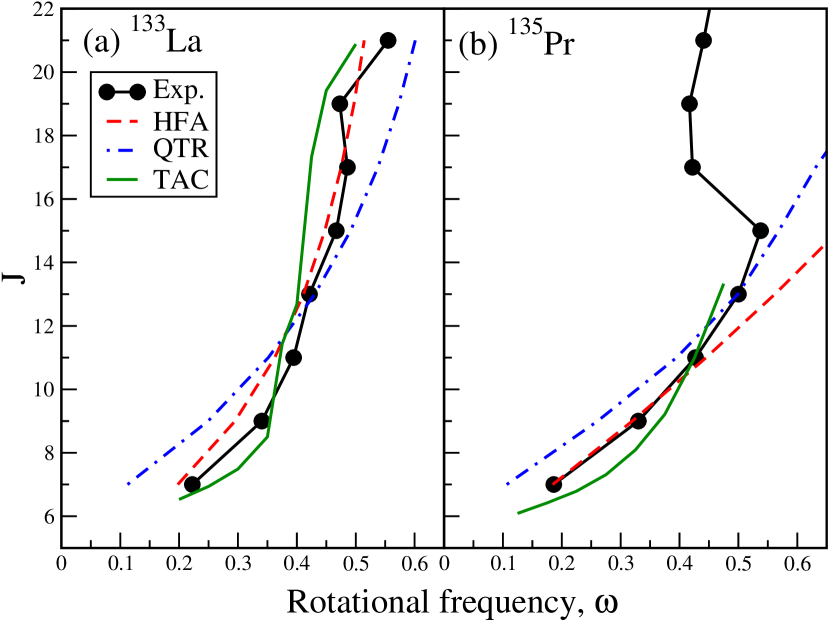
To identify the origin of this abrupt change from transverse to longitudinal wobbling motion, plots of the spin of the yrast band as function of the rotational frequency, , for the two nuclei are displayed in Fig. 4. Both curves have an intercept of about 5.5, which reflects the alignment of the proton with the short axis. The angular momentum increases early and in a gradual manner in 133La compared to 135Pr, which shows a late and rapid backbend. The change of the wobbling mode is, then, understood as follows. Just above the band head, both nuclides rotate about the short axis to which the proton is aligned. For 135Pr, the MoI of the short axis is smaller than the MoI of the medium axis (). With increasing spin it becomes favorable to put more and more collective angular momentum on the medium axis, which has the larger MoI. This leads to the decrease of the wobbling frequency with spin, the hallmark of transverse wobbling. As seen in Fig. 4 (a), the MoI of the short axis is larger for 133La, such that the MoI of the two axes are about the same (). The medium axis is no longer preferred by the collective angular momentum, which is now added to the short axis. This results in the increasing wobbling frequency with spin, which is the hallmark of longitudinal wobbling.
To quantify the claim, we modified the simple QTR+HFA model of Ref. fr14 by introducing a spin-dependent MoI for the short axis. We used the expression , where is MoI of the short axis, is the total angular momentum, the odd proton angular momentum, and the core angular momentum. The experimental alignments shown in Fig. 5 are well accounted for with the parameters , and for La and Pr, respectively. The other two MoI’s were fixed at ( is MoI of the medium axis), and ( is MoI of the long axis) for both nuclides, as used in Ref. fr14 . As seen in Fig. 3, the QTR+HFA calculation (depicted by HFA in the figure) reproduces the change from transverse wobbling in 135Pr to longitudinal in 133La. The reason is the early increase of the MoI in 133La compared to 135Pr seen in Fig. 4. The ratios for 135Pr and 133La at are, respectively, 21/15.4/4 and 21/19/4, which correspond to transverse and longitudinal wobbling. The QTR+HFA values for also account for the data reasonably well (see Tab. 1).
To further refine the theoretical interpretation we modified the QTR model used in Ref. fr14 in the same way as described for its HFA approximation. The core moments of inertia for 133La were with , , and . For 135Pr they were with , , and . A core-particle coupling strength of 6.4 was used, which corresponds to a deformation of and , which is the equilibrium deformation found in the TAC calculations and used for the triaxial rotor core.
The QTR also accounts for the change from transverse to longitudinal wobbling (see Fig. 3) and the difference in alignment between the nuclei (see Fig. 5). The QTR values for , , and the mixing ratios , also account for the data reasonably well (see Table 1). The decrease of the ratio is reproduced as well; however QTR overestimates the ratio by factor of three. Importantly, the collective enhancement of the non-stretched transitions from the wobbling to yrast band is born out by the QTR. The fraction indicates that the transitions are dominated. The negative sign of is consistent with the orientation of the quasiproton along the short axis.
We attribute the early increase of angular momentum in 133La to the gradual alignment of a pair of positive-parity quasiprotons of (dg) nature with the short axis, which is at variance with previous interpretations hi91 ; sem86 . Fig. 4 shows that the positive-parity band based on the odd (dg) quasiproton does not show the early rise of angular momentum seen in the yrast band, because it is blocked by the odd proton. The curve displayed in the figure is shifted by 5.5 , the amount contributed by the aligned . It crosses the yrast sequence about half-way the up-bend, which is expected when one quasiproton of the gradually aligning pair is excited. In case of 135Pr, the shifted curve of the positive parity (dg) keeps a relative distance of about 3 to the yrast sequence until it runs into a backbend, caused by the alignment of other quasiparticles. The fact that its continuation crosses the yrast sequence may suggest that the alignment of a pair of (dg) quasiprotons participates in the backbend.
Additionally we carried out Tilted Axis Cranking calculations (TAC) TAC00 using the equilibrium deformation parameters , and the pair fields MeV, MeV. Rotation about the short axis turned out to be stable for the two signatures of the one-quasiproton configuration. The distance of the unfavored routhian to the favored routhian is included in Fig. 3. The signature splitting is substantially larger for than because of the lower location in the shell. In case of 135Pr, the TAC calculations place it somewhat higher than the wobbling band, which is consistent the experimental localization very close to it. In case of 133La, TAC predicts it substantially higher, which explains the fact that we could not identify it in the present experiment.
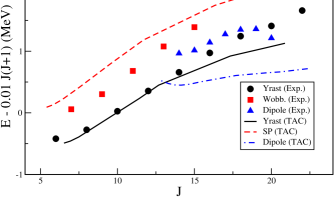
As for 135Pr, we assign the configuration [] to the dipole band. We carried out TAC calculations occupying the lowest pair of the routhians . The equilibrium deformation of , was found. The tilt angle with respect to the long axis stays around 35∘. Below , the second tilt angle is , i.e. the rotational axis lies in the short-long plane. Above , the tilt angle rapidly increases, reaching at , which suggests the existence of a chiral partner of the dipole band. As seen in Fig. 6, the TAC calculations well reproduce the position of the dipole band relative to the yrast band. The TAC calculations also give large values of , which decrease from to over the shown spin range. Together with the very small TAC inband values of the theory suggests that the band has the character of magnetic rotation. This seems consistent with the large experimental ratios observed for the transitions originating respectively from the states. The TAC ratios are larger; however, one expects that the mean field approach underestimates the in the case of small static deformation.
In summary, the nature of the wobbling mode in 133La has been investigated. Mixing ratios of interband transitions obtained from the angular distribution and DCO-polarization measurements indicate their strong nature. Surprisingly, 133La shows longitudinal wobbling as the wobbling frequency is increasing with spin. This is the first observation of longitudinal wobbling band in nuclei. The quasiparticle plus triaxial rotor model (with and without harmonic frozen approximation), was able to reproduce the experimental energies and transition rates, and clearly point to a transition from transverse wobbling in 135Pr to longitudinal wobbling in 133La. The change from transverse wobbling to longitudinal wobbling is understood as follows: In 135Pr only the quasiproton is aligned with the short axis of the triaxial density distribution and the medium axis has the largest MoI. This arrangement gives transverse wobbling. In 133La an additional pair of positive parity (dg) quasiprotons aligns early and gradually with the short axis. The additional alignment increases the effective MoI of the short axis, which becomes larger than the MoI of the medium axis. This arrangement gives longitudinal wobbling. In 135Pr the early (dg) neutron alignment occurs later as part of the sharp band crossing, above which the longitudinal wobbling begins to appear ma15 .
We acknowledge the TIFR-BARC Pelletron Linac Facility for
providing good quality beam. The help and cooperation of the INGA collaboration in setting
up the array is also acknowledged. We thank the TIFR central workshop for the
fabrication of various mechanical components for the experiment. This work has been supported in part by the Department of
Science and Technology, Government of India (No. IR/S2/PF-03/2003-II),
the U.S. National Foundation (Grant No. PHY-1419765), and the US Department of Energy
(Grant DE-FG02-95ER40934).
References
- (1) R. M. Clark, et al. Phys. Rev. Lett. 78 (1997) 1868.
- (2) D. R. Jensen, et al. Phys. Rev. Lett. 89 (2002) 142503.
- (3) H. Iwasaki, et al. Phys. Rev. Lett. 112 (2014) 142502.
- (4) G. Herzberg, Molecular Spectra and Molecular Structure, vol. 2, Infraread and Raman Spectra of Polyatomic Molecules, van Nostrand, New York, 2nd edition, 1950
- (5) A. Bohr, B. Mottelson, Nuclear Structure, vol. II, Benjamin, Inc., New York, 1975.
- (6) Peter Möller, Ragnar Bengtsson, B. G. Carlsson, Peter Olivius, Takatoshi Ichikawa, Phys. Rev. Lett. 97 (2006) 162502.
- (7) S. Frauendorf, Int. J. Mod. Phys. E 24 (2015) 1541001.
- (8) I. Stefanescu, et al. Nucl. Phys. A 789 (2007) 125.
- (9) S. J. Zhu, et al. Int. J. Mod. Phys. E 18 (2009) 1717.
- (10) Y. X. Luo, et al. Nucl. Phys. A 919 (2013) 67.
- (11) Y. Toh, et al. Phys. Rev. C 87 (2013) 041304(R).
- (12) S. Frauendorf, F. Dönau, Phys. Rev. C. 89 (2014) 014322.
- (13) S. W. Ødegård, et al. Phys. Rev. Lett. 86 (2001) 5866.
- (14) G. Schönwaer, et al. Phys. Lett. B 552 (2003) 9.
- (15) H. Amro, et al. Phys. Lett. B 553 (2003) 197.
- (16) P. Bringel, et al. Eur. Phys. J. A 24 (2005) 167.
- (17) D.J. Hartley, et al. Phys. Rev. C. 80 (2009) 041304(R).
- (18) J.T. Matta, et al. Phys. Rev. Lett. 114 (2015) 082501.
- (19) R. Palit, et al. Nucl. Instrum. Methods Phys. Res. Sect. A 680 (2012) 90.
- (20) D. C. Radford, Nucl. Instrum. Methods Phys. Res. Sect. A 361 (1995) 297.
- (21) A. Krämer-Flecken, T. Morek, R. M. Leider, W. Gast, G. Hebbinghaus, H. M. Jäger, and W. Urban , Nucl. Instrum. Methods Phys. Res. Sect. A 275 (1989) 333.
- (22) K. Starosta, et al. Nucl. Instrum. Methods Phys. Res. Sect. A 423 (1999) 16 .
- (23) R. Palit, H. C. Jain, P. K. Joshi, S. Nagaraj, B. V. T. Rao, S. N. Chintalapudi, and S. S. Ghugre, Pramana 54 (2000) 347.
- (24) L. Hildingson, W. Klamra, Th. Lindblad, C. G. Lindén, G. Sletten, and G. Székely, Z. Phys. A 338 (1991) 125.
- (25) T. M. Semkov et al. Phys. Rev. C 34 (1986) 523.
- (26) J. R. B. Oliveira, L. G. R. Emediato, M. A. Rizzutto, R. V. Ribas, W. A. Seale, M. N. Rao, N. H. Medina, S. Botelho, E. W. Cybulska, Phys. Rev. C 39 (1989) 2250.
- (27) C. M. Petrache, D. Bazzacco, S. Lunardi, C. Rossi Alvarez, G. de Angelis, M. De Poli, D. Bucurescu, C. A. Ur, P. B. Semmes, R. Wyss, Nucl. Phys. A 597 (1996) 106.
- (28) P. Möller, A. J. Sierk, R. Bengtsson, H. Sagawa, T. Ichikawa, Atomic Data and Nuclear Data Tables 98 (2012) 149.
- (29) S. Frauendorf, F. Dönau, Phys. Rev. C 92 (2015) 064306.
- (30) S. Frauendorf, Nucl. Phys. A 677, 115 (2000).