A CONSTRAINT ON THE FORMATION TIMESCALE OF THE YOUNG OPEN CLUSTER NGC 2264:
LITHIUM ABUNDANCE OF PRE-MAIN SEQUENCE STARS
Abstract
The timescale of cluster formation is an essential parameter in order to understand the formation process of star clusters. Pre-main sequence (PMS) stars in nearby young open clusters reveal a large spread in brightness. If the spread were considered as a result of a real spread in age, the corresponding cluster formation timescale would be about 5 – 20 Myr. Hence it could be interpreted that star formation in an open cluster is prolonged for up to a few tens of Myr. However, difficulties in reddening correction, observational errors, and systematic uncertainties introduced by imperfect evolutionary models for PMS stars, can result in an artificial age spread. Alternatively, we can utilize Li abundance as a relative age indicator of PMS star to determine the cluster formation timescale. The optical spectra of 134 PMS stars in NGC 2264 (catalog ) have been obtained with MMT/Hectochelle. The equivalent widths have been measured for 86 PMS stars with a detectable Li line (3500 ). Li abundance under the condition of local thermodynamic equilibrium (LTE) was derived using the conventional curve of growth method. After correction for non-LTE effects, we find that the initial Li abundance of NGC 2264 (catalog ) is . From the distribution of the Li abundances, the underlying age spread of the visible PMS stars is estimated to be about 3 – 4 Myr and this, together with the presence of embedded populations in NGC 2264 (catalog ), suggests that the cluster formed on a timescale shorter than 5 Myr.
1 INTRODUCTION
Theories of star formation have predicted that star formation takes place on different timescales depending on the physical states of the molecular cloud. As reviewed by Shu et al. (1987), star formation in a magnetically subcritical cloud can be initiated at a slow rate through ambipolar diffusion. In this scenario, the molecular cloud is supposed to be in an equilibrium state where the magnetic field pressure supports the cloud against gravitational collapse, and therefore the magnetic field plays a crucial role in regulating star formation. Ambipolar diffusion occurs on a timescale of 5 – 10 Myr (Tassis & Mouschovias, 2004) when the density increases up to (Mouschovias et al., 1985). According to the rapid star formation scenario, a giant molecular cloud can be formed on a timescale of a few Myr, and subsequently cores are formed by the dissipation of supersonic turbulence inside the cloud (Ballesteros-Paredes et al., 1999; Elmegreen, 2000). Star formation is eventually initiated in the collapsing cores.
It is known that most of stars (about 80 – 90% ) in a star forming region constitute a cluster (Lada & Lada, 2003; Porras et al., 2003). After the onset of star formation, the duration of star formation activity within a protocluster is still poorly constrained. There are two questions: (1) Are low density associations and gravitationally bound clusters formed on a different timescale? (2) Can observational properties, such as the extended main sequence (MS) turn-off of several star clusters in the Large Magellanic Cloud (Mackey & Broby Nielsen, 2007; Milone et al., 2009, etc) and multiple stellar populations in Galactic globular clusters (Piotto et al., 2012; Ventura et al., 2014, etc) be explained by extended star formation processes? The duration of star formation activity is an essential quantity for drawing a general picture of cluster formation.
If the age distribution of cluster members can be reliably obtained, the age spread among them gives the formation timescale of the cluster. The star formation history of nearby young open clusters has been investigated by a large number of previous investigators from the color-magnitude diagrams (CMDs). Herbig (1962) found a large age difference between the MS turn-off and the MS turn-on from the pre-main sequence (PMS) stage in the Pleiades. He presumed that low-mass star formation occurred prior to the formation of high-mass stars, and that star formation within a cluster could be prolonged for up to years.
Palla & Stahler (1999, 2000, 2002) suggested a revised version of the sequential star formation speculated by Herbig (1962) using their own PMS evolutionary models. According to their argument, star formation started at an early epoch (about 10 Myr ago), and then the star formation rate accelerated in the present epoch (1 – 2 Myr ago). Palla et al. (2005) strengthened their idea by invoking the significant Li depletion of four PMS members of the Orion Nebula Cluster. It meant that the formation timescale of a cluster is about 10 Myr. Recently, the star formation history of the starburst cluster NGC 2070 in the Large Magellanic Cloud was studied by Cignoni et al. (2015), and the result corresponds well to the extended star formation scenario suggested by Palla & Stahler (1999). Sung et al. (1997, 2004) raised doubts on the sequential star formation scenario from the age distribution of PMS stars in NGC 2264, although they found a spread in age among PMS stars with H emission. Hartmann (1999, 2001, 2003) also argued that various factors, such as binarity, variability, extinction, accretion activities, the inclusion of field stars, and uncertainties in the evolutionary models for intermediate-mass PMS stars, are responsible for the apparent age spread. Although many follow-up studies have examined such factors, the issue of the age spread among PMS stars in a cluster is still under debate.
The extended star formation scenario introduced above is based on the analysis of the CMDs with various evolutionary models for PMS stars. As mentioned by Hartmann (1999, 2001, 2003), large observational uncertainties may be involved in the luminosities of PMS stars, and it is difficult to control the sources of these uncertainties from a single observation. The modulation of spots, the obscuration by disk material, an edge-on disk, and accretion activities may be typical sources of the observational uncertainties (Sung et al., 2009; Stauffer et al., 2016). In addition, as most young stars are deeply embedded in the natal molecular cloud, the difficulty of reddening correction of low-mass PMS stars and differential reddening across the cluster, are other sources of scatter in the CMDs. Hence, independent age indicators are required to disentangle this issue.
Lithium (Li) is a fragile light element that is destroyed at a temperature of about K. The temperature at the base of convective envelope inside a low-mass PMS star easily reaches the destruction temperature as the star contracts (Bodenheimer, 1965; Piau & Turck-Chiéze, 2002). Li-depleted material at the base of the convective envelope is transported to the surface, and therefore in a slow-rotating low-mass PMS star, the Li abundance on the surface decreases steadily over time. The surface Li abundance has long been regarded as a good stellar age indicator and as a diagnostic tool to probe the stellar interior structure (Herbig, 1965; Pinsonneault, 2010).
A number of previous studies focused on the Li abundance of low-mass stars in nearby open clusters to understand the process of Li depletion since Herbig (1965) recognized a correlation between Li abundance and stellar age. Wallerstein et al. (1965) supported Herbig’s suggestion by invoking the higher Li abundance of a few Hyades members compared to that of the Sun. They also suggested that the low Li abundance of old cool stars may be attributed to the Li depletion process during the PMS contraction phase. Zappala (1972) observationally tested the theoretical Li depletion model of Bodenheimer (1965) for PMS stars, and argued that an extra depletion on a timescale of about 1 Gyr during MS evolution (in the MS band) was required to explain the Li abundance of the solar-type Hyades members. Duncan (1981) reported the Li deficiency of a few F-type stars in the Hyades. This feature, the so-called ‘Boesgaard funnel’ or ‘chasm’, turned out to be common among F-type stars in intermediate-age clusters (Boesgaard & Tripicco, 1986; Soderblom et al., 1990, 1993a, 1993b), and it seems to be associated with rapid rotation (Boesgaard, 1987).
While cooler members of the Hyades showed only a small scatter in Li abundance, a large intrinsic scatter was found for Pleiades members. Duncan & Jones (1983) presumed that the observed scatter may be due to an age spread among members. Soderblom et al. (1993a) found most Li-rich stars to be fast rotators, and suggested that the spread in the Li abundance may be related to a difference in stellar rotation. Soderblom et al. (1999) investigated the rotational period and Li abundance of PMS stars in NGC 2264 (catalog ) as a younger counterpart of the Pleiades, but no meaningful correlation was found. Recently, Bouvier et al. (2016) reported only a weak correlation between the Li equivalent width [(Li)] and rotational velocity in the same cluster. These facts may imply that the effects of stellar rotation on the Li abundance may be less significant for 3 – 5 Myr young stars.
The strength of the Li I line in cool stars is very sensitive to temperature, and therefore spots on the surface and chromospheric activity could be other sources causing a variation in Li abundance. Many previous studies tried to confirm the correlation between Li abundance and stellar activity, but little variation in the strength of Li I 6708 doublet was found (Pallavicini et al., 1993; Mallik, 1998; Navascués et al., 2001, and references therein). A recent study of the young active star LQ Hydrae (catalog ) showed a small variation of Li abundance (about 0.02 dex), which was synchronized with the rotational modulation (Soriano et al., 2015).
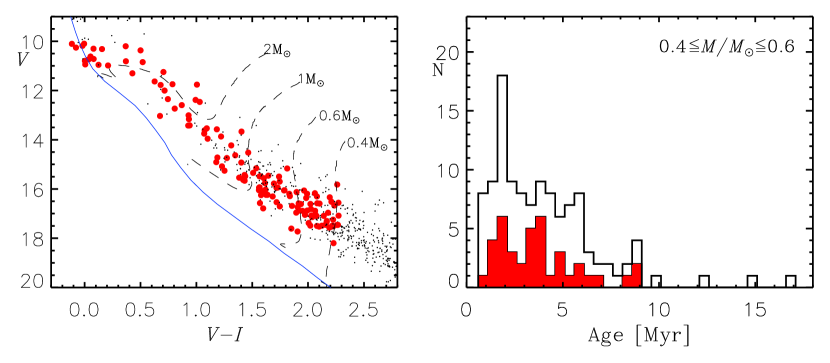
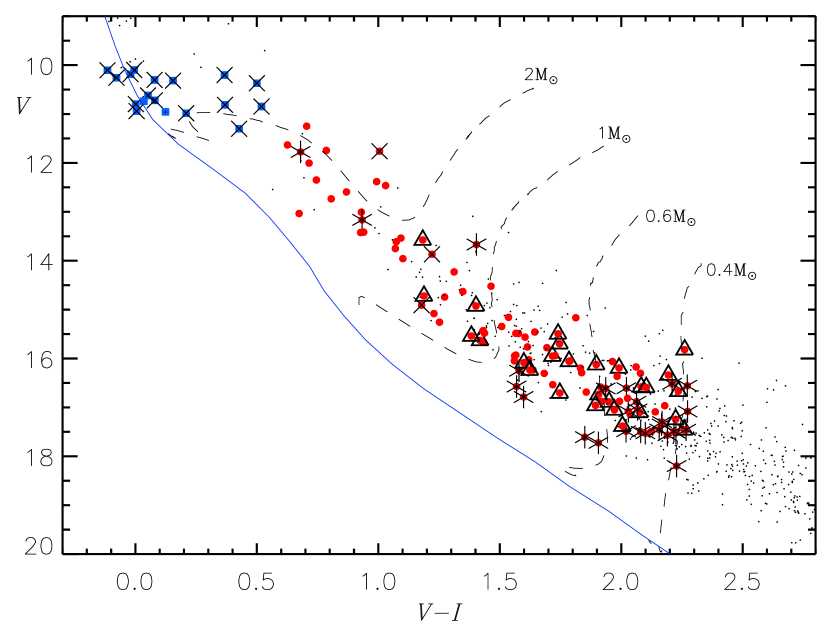
NGC 2264 (catalog ) is one of nearby young open clusters ( pc – Sung et al. 1997; Kamezaki et al. 2014). More than one thousand stars have been identified as members of the cluster (Sung et al., 1997; Park et al., 2000; Sung et al., 2004, 2008, 2009). Photometric studies have indicated a large apparent age spread among the PMS members as shown in Figure 1. The spread in age of PMS stars in the cluster was also reported in other studies (Flaccomio et al., 1999; Palla & Stahler, 2000; Dahm & Simon, 2005). Therefore, this cluster is an ideal test bed to either prove or disprove the apparent age spread. We will utilize the Li abundance as a relative age indicator among PMS stars within the cluster. Since it can be assumed that all members were formed from the same molecular cloud, this analysis is free from significant star-to-star differences in the initial chemical composition (Feng & Krumholz, 2014). In addition, NGC 2264 (catalog ) is so young that the Li abundance of low-mass PMS stars may be less affected by rotationally-induced mixing arising from angular momentum loss.
The observations and data reduction are described in Section 2. In Section 3, we discuss the equivalent width measurements of Li I 6708, and derive the Li abundances. The age spread and formation timescale of the cluster are derived in Section 4. A few Li deficient stars are discussed in Section 5. Finally, we present a summary and conclusions of this study in Section 6.
2 OBSERVATIONS AND DATA REDUCTION
Membership selection in open clusters is a crucial issue for obtaining reliable scientific results. Sung & Bessell (2010) carefully investigated the nature of PMS stars in NGC 2264 (catalog ) using their member list previously obtained from a variety of membership criteria (e.g., X-ray, ultra-violet excess, H, and mid-infrared excess emissions). We used their member list to select spectroscopic targets. Figure 1 shows the (, ) CMD of the member stars and their age distribution from the CMD. The current evolutionary models for PMS stars predict that stars in the mass range of 0.4 to 0.6 completely deplete their initial Li within 15 Myr (Baraffe et al., 2015). Therefore, the Li abundance of these subsolar mass stars could provide a reliable age indicator, at least on a relative scale. In order to determine the initial Li abundance of NGC 2264 (catalog ), higher mass PMS stars were also included in our target list.
Queue scheduled observations were carried out on 2015 April 1 and November 24 with the multi-object high resolution echelle spectrograph Hectochelle (Szentgyorgyi et al., 2011) attached to the 6.5 m telescope of the MMT observatory. The resolving power of the spectrograph () is high enough to detect the Li I resonance doublet with little blending from adjacent metallic lines. The multi-object capability allowed us to simultaneously obtain 240 target and sky spectra in a single observation. The OB 26 filter transmits the wavelength range 6530 – 6715 Å (Szentgyorgyi et al., 2011), and therefore the useful spectral features H and He I could also be observed along with the Li I line. The spectra of a total of 134 PMS stars were taken in two sets of exposure times – 8 minutes 3 for bright stars ( mag), and 30 minutes 3 for fainter stars. Offset sky spectra were also obtained to correct for the contributions of locally variable nebula emission lines to the spectra of the faint stars. Calibration frames, such as dome flat and comparison spectra were also acquired, just before and after the target exposure.
The multiple extension FITS (Flexible Image Transport System) images were merged after overscan correction into a single FITS image using IRAF/MSCRED packages. One-dimensional (1D) spectra of PMS stars were extracted using the dofibers task in the IRAF/SPECRED package. A total of 240 apertures were traced in the dome flat spectra using spline function fitting, and the 1D spectra of all the fibers were extracted along each aperture. The pixel-to-pixel variation was also corrected for using the residuals of the dome flat spectra divided by a high-order spline function. We determined the solutions for the wavelength calibration using ThAr lamp spectra, and applied them to the target and flat spectra. In order to eliminate the blaze function of the echelle spectra, the target spectra were divided by the wavelength-calibrated dome flat spectra.
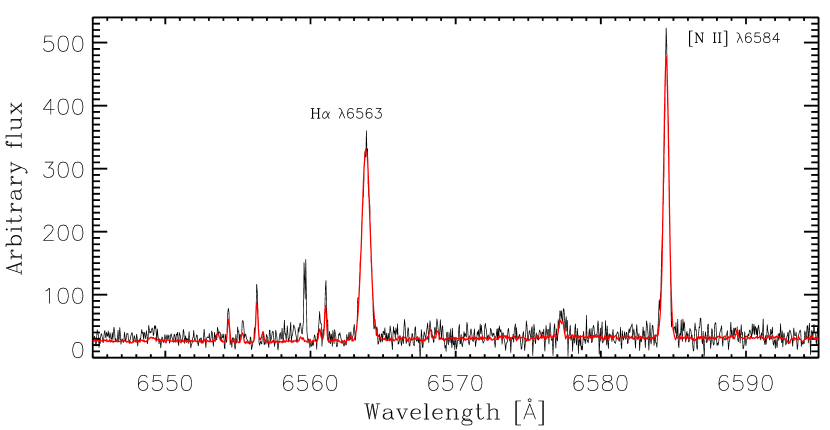
An offset sky observation was not made for bright stars ( mag). Instead, we assigned a few tens of fibers to blank sky to obtain the simultaneous sky spectra. A master sky spectrum with high signal-to-noise ratio was obtained by median combining those sky spectra which were not affected by scattered light from nearby bright stars. The nebular contribution to the target spectra were subtracted using the master sky spectrum. As the contribution of locally variable emission lines, such as H 6563, [N II] 6548, and 6584, becomes significant for faint PMS stars, we created an adaptable synthetic sky spectrum following the procedure described by Kiminki et al. (2015) for the correction of spatially varying nebular lines. Sky spectra not affected by the illumination of nearby bright stars were selected from the offset sky observation, and were then combined into a master sky spectrum. The nebula emission lines were removed from the master spectrum. We extracted the emission lines from each offset sky spectrum corresponding to a given target, and then added them to the emission-subtracted master sky spectrum. Figure 2 shows a comparison of an offset sky spectrum with a synthetic one. The [N II] 6548 line was not considered in this work because its strength was comparable to the noise level of target spectra. The observed spectra of faint PMS stars were corrected by subtracting the corresponding synthetic sky spectrum.
We found non-negligible residuals of the nebula emission lines in some target spectra. Since low-mass active PMS stars, in general, show a broad, strong H emission line, it is sometimes difficult to directly distinguish the H emission line of the nebula from that of the target spectra. However, the [N II] 6584 line is strong and well isolated, so assuming the ratio of the [N II] 6584 line to the H emission line is constant within a small local area, we scaled the strength of the two emission lines in the synthetic sky spectrum to that in a given target spectrum by comparing the [N II] 6584 line strength in each spectrum. The fine-tuned sky spectrum was then subtracted from the target spectrum, and the sky-subtracted target spectra, for the same target, were combined into a single spectrum. Finally, the individual target spectra were normalized using the solution found from a cubic spline interpolation to the continuum level.
3 SPECTRAL LINE ANALYSIS
3.1 Estimation of Effective Temperature
The effective temperature is one of the key stellar parameters in the analysis of the spectral lines. Color-temperature relations have been used to estimate the effective temperature of the target stars in a convenient way. The application of this method to the stars in NGC 2264 (catalog ) has an advantage because the amount of interstellar reddening toward the optically visible stars in the cluster ( mag – Sung et al. 1997) is low compared to that toward other clusters in different spiral arms ( mag for Westerlund 1 (catalog ) in the Scutum-Centaurus arm – Lim et al. 2013; 0.5 mag for NGC 6231 (catalog ) in the Sagittarius-Carina arm – Sung et al. 2013b; 0.6 mag for NGC 1893 (catalog ) in the Perseus arm – Lim et al. 2014; 0.8 mag for IC 1805 (catalog ) in the Perseus arm – Sung et al. in preparation; 0.9 mag for NGC 1624 (catalog ) in Outer arm – Lim et al. 2015). In addition, differential reddening is not severe among the massive stars.
Spectral features caused by accretion activities can also influence the observed colors. The standard accretion model demonstrates that accretion flows from a circumstellar disk fall onto the stellar surface along the magnetosphere (Uchida & Shibata, 1985; Bertout et al., 1988; Königl, 1991). Hot continuum excess emission and a large variety of recombination lines driven by the accretion process are observed in many young low-mass PMS stars (Calvet & Gullbring, 1998; Hartmann, 1999). Colors, such as and , can be affected, particularly by the hot continuum excess emission. On the other hand, the color is less sensitive to the effects of accretion (Sung et al., 1997), and the color also has higher temperature resolution than for cool stars. For this reason, we applied the versus relation of Bessell (1995) to the stars with and another relation Bessell et al. (1998) to the other cool PMS stars (). For the hotter stars (), the color-effective temperature relations of Sung et al. (2013a) were used in the temperature estimation, because such intermediate-mass stars may have less vigorous accretion activities at the age of NGC 2264 (catalog ). The effective temperature of our sample is distributed in the range of 3500 to 20,000 .
3.2 Measurements of Equivalent Widths
The main spectral feature in this study is the 7Li I 6708 resonance doublet. It is, in most cases, impossible to resolve the doublet separated by 0.1 Å because of rotational broadening. The 6Li doublet also overlaps the red component of the 7Li I doublet. These isotopes are the primordial elements synthesized in the Big Bang. The standard Big Bang nucleosynthesis model predicts that only a small amount of 6Li ( of 7Li) was produced (Fields, 2011). Indeed, the presence of 6Li has barely been confirmed in a few halo stars (Asplund et al., 2006). For the Sun, the fraction of 6Li to the total Li abundance is about 7.59% (Asplund et al., 2009). We assume that the contribution of 6Li to the observed absorption feature is negligible, and therefore the 7Li abundance is considered as the entire Li abundance.
Each configuration of our observations comprises the spectra of different brightness PMS stars. The difference between the brightest and the faintest stars is about 3 mag in the band. For this reason, the spectra of the ten faintest stars were obtained with very low signal levels. In addition, the Li I 6708 line was not detected in the spectrum of star S2587 (6300 ) due to the low signal-to-noise ratio although it is a relatively bright star ( mag). We could not find the Li I absorption line in the spectra of 19 bright PMS stars. The absence of the Li I line in the spectra of 16 of these stars may be attributed to the higher effective temperature (). Only two PMS stars (the star W2350 and S2936 – star identification used in Sung et al. 2008) with a higher effective temperature exhibit a weak Li I line [(Li) 60 – 80 mÅ]. We need to check the membership of the other three Li deficient stars. A detailed discussion on these stars will be made in Section 5.
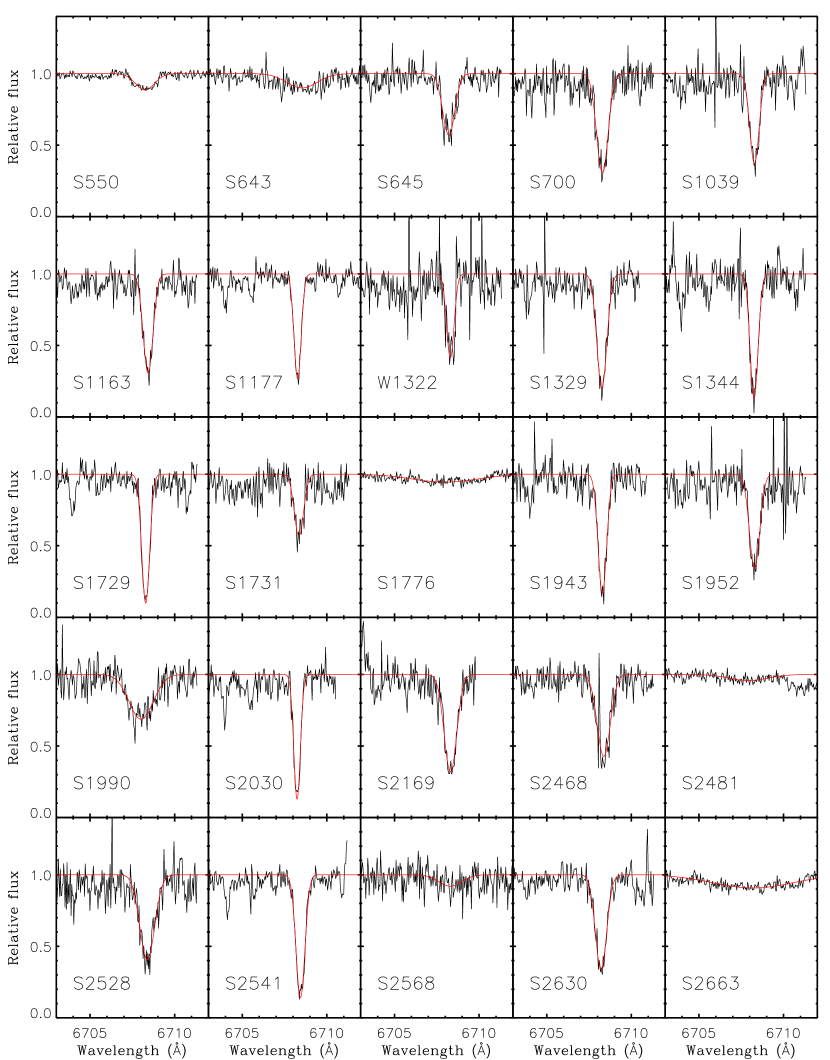
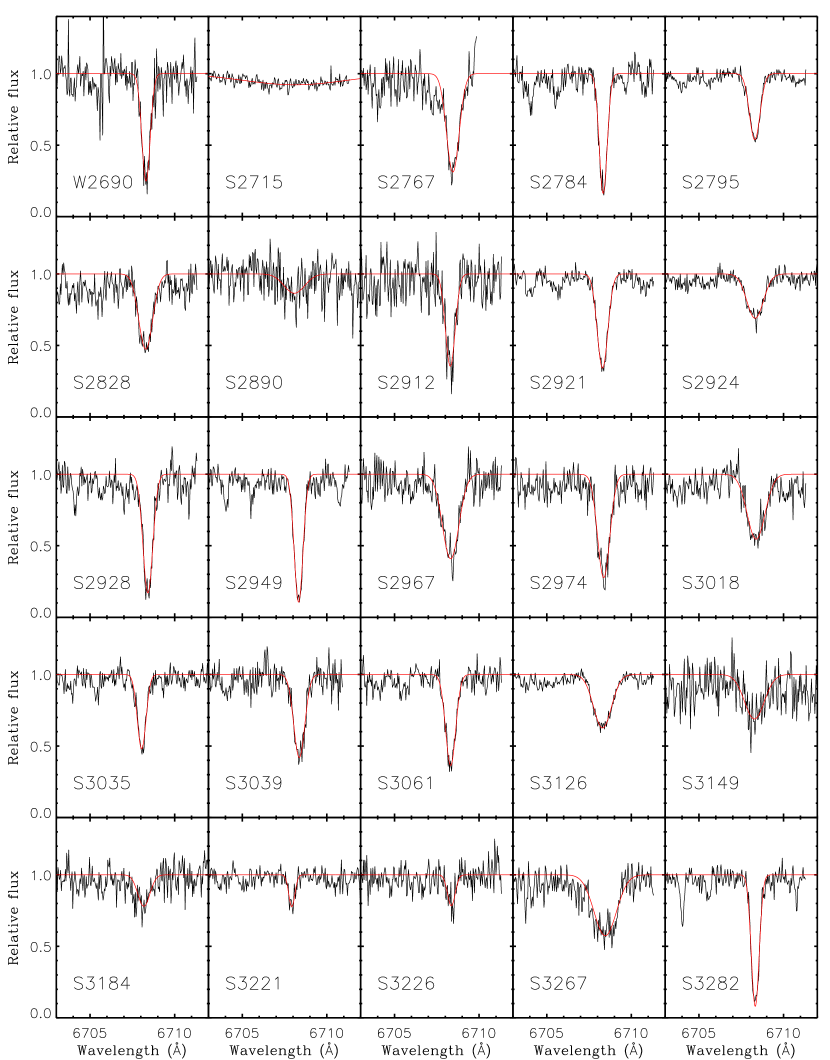
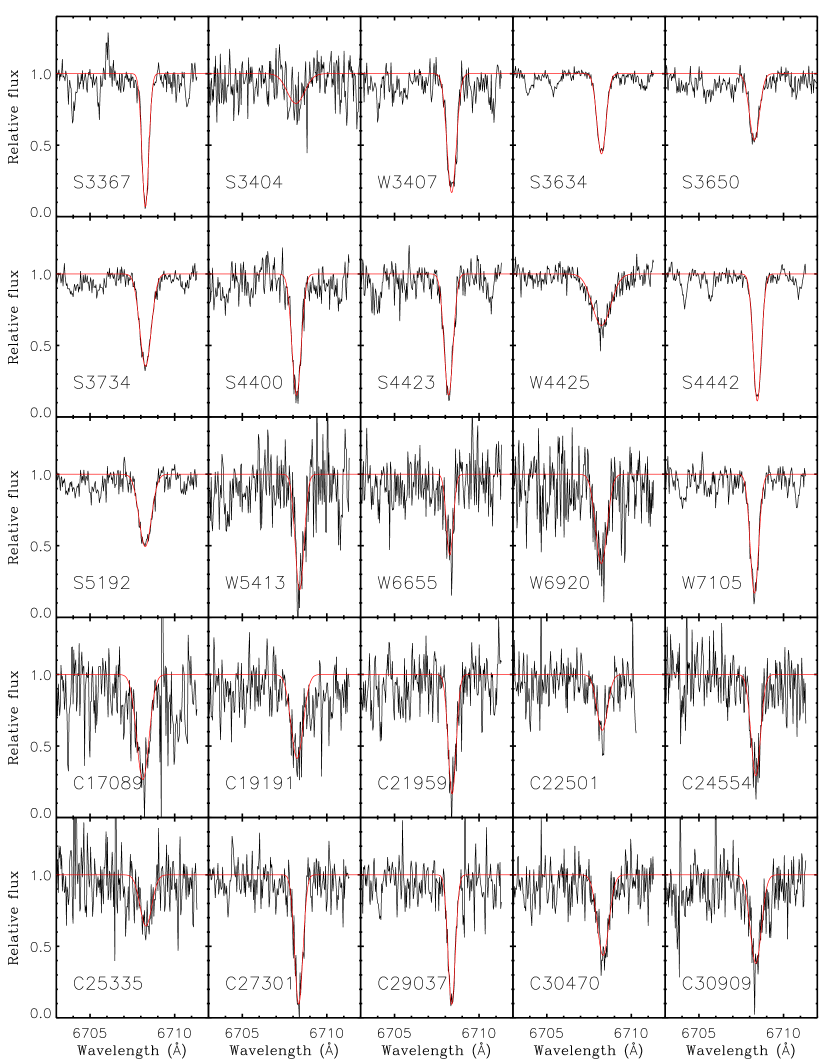
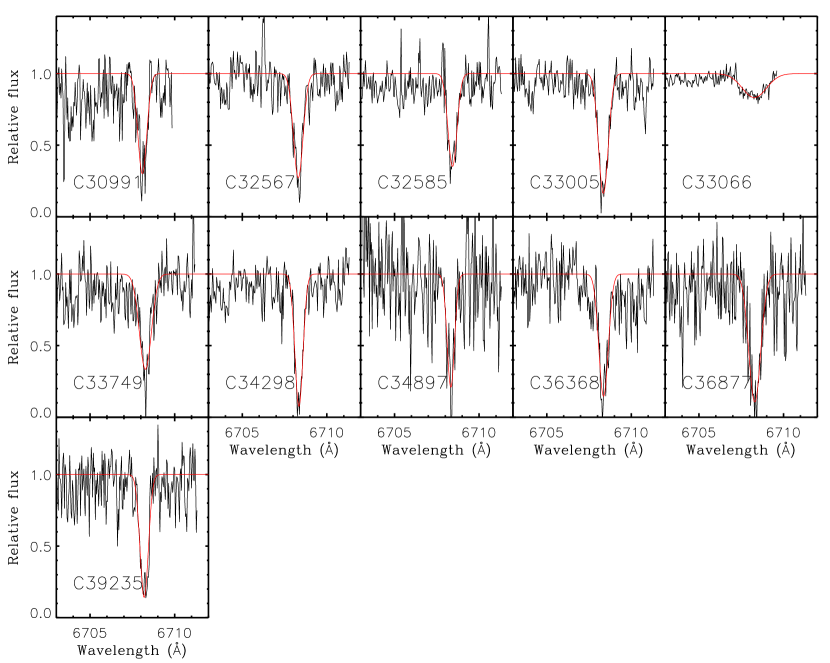
Gaussian profile fitting was used to measure the (Li) of 105 PMS stars. The best fitting solution was obtained with the MPFIT packages (Markwardt, 2009). The (Li) was computed by integrating the best-fit Gaussian profile. We also measured the upper and lower values of (Li) from the Gaussian profiles by altering the Gaussian width and amplitude according to the errors. The upper and lower values were adopted as the uncertainty of the (Li). The uncertainties of the (Li) for 16 faint PMS stars were too large ((Li) 100 mÅ) for them to be used in the study. Figure 3 exhibits the spectra of 86 PMS stars with a detectable Li 6708 doublet. The best-fit Gaussian profiles are overplotted in the figure.
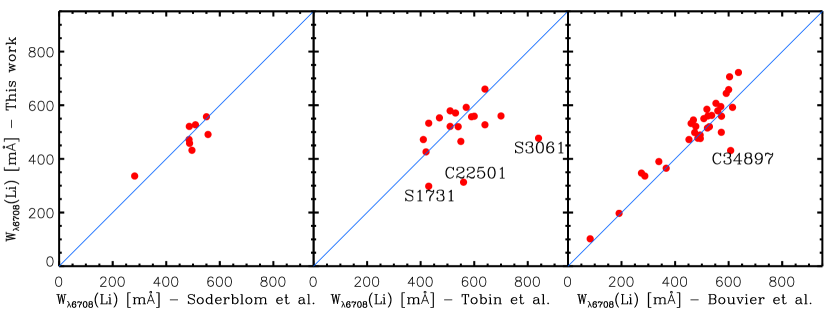
In Figure 7, our (Li) measurements were compared with those of previous studies to check the external consistency. The mean difference between the (Li) of Soderblom et al. (1999) and ours is mÅ. There are three outliers in the comparison with those of Tobin et al. (2015). The small (Li) of the star S1731 and C22501 is related to the veiling effect of the Li I line probably due to the accretion activity at the time of observation (see Section 3.3). However, the spectrum of the other star S3061 was obtained with a reasonable signal, and does not show any accretion features, such as very strong H and He I emission lines. No significant ultraviolet (UV) excess emission was also found from the photometry of Sung et al. (1997). The (Li) of the star may not be associated with the accretion activity. The difference may arise either from the measurement error in Tobin et al. (2015) or from the intrinsic variation of the line strength, because the measurement of Bouvier et al. (2016) for the star is in good agreement with ours ( mÅ). The mean difference between the (Li) of Tobin et al. (2015) and ours is if the outliers were excluded. Our results are also consistent with those of Bouvier et al. (2016) with a mean difference of mÅ for a wide range of (Li). Only one outlier (the star C34897) was found. A slightly large random error may be involved in the (Li) of the star because the star is somewhat faint ( mag). From these comparisons, we confirmed a good external consistency of (Li) measured in this study.
The Li I 6708 line is mainly blended with a neutral iron line located at 6707.4Å. Soderblom et al. (1993a) presented an empirical relation between the (Fe I) and color obtained from old inactive stars without a Li I absorption line. The relation is expressed as . If we use the dereddened colors, the (Fe I) would be underestimated by the UV excess of the color. Therefore, the expected photospheric colors were estimated from the dereddened colors using the versus relation for MS stars (Sung et al., 2013a). We corrected for the contribution of Fe I 6707.4 to the measured (Li) using the relation of Soderblom et al. (1993a).
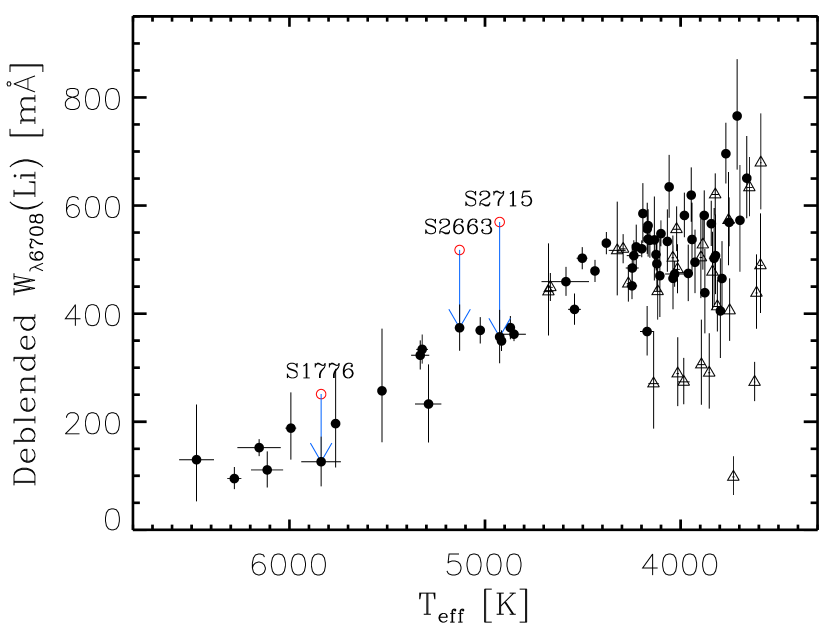
Figure 8 shows (Li) as a function of effective temperature. From this relation, it naturally explains the reason why no Li was detected in the spectra of most intermediate-mass stars. An additional deblending was required for three PMS stars with significant line broadening (S1776, S2663, and S2715 – red open circles in the figure). As seen in Figure 3, Li I 6708 and adjacent Fe I lines in the spectra of these stars are merged into a broad single line. According to the study of Jackson et al. (2016), the stars have a high projected rotational velocity – 133.6km s-1 for S2663 and 193.8km s-1 for S2715. High rotational velocity is likely responsible for the line broadening. Therefore, Fe I 6705.1 and 6710.3 can also affect the (Li) of these stars. In order to minimize their influences on (Li), we used the archival spectra of field stars with almost the same effective temperature as the stars, which were published by the Ultraviolet and Visual Echelle Spectrograph (UVES) Paranal Observatory Project (DDT Program ID 266.D-5655 – Bagnulo et al. 2003). Since the UVES spectra were taken with a very high signal-to-noise ratio, their (Fe I) were directly measured by integrating the absorption lines after continuum normalization. A list of the field stars is presented with their correction values in Table 1. The contribution of the Fe I lines to the (Li) was removed by subtracting the adopted (Fe I). Given the small error bars, several cool stars () appear to actually have small (Li) at a given temperature.
3.3 The Effect of Veiling on the Li 6708 Line
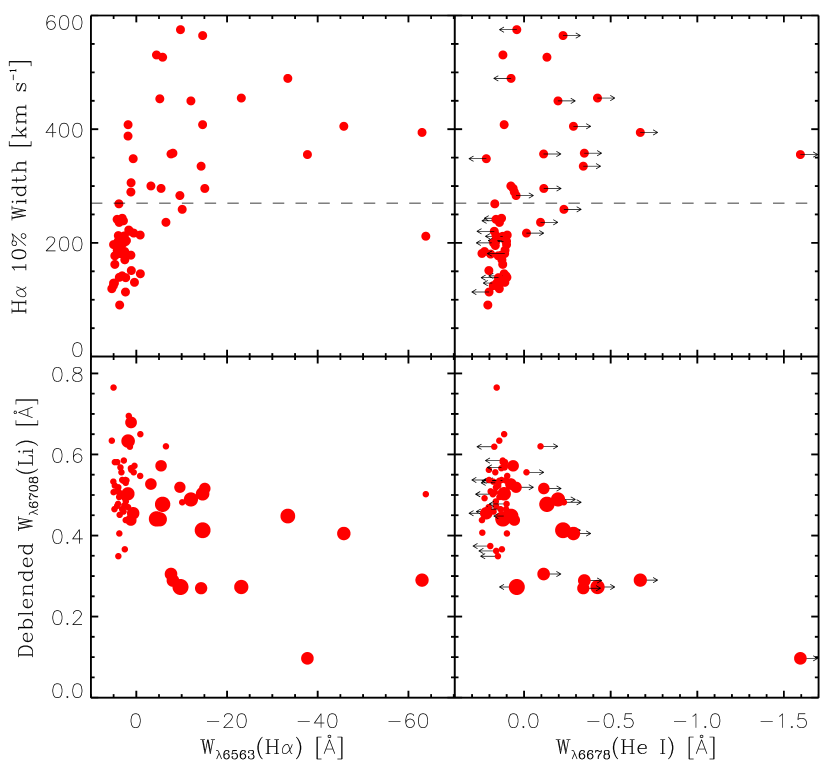
The equivalent widths of spectral lines can be underestimated by excess continuum emission due to mass accretion activity (Calvet & Gullbring, 1998; Lim et al., 2014a). We used the H and He I 6678 emission as a diagnostic tool to probe the veiling effect on (Li). The (H) and (He I) of cool PMS stars () were measured by integrating the observed emission lines. In the case of the He I line, we computed the equivalent width of the line core within a narrow wavelength range of 0.7Å to minimize the contribution of the error in the continuum level. For this reason, the (He I) of the absorption line for moderately fast rotators may be underestimated, while strong (He I) emission stars may have slightly larger equivalent widths (smaller equivalent widths in absolute scale). It is known that the full width at 10% of peak H flux (hereafter 10% width) is closely related to the mass accretion rate of PMS stars (White & Basri, 2003; Muzerolle et al., 2005). The profiles of H emission lines in the spectra of some active stars are depressed by either blueshifted or redshifted absorption components. The emission line profile can be restored by a Gaussian function fitted to the observed wing profile. The 10% widths from the best-fit Gaussian profiles were then obtained for 66 stars.
In the upper left-hand panel of Figure 9, stars with a weak H emission component tend to have relatively narrow 10% widths (100 – 250km-1), while stars with a wide velocity width show a wide spread of (H). A similar feature can be found for the He I 6678 line in the right-hand panel of the figure. Since the stars can be divided into two groups at 250 – 270 km s-1 in the distribution of the (H) and (He I), we adopted 270 km s-1 as a selection criterion for the accreting stars. This value is the same criterion as that of White & Basri (2003), but larger than that of Muzerolle et al. (2005). In addition, stars showing a He I 6678 emission line were also selected as accreting stars because the He emission line is known to form in postshock regions (Beristain et al., 2001). It is confirmed that a total of 27 stars have either a broad H emission line or a He I emission line, or both. If the spectral lines are veiled by accretion activities, (Li) may be underestimated. The lower panels of Figure 9 show the variations of (Li) with respect to (H) and (He I). Stars with strong emission lines shows a tendency to have a smaller (Li).
The highly veiled and little veiled stars may have different surface coverage of the shocked regions (Calvet & Gullbring, 1998), and the lifetime of hot spots created by the accreted materials may also be different for a different accretion rate. The intensive time series observations of some PMS stars in NGC 2264 (catalog ) show aperiodic or periodic brightening events in their light curves on a timescale of several hours to 30 days (Stauffer et al., 2014, 2016). The aperiodic events are related to the variable mass accretion rate, and the rotational modulation of long-lived hot spots is responsible for the periodic light curves. These stars tend to have bluer than other stars at a given (i.e. UV excess emission), and a strong H emission line. The variation of (Li) of a few accreting stars was monitored with the continuum level in one of the previous studies. (Li) appears to weaken as the star brightens. This fact may indicate that the stars with small (Li) ( 300 mÅ) at in Figure 8 are highly veiled stars.
3.4 Lithium Abundance
Soderblom et al. (1993a) published curves of growth (COG) for the Li I 6708 resonance doublet under the conditions of local thermodynamic equilibrium (LTE) for the effective temperature range of 4000 – 6500 . The deblended (Li) of the PMS stars hotter than 4500 was converted to LTE abundances using these COG. The LTE abundance of the cooler stars was determined from the COG of Zapatero Osorio et al. (2002). The abundance is based on the scale of . We also corrected for non-LTE effects using the calculations of Carlsson et al. (1994) for stars hotter than . The correction values are about 0.1 – 0.2 dex for the solar metallicity. As Pavlenko et al. (1995) has shown that the difference between the LTE and non-LTE abundances becomes negligible at K, the non-LTE effects were not taken into account for the cooler stars. We summarize all the measurements in Table 2.
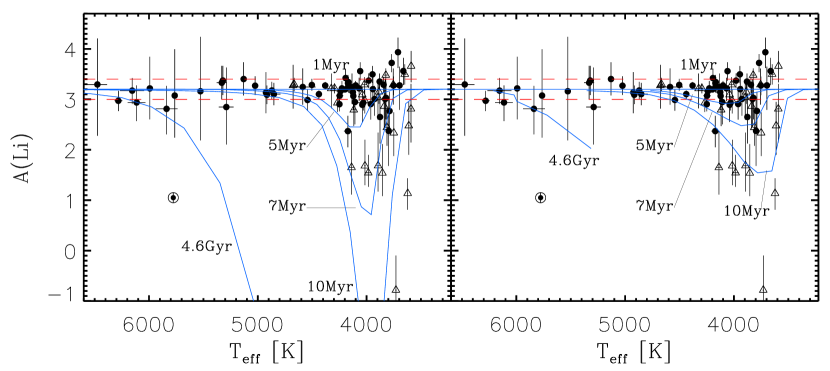
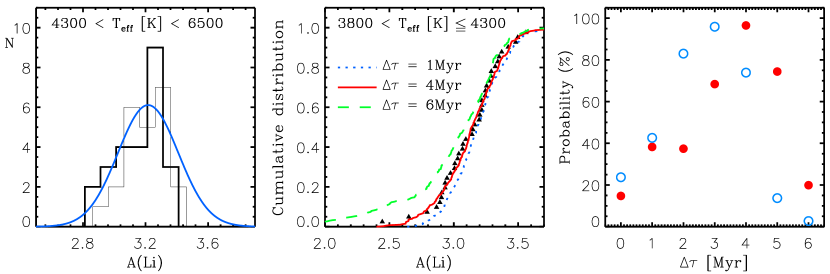
Figure 10 displays the Li abundance of the PMS members in NGC 2264 (catalog ) with respect to the effective temperature. We investigated the distribution of the Li abundance as shown in the left-hand panel of Figure 11, where only stars hotter than 4300 were used to avoid any variation of Li abundance with age. The abundance peak appears at 3.2, and a 1 error is about 0.2 dex. The result is consistent with the initial Li abundance in nearby star forming regions (Magazzú et al., 1992; Cunha et al., 1995; King, 1998), as well as the remaining Li abundance of solar system meteorites (Asplund et al., 2009). It may be the initial abundance of the natal cloud from which the cluster formed.
We present several PMS isochrones from two different evolutionary model grids in Figure 10 (Siess et al., 2000; Baraffe et al., 2015), where the initial Li abundance of 3.2 was adopted. The Li abundance of the Sun [A(Li) = 1.05 – Asplund et al. 2009] is also shown as the solar symbol with the 4.6 Gyr isochrone from the models in order to check which model properly predicts the solar Li abundance. However, neither of the models can explain the solar Li abundance. A possible explanation for the low Li abundance of the Sun may be non-standard depletion processes, such as rotational mixing and microscopic diffusion during the MS stage (Chaboyer et al., 1995) or the imperfect treatment of the convection zone in the PMS models.
The two evolutionary model grids predict a different amount of Li at the same age for cool stars (). In the Siess models, Li is depleted by 0.7 dex at 5 Myr and 2.5 dex at 7 Myr, and little Li remains at 10 Myr. On the other hand, the Baraffe models predict a rather smaller depletion of Li, i.e. about 0.3, 0.7, and 1.7 dex at 5, 7, and 10 Myr, respectively. Our measurements show a wide span of Li abundance for the cool stars [ to ]. However, the stars pretending to be old are all the highly veiled stars. They show a small Li abundance because of their underestimated (Li). Had we included these stars in the relative age estimation, the age spread of NGC 2264 (catalog ) would be larger than 10 Myr. This is a similar situation to the photometric age estimation from the CMDs, where the CMDs are a kind of snapshot taken at an arbitrary epoch, and it is very difficult to discriminate the displacement of colors and magnitude due to the veiling effect, as well as due to the obscuration of clumpy material. On the other hand, the veiling effect on the Li abundance can be recognized by using the correlations between the strength of various emission lines and the (Li) as above. The obscuration by disk material may only be a minor source affecting the measured (Li) (Stauffer et al., 2014). The presence of a large age spread among cool PMS stars can be confirmed from the distribution of their Li abundance if they are genuine Li depleted old PMS members in the cluster. If we exclude the highly veiled stars from our sample, the apparent age spread among the PMS stars is likely about 5 – 7 Myr. But given the size of the observational errors, the age spread may in fact be smaller than this value.
4 AGE SPREAD AND CLUSTER FORMATION TIMESCALE
The age of PMS stars can be estimated from the A(Li)- plane using the evolutionary models, however there are several practical difficulties. It is impossible to estimate the age of PMS stars with A(Li) larger than 3.2, and Li depletion is insignificant within the first 3 Myr. Somewhat large errors in age estimation could be introduced by the scatter of Li abundance. The observed scatter may be a mix of observational errors due to their faintness, intrinsic variations due to stellar activity, and evolutionary effects. The variation of Li abundance due to stellar activity are likely much smaller than the observational error (Pallavicini et al., 1993; Mallik, 1998; Soriano et al., 2015), therefore the effects of stellar activity on Li abundance can be ignored. For higher mass stars (), Li depletion is terminated on a very short timescale because their radiative core is rapidly developed (Soderblom et al., 2014). The Li abundance of the higher mass stars may be insensitive to effects of evolution within 10 Myr. Hence, observational errors can be exclusively inferred from the distribution of their Li abundance, as shown in the left-hand panel of Figure 11. If the error from the A(Li) distribution is a true uncertainty due to observational error over the whole mass range, an observed scatter that is larger than the observational error may indicate the underlying age spread. Instead of a direct age estimation of individual stars, we conducted multiple sets of simulations for a range of observational errors in order to estimate the underlying age spread.
Stars in the effective temperature range of 3800 to 4300 were selected as a subsample because the Li abundances of these stars are most sensitive to age. Highly veiled stars [(Li) 300 mÅ] were excluded from the subsample of 41 PMS stars. A total of seven model clusters were created to reproduce the distribution of Li abundances using a Monte-Carlo method. The individual cluster contained 1000 stars in the mass range 0.4 to 1.4 . The underlying initial mass function was assumed to be ( – Sung & Bessell 2010). The age of the model clusters was set to 3 Myr (Sung & Bessell, 2010), and age spreads of 0 – 6 Myr were applied to the clusters with a 1 Myr interval, respectively. The evolutionary models of Baraffe et al. (2015) for PMS stars were adopted for assigning the effective temperature and Li abundance of individual stars of the model clusters. The observational error adopted had the same distribution as our measurements (1 = 0.2 dex, see the left-hand panel of Figure 11).
The middle-panel of Figure 11 exhibits the cumulative distribution of Li abundance for the subsample and model clusters over the same effective temperature range. The extent of the tail toward small Li abundance becomes evident for a large age spread. The Li abundance distribution of the model cluster (red solid line) with an age spread of 4 Myr seems to well reproduce the observed one (triangles). The abundance distributions of the seven model clusters were assumed to be the same as the parent population for a given age spread. We quantitatively investigated which parent population gives the best match to the observed Li distribution using the Kolmogorov–Smirnov test. The probabilities in percentile are displayed in the right-hand panel of Figure 11. The 4 Myr spread model shows a 96.5% match to the Li distribution of the subsample. The 3 Myr and 5 Myr spread models have a similar distribution at % confidence level.
We performed the same simulations for the PMS evolutionary models of Siess et al. (2000). The results from these simulations are also plotted by open circles in the right-hand panel of Figure 11. The trends are very similar to each other, however the age spread of the model cluster which most closely reproduces the observed distribution of Li abundances was 3 Myr, 1 Myr smaller than the result based on the Baraffe models. The age spread of other probable model clusters at a confidence level greater than 70% appears at 2 Myr and 4 Myr, respectively. Our results indicate that the extended star formation scenario ( Myr) can be ruled out for NGC 2264 (catalog ) regardless of evolutionary models. The formation of optically visible stars in the cluster may be complete within 3 – 4 Myr.
On the other hand, multiple sets of the same simulations were also conducted with different observational errors of 1 = 0.05, 0.10, 0.15 and 0.30 dex in order to test the validity of the adopted observational error. These model clusters give different cumulative distributions in Li abundance. The slope of the cumulative distributions of the model clusters adopting an error of 0.05 dex is steeper than that of the observed subsample, while the model clusters with a large error of 0.3 dex give shallower slopes. We investigated the similarity between the subsample and the model clusters through the Kolmogorov–Smirnov test. Table3 shows the underlying age spreads of the most probable model cluster and confidence levels. While the model clusters adopting the smallest and largest errors give completely different age spreads with low confidence levels, the age spread of the others are very similar to each other. The confidence level for the observational error adopted in this study (0.2 dex) appears higher than the others. Hence, the adopted error of 0.2 dex is likely the true uncertainty.
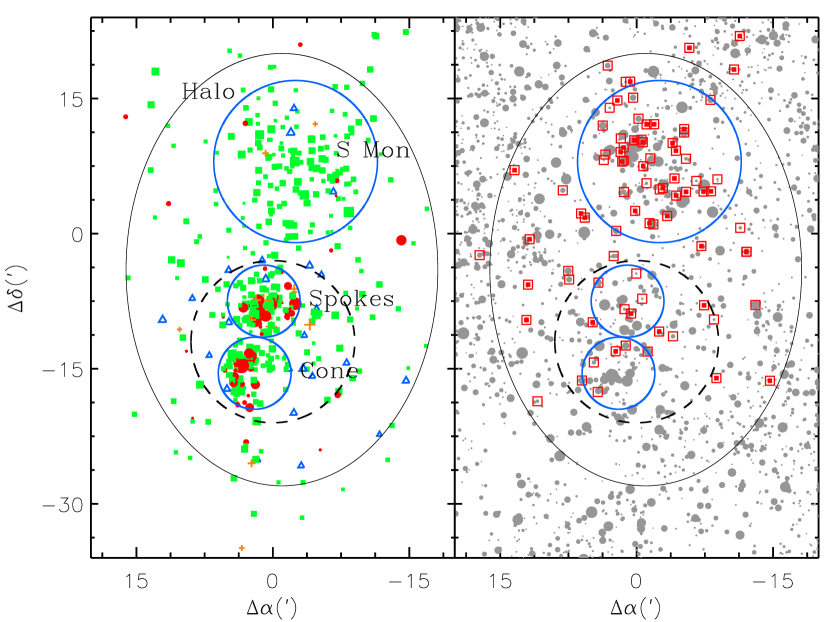
According to Fűrész et al. (2006) and Sung et al. (2009), NGC 2264 (catalog ) is comprised of at least three subclusters – S Mon (catalog ), Spokes (catalog ), and Cone (catalog ) nebula regions as shown in Figure 12. In addition, a low stellar density region (halo) surrounds these subclusters (Sung et al., 2008). The largest subcluster S Mon (catalog ) contains not only the high-mass multiple system S Mon (O7V + early B + ? – Sota et al. 2011) but also a large number of Class II objects. However, the number of Class I objects is much smaller than that of the other embedded or partially embedded subclusters, the Spokes (catalog ) and Cone (catalog ) nebula regions. It may imply the presence of an age difference among these subclusters. Sung & Bessell (2010) suggested an outside-in sequential star formation scenario within NGC 2264 (catalog ) from the age distribution of the PMS stars. A nearby supernova explosion about 6 – 7 Myr ago was suspected as the source of the external trigger.
The presence of the subclusters can also be found in the velocity field obtained from 13CO observations and stellar radial velocity survey (Fűrész et al., 2006; Tobin et al., 2015). The radial velocity distribution of the cluster members shows a velocity gradient of 10 km s-1 along the north-south direction. The stars in the S Mon (catalog ), Spokes (catalog ), and Cone nebula (catalog ) regions are moving away from the Sun by 19 – 24 km s-1, 18 – 21 km s-1, and 20 – 24 km s-1, respectively. 13CO gas shows almost the same kinematics as that of the member stars. Based on the simulations of Burkert & Hartmann (2004), the velocity structure of the subclusters was interpreted as the result of gravitational focusing in an inhomogeneous molecular cloud with a finite size and non-spherical shape.
Most of stars in the subsample are located either in the S Mon (catalog ) region or the halo region (see the right-hand panel of Figure 12). If the star formation history suggested by Sung & Bessell (2010) is true, an age spread of 3 – 4 Myr may be the time duration of the star formation activity propagated from the halo to the S Mon (catalog ) region. A large number of stars in the Spokes (catalog ) and Cone (catalog ) nebula regions are still embedded in the cloud. The high number ratio of Class I to Class II objects indicates that the subclusters in the regions have been formed recently relative to the other regions. If we adopt the median age of the individual subclusters from Table 2 of Sung & Bessell (2010), the age difference between the halo and Spokes (catalog ) + Cone nebula (catalog ) regions is about 1 Myr. Hence, the stellar population in the entire region of NGC 2264 (catalog ) may have formed within 5 Myr.
5 DISCUSSIONS ON THE Li DEFICIENT STARS
Figure 13 exhibits the () CMD of the PMS stars observed in this work. It is difficult to identify the Li I 6708 doublet in the spectra of PMS stars (blue square) with blue colors () because these stars, in general, show a large rotational broadening and an intrinsically small (Li) due to their higher effective temperature. Actively accreting PMS stars (open triangle) are mostly subsolar mass stars. These stars show a large spread in magnitude at a given color, and this fact shows that accretion activity is a source of the observed spread. On the other hand, the faint end of the observing selection for bright stars appears at mag, and the limiting magnitude of the faint star selection is about mag. (Li) could be barely measured for some of the faint stars near the limiting magnitude, but the uncertainty is somewhat large (asterisks). For the other stars in the faintest group, we could not find any detectable Li line in their spectra because of low signal-to-noise ratios. Further observations with a larger telescope for these stars are required to identify the presence of the Li line.
There are three Li deficient stars among relatively bright targets. The properties of these stars were investigated using available information in the previous studies. We list the stars with photometric data in Table 4 and plot their spectra in Figure 14. The star S2223 (V642 Mon (catalog )) was selected as an X-ray emission member of NGC 2264 (catalog ) from the Chandra X-ray data (Sung et al., 2004). The star shows a weak H absorption line and broad metallic lines. Fűrész et al. (2006) identified the star as a spectroscopic binary from their multi-epoch spectroscopic observations. The star is brighter than other stars at a given color in Figure 13. If we assume that the object is a nearly equal-mass binary system, the brightness of individual component will be lower by about 0.75 mag. However, each component is still brighter than other PMS members with almost the same colors. We considered the object as a foreground active binary system to reconcile the two independent facts, their high brightness and Li deficiency.
A pair of late-type stars is likely to constitute the binary system given the weak H absorption line and the red color. Since the foreground reddening toward NGC 2264 (catalog ) is nearly zero, the spectral type of the primary star could be K2 according to its color. We considered a binary system comprising two equal-mass MS stars. The absolute magnitude of the equal-mass binary is 5.5 mag where the absolute magnitude of a K2V star is about mag (Sung et al., 2013a). Using the magnitude of the object in Table 4, the distance modulus of the binary system is about 6.3 mag ( pc). On the other hand, a binary system with a very small mass ratio (e.g. K2V + M3V) was also considered. In this case, the composite absolute magnitude is almost the same as the absolute magnitude of a single K2V star ( mag – Sung et al. 2013a). The distance to this binary system is then about 124 pc. Given that this object was identified as a double-lined binary by Fűrész et al. (2006), the mass of the companion star must be comparable to that of the K2V star. The former case is a more appropriate situation to explain the overall properties of the object. Hence, S2223 is likely an X-ray emitting binary system consisting of two early K-type stars within 182 pc.
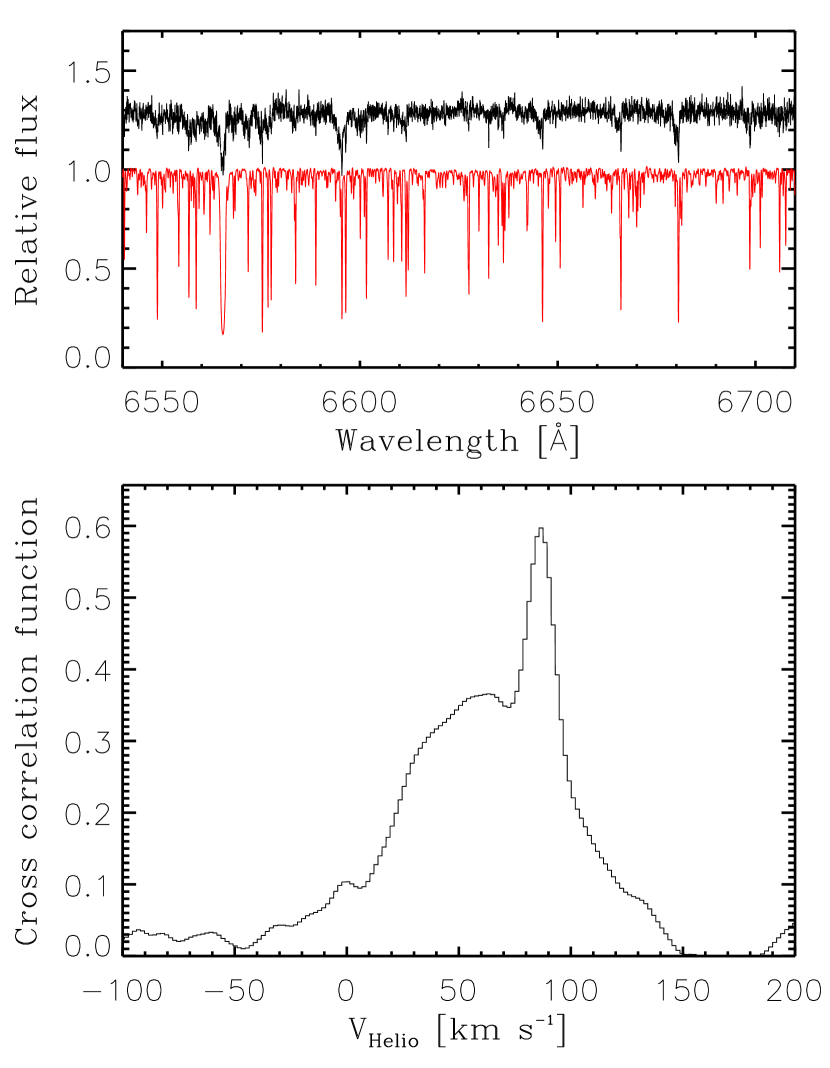
The star S3755 is also known as an X-ray emission star (Dahm et al., 2007). In Figure 13, the star appears brighter than other stars at a given color. Therefore, the Li deficiency could be explained by other factors. The high resolution UVES spectrum of HD 320868 (catalog ) (K5 – Bagnulo et al. 2003) was used as a template to investigate its cross correlation function. In Figure 15, the cross-correlation function shows two components, a sharp peak on a broad profile. The star seems to have a composite spectrum of two stars. The heliocentric radial velocities of the sharp and broad components are about 85.5 and 61.4 km s-1, respectively. The narrow component including H absorption line in the spectrum of S3755 shows a reasonable match to that of HD 320868 (catalog ) with a cross correlation amplitude of 0.59. In addition, the red color indicates that one of the components may be a late-K-type star. Although the cross correlation functions with the UVES spectra of other G8V and K2V stars were also investigated to constrain the spectral type of the companion, the cross correlation amplitude insignificantly varied in the spectral type range. A appreciable contribution of the K-type star to the spectrum of S3755 may imply that the other companion star may have a comparable flux.
If the binary system had comprised two young K-type stars, the Li I line would be detectable. The spectrum of S3755 shows an H line in absorption, while most of the K-type members of NGC 2264 (catalog ) in this study show an H emission line. We, therefore, considered the object as a pair of two K5V stars in the foreground based on the -spectral type-color relations of Sung et al. (2013a) as applied to S2223. The absolute magnitude of the binary system was estimated to be 6.5 mag, where an absolute magnitude of 7.3 mag was adopted for each star. If the foreground reddening toward the stars is assumed to be zero, the distance modulus of the binary system is about 7.4 mag, equivalent to 302 pc. The same calculation was also carried out for a pair of K0V and K5V stars. In this case, the object would be located at 442 pc from the Sun. The photometric and spectroscopic properties of S3755 could be explained by those of a foreground binary system consisting of late-type stars with an X-ray emission within 300 – 500 pc.
The star W2320 (LkH 4 (catalog )) was selected as the member of the cluster from H photometry (Sung et al., 2008). The spectrum of the star shows a moderately strong H emission line with a blueshifted absorption component (Figure 14). The 10% width of the emission line is about 529 km s-1. The most distinctive feature is the presence of the diffuse interstellar band (DIB) at 6614Å. Such an interstellar absorption line could not be found in the spectra of other members. The (DIB) is 295 mÅ, and it implies that the reddening toward the star is about from the (DIB) versus relation (Lan et al., 2015). Since this star is located toward the less reddened field region of NGC 2264 (catalog ), the reddening of the stars is unlikely to be caused by the molecular cloud associated with NGC 2264. We speculate that the star may be a background cataclysmic variable given its spectral features are similar to those of a few cataclysmic variables, such as V363 Aur (catalog ) or SDSSJ143317.78+101123.3 (catalog ) (Horne et al., 1982; Tulloch et al., 2009).
6 SUMMARY AND CONCLUSIONS
The duration of the star formation activity in a cluster is basic information to understand the formation process of star clusters. A large number of previous studies have attempted to estimate the cluster formation timescale from the CMDs using various evolutionary models for PMS stars. Their age spread was found to be typically larger than 5 Myr, up to 20 Myr for extreme cases (Cignoni et al., 2015). However, a few critical limitations of the age estimation from the evolutionary models have been pointed out (Sung et al., 1997; Hartmann, 2003), e.g., systematically old age for intermediate-mass PMS stars. The observational uncertainties are too large to precisely estimate the age of individual PMS stars relative to a luminosity interval among different age isochrones. In this current study, Li abundance was used as a relative age indicator among PMS stars, as an alternative way to investigate the age spread in a cluster. NGC 2264 (catalog ) is an ideal target for this study because (1) the cluster is very close, (2) more than one thousand members are known, (3) the foreground reddening is nearly zero, (4) the differential reddening across the cluster is very small (Sung et al., 1997), and (5) a large age spread (10 Myr) has been reported in previous studies (Palla & Stahler, 2000). We summarize our results and conclusion on the age spread of the PMS members in NGC 2264 (catalog ) as below.
A total of 134 PMS members were observed with the multi-object echelle spectrograph Hectochelle attached to the 6.5m MMT. Although the Li I 6708 resonance doublet could not be identified in the spectra of most intermediate-mass PMS stars, we successfully detected the Li line in the spectra of 86 PMS stars and measured (Li) using Gaussian profile fitting. The contributions of adjacent neutral iron lines to the (Li) were removed using the empirical relation of Soderblom et al. (1993a) and UVES archival spectra of field stars (Bagnulo et al., 2003) for the blended case.
The (Li) of cool stars () shows a large spread of 400 mÅ. We investigated a few relations between the (Li) and indicators of accretion activity, such as H and He I 6678 emission lines. The relations indicated that the (Li) can be affected by the veiling effect for the stars with 10% width of a H emission line 270 km s-1 or a He I 6678 emission line. Cool PMS stars () with (Li) smaller than 300 mÅ turned out to be highly veiled stars, not stars with weak Li lines due to their older age.
LTE Li abundance was derived by interpolating the Li I 6708 COGs of Soderblom et al. (1993a) and Zapatero Osorio et al. (2002), and then corrected for non-LTE effects using the relations of Carlsson et al. (1994). The initial Li abundance of the natal cloud which forms NGC 2264 (catalog ), was estimated to be A(Li) from the abundance distribution of the stars with the effective temperature of 4300 to 6500 . The result is in good agreement with that of previous studies for nearby star forming regions.
The age of individual PMS stars could not be estimated from Li isochrones because of the large observational errors relative to the variation of Li abundance with age. Instead, the underlying age spread among PMS stars (), except for the highly veiled stars, was inferred from multiple sets of Monte-Carlo simulations considering the observational error. The simulations adopting an age spread of 3 – 4 Myr appear to well reproduce the distribution of observed Li abundances. As most of the stars used in this study are located in S Mon (catalog ) region or halo region, and given the embedded population in the Spokes (catalog ) and Cone (catalog ) nebula regions, the formation timescale of the entire region of NGC 2264 (catalog ) is likely to be about 4 – 5 Myr. The extremely extended star formation scenarios (Herbig, 1962; Palla & Stahler, 1999, 2000, 2002) can be ruled out, at least for NGC 2264 (catalog ).
We also made careful discussions of three Li deficient cool stars. The star ID S2223 was known to be a spectroscopic binary (Fűrész et al., 2006). The star S3755 also turned out to be a double-lined binary from cross correlation techniques. The photometric and spectroscopic properties indicate that both these objects are foreground binary systems consisting of two late-type stars. In the case of W2320, the object shows a strong interstellar absorption line at 6614 Å in its spectrum. This object is therefore considered a background star from the large extinction obtained from (DIB). The spectral features of W2320 resemble those of cataclysmic variables. These Li deficient stars are unlikely to be members of NGC 2264 (catalog ).
References
- Asplund et al. (2009) Asplund, M., Grevesse, N., Sauval, A. J., & Scott, P. 2009, ARA&A, 47, 481
- Asplund et al. (2006) Asplund, M., Lambert, D. L., Nissen, P. E., Primas, F., & Smith, V. V. 2006, ApJ, 644, 229
- Bagnulo et al. (2003) Bagnulo, S., Jehin, E., Ledoux, C., et al., 2003. The Messenger 114, 10
- Ballesteros-Paredes et al. (1999) Ballesteros-Paredes, J., Hartmann, L., & Vázquez-Semadeni, E. 1999, ApJ, 527, 285
- Baraffe et al. (2015) Baraffe, I., Homeier, D., Allard, F., & Chabrier, G. 2015, A&A, 577, 42
- Beristain et al. (2001) Beristain, G., Edwards, S., & Kwan, J. 2001, ApJ, 551, 1037
- Bertout et al. (1988) Bertout, C., Basri, G., & Bouvier, J. 1988, ApJ, 330, 350
- Bessell (1995) Bessell, M. S., 1995, in Proc. ESO Workshop, The Bottom of the Main Sequence and Beyond, ed. C. G. Tinney (Berlin:Springer), 123
- Bessell et al. (1998) Bessell, M. S., Castelli, F., & Plez B., 1998, A&A, 333, 231
- Bodenheimer (1965) Bodenheimer, P. 1965, ApJ, 142, 451
- Boesgaard (1987) Boesgaard, A. M. 1987, PASP, 99, 1067
- Boesgaard & Tripicco (1986) Boesgaard, A, M., & Tripicco, M. J. 1986, ApJ, 302, L49
- Bouvier et al. (2016) Bouvier, J., Lanzafame, A. C., Venuti, L., et al. 2016, A&A, 590, 78
- Burkert & Hartmann (2004) Burkert, A., & Hartmann, L. 2004, ApJ, 616, 288
- Calvet & Gullbring (1998) Calvet, N., & Gullbring, E. 1998, ApJ, 509, 802
- Carlsson et al. (1994) Carlsson, M., Rutten, R. J., Bruls, J. H. M. J., & Shchukina, N. G. 1994, A&A, 288, 860
- Chaboyer et al. (1995) Chaboyer, B., Demarque, P., & Pinsonneault, M. H. 1995, ApJ, 441, 876
- Cignoni et al. (2015) Cignoni, M.; Sabbi, E.; van der Marel, R. P., et al. 2015, ApJ, 811, 76
- Cunha et al. (1995) Cunha, K., Smith, V. V., & Lambert, D. L. 1995, ApJ, 452, 634
- Dahm & Simon (2005) Dahm, S. E., & Simon, T. 2005, AJ, 129, 829
- Dahm et al. (2007) Dahm, S. E., Simon, T., Proszkow, E. M., & Patten, B. M. 2007, AJ, 134, 999
- Duncan (1981) Duncan, D. K. 1981, ApJ, 248, 651
- Duncan & Jones (1983) Duncan, D. K., & Jones, B. F. 1983, ApJ, 271, 663
- Elmegreen (2000) Elmegreen, B. G. 2000, ApJ, 530, 277
- Feng & Krumholz (2014) Feng, Y., & Krumholz, M. R. 2014, Nature, 513, 523
- Fields (2011) Fields, B. D. 2011, Ann. Rev. Nucl. Part. Sci., 61, 47
- Flaccomio et al. (1999) Flaccomio, E., Micela, G., Sciortino, S., et al. 2006, A&A, 345, 521
- Fűrész et al. (2006) Fűrész, G., Hartmann, L. W., Szentgyorgyi, A. H., et al. 2006, ApJ, 648, 1090
- Hartmann (1999) Hartmann, L. 1999, NewA Rev., 43, 1
- Hartmann (2001) Hartmann, L. 2001, AJ, 121, 1030
- Hartmann (2003) Hartmann, L. 2003, ApJ, 585, 398
- Herbig (1962) Herbig, G. H. 1962, ApJ, 135, 736
- Herbig (1965) Herbig, G. H. 1965, ApJ, 141, 588
- Horne et al. (1982) Horne, K., Lanning, H. H., & Gomer, R. H. 1982, ApJ, 252, 681
- Jackson et al. (2016) Jackson, R. J., Jeffries, R. D., Randich, S., et al. 2016, A&A, 586, 52
- Kamezaki et al. (2014) Kamezaki, T., Imura, K., Omodaka, T., et al. 2014, ApJS, 211, 18
- Kiminki et al. (2015) Kiminki, M. M., Kim, J. S., Bagley, M. B., Sherry, W. H., & Rieke, G. H. 2015, ApJ, 813, 42
- King (1998) King, J. R. 1998, AJ, 116, 254
- Königl (1991) Königl, A. 1991, ApJ, 370, 39
- Lada & Lada (2003) Lada, C., & Lada, E. 2003, ARA&A, 41, 57
- Lan et al. (2015) Lan, T.-W., Bénard, B., & Zhu, G. 2015, MNRAS, 452, 3629
- Lim et al. (2013) Lim, B., Chun, M.-Y., Sung, H., et al. 2013, AJ, 145, 46
- Lim et al. (2015) Lim, B., Sung, H., Bessell, M. S., Kim, J. S., Hur, H., & Park, B.-G. 2015, AJ, 149, 127
- Lim et al. (2014a) Lim, B., Sung, H., Kim, J. S., Bessell, M. S., & Karimov, R., 2014, MNRAS, 438, 1451
- Lim et al. (2014) Lim, B., Sung, H., Kim, J. S., Bessell, M. S., & Park, B.-G. 2014, MNRAS, 443, 454
- Mackey & Broby Nielsen (2007) Mackey, A. D., & Broby Nielsen, P. 2007, MNRAS, 379, 151
- Magazzú et al. (1992) Magazzú, A., Rebolo, R., & Pavlenko, Y. V. 1992, ApJ, 392, 159
- Mallik (1998) Mallik, S. V. 1998, A&A, 338, 623
- Markwardt (2009) Markwardt, C. B. 2009, in ASP Conf. Ser. 411, Astronomical Data Analysis Software and Systems XVIII, ed. D. Bohlender, D. Durand & P. Dowler (San Francisco, CA: ASP), 251
- Milone et al. (2009) Milone, A. P., Bedin, L. R., Piotto, G., & Anderson, J. 2009, A&A, 497, 755
- Mouschovias et al. (1985) Mouschovias, T C., Paleologou, E. V., & Fiedler, R. A. 1985, ApJ, 291, 772
- Muzerolle et al. (2005) Muzerolle J., Luhman K. L., Briceño C., Hartmann L., Calvet N., 2005, ApJ, 625, 906
- Navascués et al. (2001) Navascués, D. B. y., García López, R. J., Severino, G., & Gomez, M. T. 2001, A&A, 371, 652
- Pavlenko et al. (1995) Pavlenko, Y. V., Rebolo, R., Martín, E. L., & García López, R. J. 1995, A&A, 303, 807
- Palla et al. (2005) Palla F., Randich S., Flaccomio E., & Pallavicini R. 2005, ApJ, 626, L49
- Palla & Stahler (1999) Palla, F., & Stahler, S. W. 1999, ApJ, 525, 772
- Palla & Stahler (2000) Palla, F., & Stahler, S. W. 2000, ApJ, 540, 255
- Palla & Stahler (2002) Palla, F., & Stahler, S. W. 2002, ApJ, 581, 1194
- Pallavicini et al. (1993) Pallavicini, R., Cutispoto, G., Randich, S., & Gratton, R. 1993, A&A, 267, 145
- Park et al. (2000) Park, B.-G., Sung, H., Bessell, M. S., & Kang Y. H. 2000, AJ, 120, 894
- Piau & Turck-Chiéze (2002) Piau, L., & Turck-Chiéze S. 2002, ApJ, 566, 419
- Pinsonneault (2010) Pinsonneault M. H., 2010, in Charbonnel C., Tosi M., Primas F., Chiappini C., eds, IAU Symp. 268, Light Elements in the Universe. Cambridge Univ. Press, Cambridge, p. 375
- Piotto et al. (2012) Piotto, G., Milone, A. P., Anderson, J., et al. 2012, ApJ, 760, 39
- Porras et al. (2003) Porras, A., Christopher, M., Allen, L., et al. 2003, AJ, 126, 1916
- Shu et al. (1987) Shu, F. H., Adams, F. C., & Lizano, S. 1987, ARA&A, 25, 23
- Siess et al. (2000) Siess, L., Dufour, E., Forestini, M. 2000, A&A, 358, 5931
- Soderblom et al. (2014) Soderblom, D. R., Hillenbrand, L. A., Jeffries, R. D., Mamajek, E. E., & Naylor, T. 2014, Protostars and Planets VI, ed. H. Beuther et al. (Tucson, AZ: Univ. of Arizona Press), 219
- Soderblom et al. (1993a) Soderblom, D. R., Jones, B. F., Balachandran, S., et al. 1993a, AJ, 106, 1059
- Soderblom et al. (1999) Soderblom, D. R., King, J. R., Siess, L., Jones, B. F., & Fischer, D. 1999, AJ, 118, 1301
- Soderblom et al. (1990) Soderblom, D. R., Oey, M. S., & Johnson, D. R. H. 1990, AJ, 99, 595
- Soderblom et al. (1993b) Soderblom, D. R., Pilachowski, C. A., Fedele, S. B., & Jones, B. F. 1993b, AJ, 105, 2299
- Soriano et al. (2015) Soriano, M. F., Strassmeier, K. G., & Weber, M. 2015, A&A, 575, 57
- Sota et al. (2011) Sota, A., Maíz Apellániz, J., Walborn, N. R., et al. 2011, ApJS, 193, 24
- Stauffer et al. (2014) Stauffer, J., Cody, A. M., Baglin, A., et al. 2014, AJ, 147, 83
- Stauffer et al. (2016) Stauffer, J., Cody, A. M., Rebull, L., et al. 2016, AJ, 151, 60
- Sung & Bessell (2010) Sung, H., & Bessell, M. S. 2010, AJ, 140, 2070
- Sung et al. (2004) Sung, H., Bessell, M. S., & Chun, M.-Y. 2004, AJ, 128, 1684
- Sung et al. (2008) Sung, H., Bessell, M. S., Chun, M.-Y., Karimov, R., & Ibrahimov, M. 2008, AJ, 135, 441
- Sung et al. (1997) Sung H., Bessell M. S., & Lee S.-W. 1997, AJ, 114, 2644
- Sung et al. (2013a) Sung, H., Lim, B., Bessell, M. S., et al. 2013a, J. Korean Astron. Soc., 46, 103
- Sung et al. (2013b) Sung, H., Sana, H., & Bessell, M. S. 2013b, AJ, 145, 37
- Sung et al. (2009) Sung, H., Stauffer, J. R., Bessell, M. S. 2009, AJ, 138, 1116
- Szentgyorgyi et al. (2011) Szentgyorgyi, A., Furesz, G., Cheimets, P., et al. 2011, PASP, 123, 1188
- Tassis & Mouschovias (2004) Tassis, Konstantinos, & Mouschovias, T. C. 2004, ApJ, 616, 283
- Tobin et al. (2015) Tobin, J. J., Hartmann, L., Fűrész, G., Hsu, W.-H., Mateo, M. 2015, AJ, 149, 119
- Tulloch et al. (2009) Tulloch, S. M., Rodríguez-Gil, P., & Dhillon, V. S. 2009, MNRAS, 397, 82
- Uchida & Shibata (1985) Uchida, Y., & Shibata, K. 1985, PASJ, 37, 515
- Ventura et al. (2014) Ventura, P., Di Criscienzo, M., D’Antona, F., et al. 2014, MNRAS, 437, 3274
- Wallerstein et al. (1965) Wallerstein, G., Herbig, G. H., & Conti, P. S. 1965, ApJ, 141, 610
- White & Basri (2003) White, R. J., & Basri, G. 2003, ApJ, 582, 1109
- Zapatero Osorio et al. (2002) Zapatero Osorio, M. R., Béjar, V. J. S., Pavlenko, Y. et al. 2002, A&A, 384, 937
- Zappala (1972) Zappala, R. R. 1972, ApJ, 172, 57

| Object | Field star name | (Fe I) (mÅ) | Adopted value (mÅ) |
|---|---|---|---|
| S1776 | HD 14802 (G1V) | 127 | |
| HD 20807 (G0V) | 102 | ||
| HD 211415 (G0V) | 105 | ||
| HD 216435 (G0V) | 168 | ||
| S2663 | HD 100623 (K0V) | 144 | 144 |
| S2715 | HD 10361 (K2V) | 200 | |
| HD 22049 (K2V) | 225 |
| ID | 11The photometric data from Sung et al. (2008). | 11The photometric data from Sung et al. (2008). | (Li)22Equivalent width of Li I 6708 doublet blended with adjacent neutral iron lines | (Li)cor33Deblended equivalent width of Li I 6708 doublet | A(Li) | (H)44Full width of 10% of peak H flux | 10% width | (He I) | ||
|---|---|---|---|---|---|---|---|---|---|---|
| (h:m:s) | () | (mag) | (mag) | (Å) | (Å) | (Å) | (km s-1) | (Å) | ||
| W1322 | 06:39:34.42 | +09:54:51.2 | 16.125 | 1.897 | 0.331 | 0.305 | 1.68 | -7.651 | 356.4 | -0.113 |
| W2690 | 06:39:59.25 | +09:27:24.6 | 16.238 | 1.624 | 0.464 | 0.441 | 2.79 | -4.453 | 530.6 | 0.122 |
| S550 | 06:40:05.65 | +09:35:49.1 | 11.250 | 0.705 | 0.160 | 0.152 | 3.17 | 0.063 | ||
| S643 | 06:40:09.59 | +09:41:43.5 | 13.417 | 0.940 | 0.246 | 0.232 | 2.85 | 0.058 | ||
| C17089 | 06:40:09.65 | +10:08:59.3 | 16.965 | 2.179 | 0.677 | 0.650 | 3.56 | -0.892 | 145.7 | 0.115 |
| S645 | 06:40:09.71 | +09:41:43.6 | 16.048 | 1.560 | 0.389 | 0.366 | 2.37 | 2.537 | 170.3 | 0.128 |
| S700 | 06:40:12.43 | +09:44:23.3 | 16.302 | 2.079 | 0.595 | 0.568 | 3.28 | 3.497 | 181.2 | 0.112 |
| W3407 | 06:40:12.58 | +10:05:40.6 | 15.496 | 1.740 | 0.580 | 0.556 | 3.29 | 0.579 | 217.2 | -0.014 |
| C19191 | 06:40:15.16 | +10:01:57.9 | 16.959 | 1.894 | 0.529 | 0.503 | 3.04 | 1.831 | 387.9 | |
| C21959 | 06:40:22.62 | +09:49:46.3 | 17.142 | 2.037 | 0.491 | 0.465 | 2.77 | 3.124 | 142.0 | 0.104 |
| S1039 | 06:40:23.08 | +09:27:42.3 | 17.382 | 2.005 | 0.439 | 0.413 | 2.44 | -14.627 | 564.7 | -0.225 |
| C22501 | 06:40:24.16 | +09:34:12.5 | 16.707 | 1.747 | 0.313 | 0.289 | 1.68 | -8.072 | 357.8 | -0.348 |
| S1163 | 06:40:25.47 | +09:48:26.0 | 15.663 | 1.432 | 0.505 | 0.484 | 3.07 | 2.321 | 202.4 | 0.163 |
| S1177 | 06:40:25.70 | +09:58:35.6 | 13.537 | 1.093 | 0.390 | 0.374 | 3.18 | 0.195 | ||
| S1329 | 06:40:28.59 | +09:35:47.5 | 16.062 | 1.964 | 0.592 | 0.566 | 3.29 | 1.193 | 178.4 | 0.131 |
| S1344 | 06:40:28.82 | +09:48:24.4 | 16.026 | 1.619 | 0.515 | 0.492 | 3.07 | 2.554 | 184.8 | 0.228 |
| C24554 | 06:40:29.77 | +09:42:21.4 | 17.050 | 1.972 | 0.503 | 0.477 | 2.87 | -5.798 | 526.6 | -0.132 |
| C25335 | 06:40:32.01 | +09:49:35.5 | 16.887 | 1.950 | 0.316 | 0.290 | 1.54 | -62.997 | 394.3 | -0.671 |
| W4425 | 06:40:35.11 | +10:04:21.8 | 15.167 | 1.813 | 0.499 | 0.474 | 2.91 | 2.646 | 212.2 | |
| S1729 | 06:40:36.62 | +09:48:22.8 | 15.763 | 1.614 | 0.532 | 0.509 | 3.14 | 4.264 | 180.3 | 0.193 |
| S1731 | 06:40:36.65 | +09:52:03.2 | 16.057 | 1.785 | 0.298 | 0.273 | 1.54 | -23.148 | 454.8 | -0.424 |
| C27301 | 06:40:37.46 | +09:55:21.2 | 16.304 | 1.683 | 0.557 | 0.533 | 3.22 | 5.061 | 124.7 | 0.178 |
| S1776 | 06:40:37.48 | +09:54:57.9 | 11.745 | 0.786 | 0.261 | 0.126 | 2.81 | |||
| S1943 | 06:40:41.02 | +09:47:57.5 | 15.950 | 1.717 | 0.527 | 0.503 | 3.09 | -14.621 | 408.0 | 0.115 |
| S1952 | 06:40:41.12 | +09:52:56.5 | 15.698 | 1.746 | 0.506 | 0.482 | 2.97 | -10.120 | 259.0 | -0.230 |
| S1990 | 06:40:41.78 | +09:49:52.1 | 16.290 | 1.837 | 0.562 | 0.537 | 3.20 | 3.101 | 243.3 | 0.130 |
| S2030 | 06:40:42.45 | +09:32:20.5 | 15.257 | 1.252 | 0.426 | 0.407 | 2.99 | 0.241 | ||
| C29037 | 06:40:42.62 | +09:53:47.6 | 16.235 | 1.637 | 0.493 | 0.470 | 2.95 | 0.202 | ||
| S2169 | 06:40:45.04 | +09:45:41.7 | 16.197 | 1.832 | 0.644 | 0.619 | 3.50 | 1.413 | 220.4 | 0.172 |
| C30470 | 06:40:46.95 | +09:48:48.1 | 16.536 | 1.718 | 0.489 | 0.465 | 2.89 | 4.817 | 129.3 | 0.136 |
| C30909 | 06:40:48.38 | +09:48:38.6 | 17.459 | 2.259 | 0.516 | 0.489 | 2.81 | -12.037 | 449.8 | -0.196 |
| C30991 | 06:40:48.62 | +09:32:52.4 | 16.879 | 1.920 | 0.464 | 0.438 | 2.65 | 2.333 | 181.4 | 0.243 |
| S2468 | 06:40:50.85 | +09:55:53.2 | 15.563 | 1.604 | 0.559 | 0.536 | 3.24 | 2.182 | 204.0 | 0.107 |
| S2481 | 06:40:51.18 | +09:44:46.0 | 12.004 | 0.715 | 0.119 | 0.110 | 2.94 | 0.151 | ||
| S2528 | 06:40:52.55 | +09:52:05.9 | 16.338 | 2.194 | 0.660 | 0.633 | 3.50 | 1.811 | 407.9 | |
| S2541 | 06:40:52.92 | +09:44:54.3 | 15.459 | 1.644 | 0.571 | 0.547 | 3.28 | -0.855 | 213.8 | 0.097 |
| S2568 | 06:40:53.77 | +09:30:39.1 | 11.633 | 0.626 | 0.136 | 0.129 | 3.30 | |||
| C32567 | 06:40:54.20 | +09:55:52.0 | 16.687 | 1.856 | 0.520 | 0.495 | 3.01 | 3.783 | 236.0 | 0.142 |
| C32585 | 06:40:54.26 | +09:49:20.4 | 16.580 | 2.082 | 0.432 | 0.405 | 2.34 | -45.754 | 405.1 | -0.285 |
| S2630 | 06:40:55.72 | +09:51:13.7 | 15.488 | 1.577 | 0.558 | 0.535 | 3.25 | 2.837 | 238.9 | 0.143 |
| C33005 | 06:40:55.91 | +09:53:53.3 | 16.585 | 1.916 | 0.607 | 0.581 | 3.35 | 4.735 | 162.2 | 0.123 |
| C33066 | 06:40:56.16 | +09:36:30.8 | 17.245 | 2.224 | 0.300 | 0.273 | 1.14 | -9.741 | 575.1 | 0.042 |
| S2663 | 06:40:56.50 | +09:54:10.4 | 12.383 | 0.993 | 0.532 | 0.373 | 3.40 | |||
| S2715 | 06:40:57.83 | +09:56:30.1 | 13.752 | 1.070 | 0.585 | 0.357 | 3.14 | |||
| C33749 | 06:40:58.82 | +09:39:18.7 | 17.101 | 2.076 | 0.599 | 0.572 | 3.29 | -5.458 | 295.8 | 0.063 |
| S2767 | 06:40:59.31 | +09:46:16.4 | 16.194 | 1.991 | 0.646 | 0.620 | 3.48 | -6.531 | 236.2 | -0.095 |
| S2784 | 06:40:59.74 | +09:54:06.1 | 15.942 | 1.728 | 0.497 | 0.473 | 2.93 | 4.228 | 241.4 | 0.162 |
| S2795 | 06:41:00.25 | +09:58:49.9 | 13.613 | 1.074 | 0.365 | 0.349 | 3.09 | |||
| C34298 | 06:41:01.12 | +09:34:52.3 | 16.735 | 1.907 | 0.553 | 0.527 | 3.15 | -3.217 | 300.1 | 0.076 |
| W5413 | 06:41:01.51 | +10:14:56.0 | 16.365 | 1.983 | 0.528 | 0.502 | 3.01 | -63.831 | 211.7 | |
| S2828 | 06:41:01.54 | +10:00:36.7 | 15.345 | 1.508 | 0.545 | 0.523 | 3.22 | 4.736 | 177.3 | 0.149 |
| S2890 | 06:41:03.49 | +09:31:18.6 | 12.735 | 0.806 | 0.207 | 0.196 | 3.08 | |||
| C34897 | 06:41:03.57 | +10:00:35.4 | 16.814 | 2.026 | 0.431 | 0.405 | 2.37 | 3.746 | 139.4 | 0.099 |
| S2912 | 06:41:04.07 | +09:35:21.2 | 16.670 | 2.235 | 0.465 | 0.438 | 2.48 | 1.195 | 289.5 | 0.056 |
| S2921 | 06:41:04.31 | +09:48:21.6 | 14.743 | 1.273 | 0.521 | 0.502 | 3.29 | 0.180 | ||
| S2924 | 06:41:04.41 | +09:51:50.0 | 12.464 | 1.030 | 0.384 | 0.369 | 3.27 | 0.137 | ||
| S2928 | 06:41:04.47 | +09:53:18.4 | 16.050 | 1.789 | 0.606 | 0.581 | 3.37 | 4.204 | 187.0 | 0.110 |
| S2949 | 06:41:05.10 | +09:51:44.5 | 15.486 | 1.566 | 0.585 | 0.562 | 3.34 | 1.102 | 151.4 | 0.203 |
| S2967 | 06:41:05.69 | +09:54:18.8 | 16.173 | 2.061 | 0.722 | 0.695 | 3.72 | 1.666 | 222.6 | |
| S2974 | 06:41:05.82 | +09:52:47.8 | 15.779 | 1.694 | 0.658 | 0.634 | 3.56 | 5.400 | 119.4 | 0.143 |
| S3018 | 06:41:07.27 | +09:58:31.4 | 15.158 | 1.536 | 0.607 | 0.585 | 3.42 | 2.747 | 211.6 | 0.123 |
| S3035 | 06:41:07.77 | +09:44:02.8 | 13.424 | 0.927 | 0.336 | 0.323 | 3.33 | 0.157 | ||
| S3039 | 06:41:08.03 | +09:30:40.7 | 15.630 | 1.419 | 0.476 | 0.455 | 2.93 | 0.685 | 348.1 | 0.218 |
| S3061 | 06:41:08.91 | +09:41:14.8 | 15.081 | 1.229 | 0.477 | 0.459 | 3.25 | 2.819 | 200.0 | 0.176 |
| C36368 | 06:41:10.71 | +09:57:42.6 | 17.091 | 2.140 | 0.599 | 0.572 | 3.28 | 0.404 | 130.6 | 0.111 |
| S3126 | 06:41:11.59 | +10:02:23.6 | 14.229 | 1.312 | 0.498 | 0.478 | 3.10 | 4.022 | 202.7 | 0.101 |
| S3149 | 06:41:12.59 | +09:52:31.3 | 13.577 | 1.183 | 0.458 | 0.440 | 3.28 | -5.182 | 453.5 | |
| C36877 | 06:41:13.31 | +09:51:54.4 | 17.490 | 2.124 | 0.792 | 0.765 | 3.93 | 5.021 | 129.2 | 0.158 |
| S3184 | 06:41:13.83 | +09:55:44.1 | 12.350 | 0.745 | 0.197 | 0.188 | 3.22 | 0.102 | ||
| S3221 | 06:41:15.70 | +09:38:18.2 | 13.035 | 0.674 | 0.102 | 0.094 | 2.97 | 0.109 | ||
| S3226 | 06:41:16.01 | +09:26:09.5 | 16.592 | 2.103 | 0.124 | 0.097 | -0.78 | -37.727 | 355.4 | -1.595 |
| S3267 | 06:41:17.72 | +09:29:26.6 | 15.820 | 2.261 | 0.706 | 0.679 | 3.66 | 1.154 | 305.8 | |
| S3282 | 06:41:18.28 | +09:33:53.6 | 14.926 | 1.402 | 0.540 | 0.519 | 3.22 | -9.609 | 283.3 | 0.046 |
| S3367 | 06:41:21.80 | +09:45:30.9 | 15.431 | 1.431 | 0.472 | 0.451 | 2.90 | 3.676 | 90.7 | 0.209 |
| S3404 | 06:41:23.05 | +09:27:26.6 | 12.594 | 0.869 | 0.269 | 0.257 | 3.16 | 0.081 | ||
| C39235 | 06:41:23.46 | +09:45:58.6 | 16.874 | 1.993 | 0.533 | 0.507 | 3.03 | 5.011 | 197.0 | 0.101 |
| S3634 | 06:41:28.77 | +09:38:38.8 | 13.958 | 1.101 | 0.378 | 0.362 | 3.10 | 0.161 | ||
| S3650 | 06:41:29.17 | +09:39:35.9 | 13.008 | 0.930 | 0.347 | 0.333 | 3.37 | 0.173 | ||
| S3734 | 06:41:31.62 | +09:48:32.8 | 14.631 | 1.348 | 0.550 | 0.530 | 3.27 | 2.333 | 138.8 | 0.148 |
| W6655 | 06:41:42.88 | +09:25:08.3 | 16.086 | 1.599 | 0.293 | 0.270 | 1.65 | -14.291 | 334.9 | -0.342 |
| S4400 | 06:41:46.44 | +09:43:07.0 | 15.947 | 1.561 | 0.579 | 0.556 | 3.32 | 3.283 | 195.4 | 0.166 |
| S4423 | 06:41:47.11 | +09:38:04.6 | 15.930 | 1.566 | 0.560 | 0.537 | 3.25 | 2.388 | 113.6 | 0.202 |
| S4442 | 06:41:47.80 | +09:34:09.5 | 14.522 | 1.464 | 0.541 | 0.519 | 3.20 | 3.963 | 212.8 | 0.162 |
| W6920 | 06:41:49.17 | +10:19:35.2 | 15.540 | 1.383 | 0.537 | 0.516 | 3.21 | -15.098 | 295.7 | -0.114 |
| W7105 | 06:41:53.16 | +09:50:47.5 | 15.482 | 1.437 | 0.528 | 0.507 | 3.16 | 3.832 | 268.7 | 0.169 |
| S5192 | 06:42:08.72 | +09:41:21.3 | 14.722 | 1.188 | 0.466 | 0.448 | 3.30 | -33.405 | 489.4 | 0.075 |
| 1 error (dex) | 11 is the underlying age spread of the most probable model cluster. (Myr) | Prob22Probabilities in percentile are from the Kolmogorov–Smirnov test. (%) | Evolutionary model33B and S represent the evolutionary models of Baraffe et al. (2015) and Siess et al. (2000) for pre-main sequence stars, respectively. |
|---|---|---|---|
| 0.05 | 6 | 4.0 | B |
| 6 | 2.5 | S | |
| 0.10 | 5 | 42.1 | B |
| 4 | 27.7 | S | |
| 0.15 | 4 | 66.1 | B |
| 4 | 73.4 | S | |
| 0.20 | 4 | 96.5 | B |
| 3 | 94.9 | S | |
| 0.30 | 1 | 51.5 | B |
| 1 | 38.2 | S |
| Object | MembershipaaMembership selection criteria. | [km s-1]bbHeliocentric radial velocity and duplicity information from Fűrész et al. (2006). | Remarks | ||||
|---|---|---|---|---|---|---|---|
| S2223 | 06:40:46.07 | +09:49:17.2 | 11.76 | 1.00 | X-ray emissionccChandra X-ray source catalogue from Sung et al. (2004). | 15.6 – 69.5 | Double lined binarybbHeliocentric radial velocity and duplicity information from Fűrész et al. (2006). |
| S3755 | 06:41:32.07 | +10:01:04.9 | 13.87 | 1.22 | X-ray emissionddXMM Newton X-ray source catalogue from Dahm et al. (2007) | Double lined binary | |
| W2320 | 06:39:51.90 | +10:12:39.4 | 14.91 | 1.18 | H emission candidateeeProbable H emission star from Sung et al. (2008). | Double peaked H emission line | |
| Interstellar absorption at 6614 Å |