Metamorphoses of electronic structure of FeSe-based superconductors
Abstract
The electronic structure of FeSe, the simplest iron based superconductor (Fe-SC), conceals a potential of dramatic increase of that realizes under pressure or in a single layer film. This is also the system where nematicity, the phenomenon of a keen current interest, is most easy to study since it is not accompanied by the antiferomagnetic transition like in all other Fe-SC’s. Here we overview recent experimental data on electronic structure of FeSe-based superconductors: isovalently doped crystals, intercalates, and single layer films, trying to clarify its topology and possible relation of this topology to superconductivity. We argue that the marked differences between the experimental and calculated band structures for all FeSe compounds can be described by a hoping selective renormalization model for a spin/orbital correlated state that may naturally explain both the evolution of the band structure with temperature and nematicity.
I Introduction
FeSe, the simplest iron based superconductor Hsu2008 ; Mizuguchi2010 , through a number of its incarnations reveal several puzzling features which could be key milestones to understanding the high temperature superconductivity. The superconducting transition temperature of FeSe in form of single crystal is dramatically increased from about 9 to 38 K under pressure Medvedev2009 and by means of intercalation Guo2010 . The combination of both intercalation and pressure results in re-emerging superconductivity at 48 Sun2012 . The single layer FeSe films on SrTiO3 (STO) substrate push the to about 65 K Wang2012 ; Liu2012 and may be even higher Ge2015 , opening a new frontier for superconductivity Bozovic2014 .
FeSe is also a system with intricate evolution of the electronic band structure with temperature. In the first place, it is a nematic transition that is associated with spontaneous breaking of the symmetry between the and directions in the Fe-plane, reducing group symmetry of the lattice from tetragonal to orthorhombic. It is called “nematic” and believed to be a result of intrinsic electronic instability because its effect on electronic properties is much larger than expected based on the structural distortion observed Tanatar2010 ; Chu2010 . Also, in all other iron based superconductors the nematic transition is closely followed by the the antiferomagnetic (AFM) one of the same orthorhombic symmetry Cruz2008 ; Huang2008 ; Paglione2010 that gives natural reason to believe in mutual relation of these two phases and that the nematic transition can be caused by spin-fluctuations FernandesNP2014 that, in turn, gives a solid support for the -pairing model Hirschfeld2011 .
FeSe is quite different from all other Fe-SC’s and is a sort of uncomfortable example for spin-fluctuation theories: (1) The nematic transition, which happens for FeSe crystals at about 90 K McQueen2009 , is not accompanied by the AFM at all. (2) The Fermi surface topology for some of FeSe incarnations, such as mentioned intercalates and single layer films, can hardly support the -pairing Nekrasov2016 ; Sadovskii2016 . Now more and more evidences coming in favor of charge induced nematicity in FeSe Massat2016 .
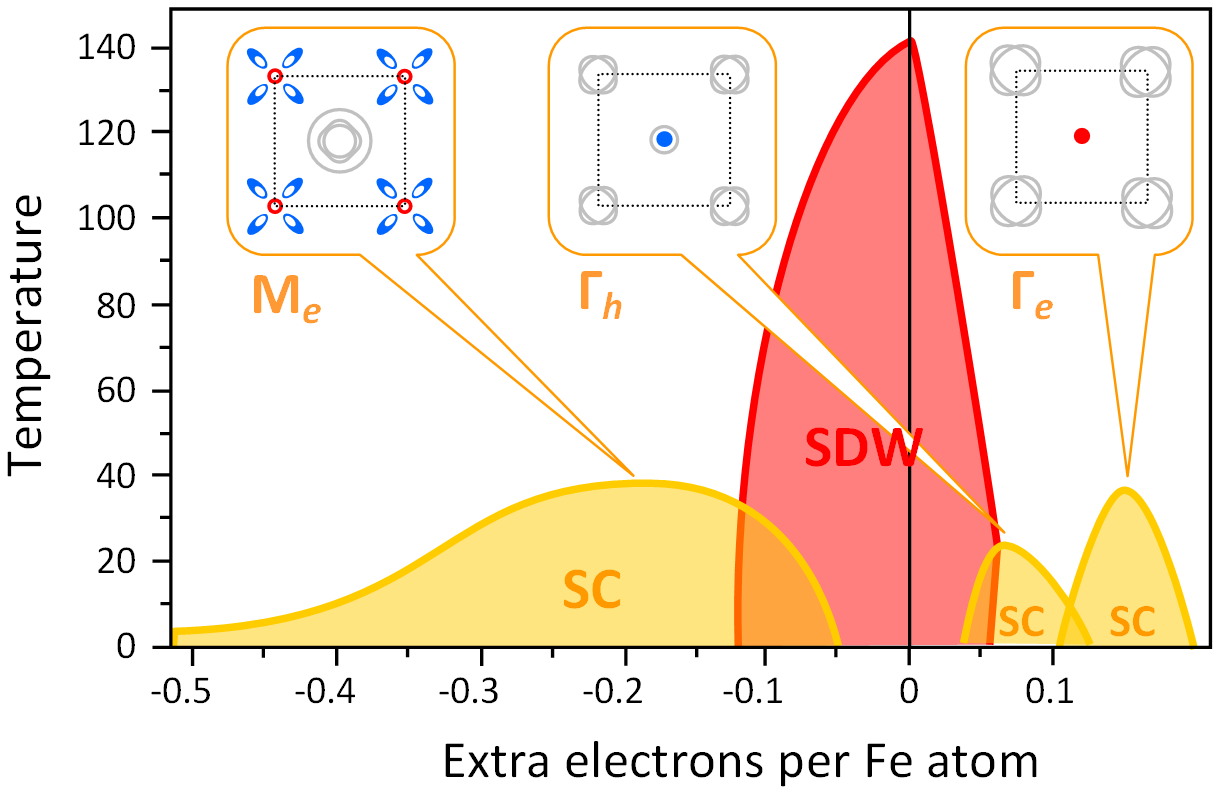
It is also interesting to see whether the FeSe compounds follow the general correlation that is maximal when a certain Van Hove singularity crosses the Fermi level Kordyuk2012 ; Kordyuk2013 . This correlation can be explained as a shape-resonance-enhanced superconductivity when the shape of the Fermi surface is critically close to the topological Lifshitz transition Bianconi2013 . In most cases, such Fermi surface criticality can be easily reveled by the angle resolved photoemission (ARPES) Kordyuk2014 , like for almost all the Fe-SC’s, as shown at a universal phase diagram in Fig. 1. In some other cases, like for the hole doped cuprates Kordyuk2015 , the Fermi surface criticality is hard to resolve in direct experiment. The later can be also the case for some of FeSe compounds.
In any case, the exact knowledge of the electronic structure of FeSe-based compounds should be important for understanding their intriguing physics. In this review we summarize the results on electronic band structure of different FeSe incarnations, comparing the results of band structure calculations to ARPES experiment, and examine its evolution with temperature, discussing its possible reasons and consequences.
The paper is organized as following. In the main Sec. II we consider three FeSe incarnations, starting from their phase diagrams (Fig. 2) and experimental manifestations of the phase transitions, mainly in transport measurements (Fig. 3). Then we show the examples of calculated and measured electronic band structure for: single crystals of FeSe (Fig. 4) and Fe(Se,Te) (Fig. 5) in Sec. II.1; intercalates (Fig. 6) in Sec. II.2, where we also discuss the orbital selective renormalization (Fig. 7); and one unite cell films (Fig. 8) in Sec. II.3. Finally, in Sec. II.4 we summarize the electronic band structure of those three families in Fig. 9 and Tables 1 and 2. Then we briefly discuss the issues of nematicity and evolution of the electronic structure with temperature above the nematic transition in Sec. III (Fig. 10).
II FeSe incarnations

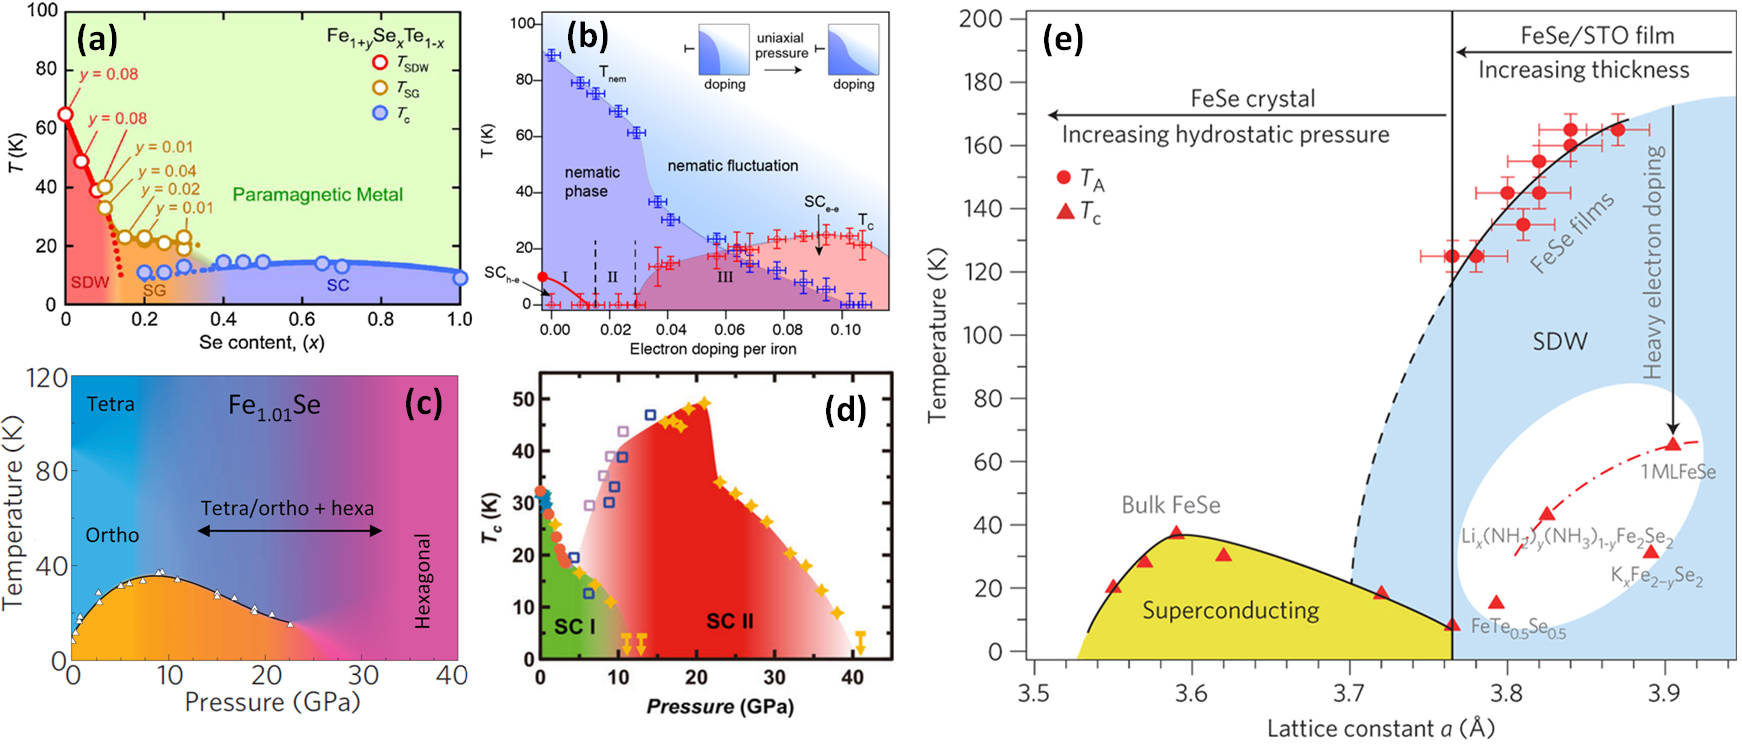
Phase diagrams. Some examples of the phase diagrams of different FeSe-based compounds are shown in Fig. 2. Evidently, pure FeSe crystal is not optimal for superconductivity since the transition temperature increases with isovalent doping (a) Katayama2010 ; Mizuguchi2010 ; Fedorchenko2011 , surface doping (b) Ye2015 , and pressure (c) Medvedev2009 ; Jung2015 . At the same time, the nematic phase is suppressed with doping and pressure and seems to be competing to superconductivity.
There are many possible selenium-tellurium-sulfur combinations to study the isovalent doping in Fe(Se,Te,S) Mizuguchi2010 . The most studied ternary system is FeSe1-xTex Katayama2010 , though its phase diagram is still not known for the whole doping range Mizuguchi2010 , although the quality of the crystals is constantly improving Chareev2013 . Except still missing regions, there is a region in between AFM and superconducting phases that has been considered as a weak superconductivity Deguchi2012 . The width of this region depends on sample treatment: from AFM to for as-grown samples, but decreases considerably after annealing in oxygen. The transition temperature is also slightly increasing with sulphur doping Fe(Se,S) AbdelHafiez2016 and emerges in Fe(Te,S) from non-superconducting FeTe and FeS Mizuguchi2010 , though it has been shown recently Lai2015 that the later starts to superconduct below 5 K.
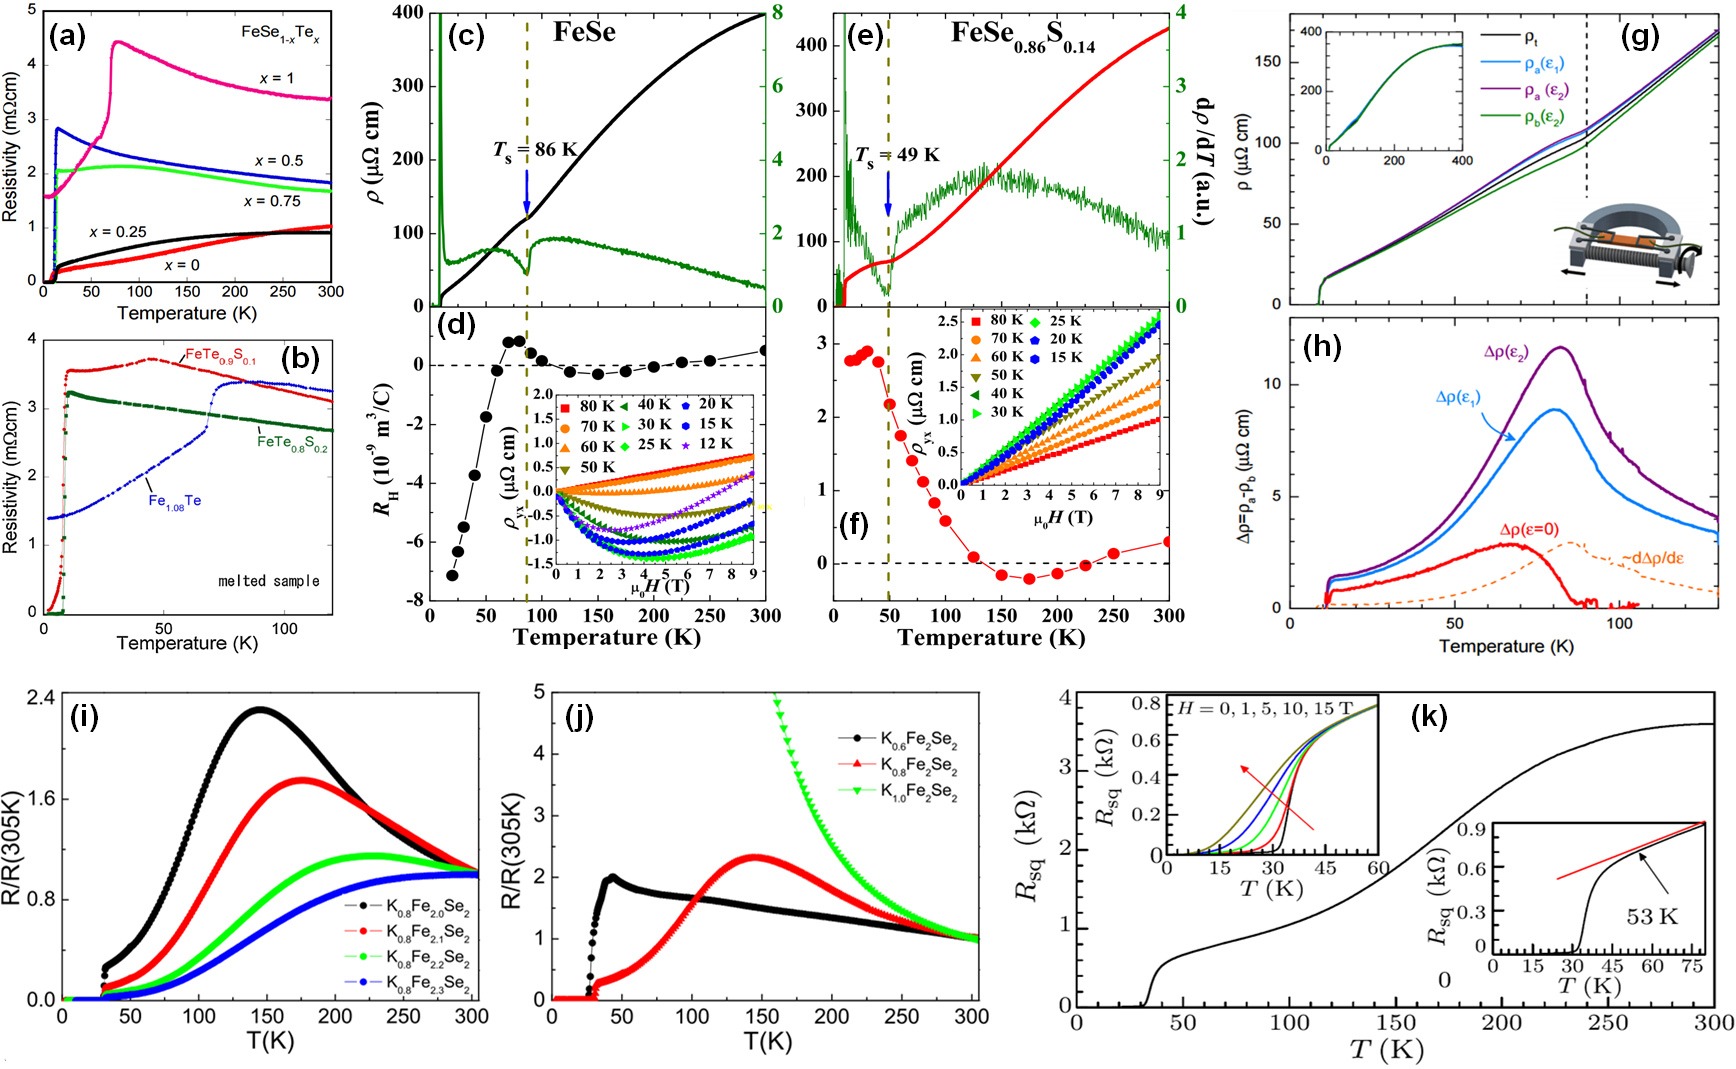
Phase transitions. The resistivity curves in isovalently-substituted FeSe1-xTex (a) and FeTe1-xSx Mizuguchi2010 , shown in Fig. 3 (a, b), demonstrate three types of phase transions: antiferromagnetic (AFM), , superconducting, , and structural, , also called “nematic”. The latter does not depend on magnetic field Roessler2015 and is well seen on resistivity (c, e) and Hall coefficient (d, f) for the pure FeSe (c, d) and FeSe0.86S0.14 (e, f) Sun2016 . The in-plane resistivity anisotropy in strain-detwinned single crystals of FeSe (g) and elastoresistivity measurements allow to extract the intrinsic resistivity anisotropy of strain-free samples (h) that peaks slightly below Tanatar2015 .
The superconducting gap values in FeSe differ essentially from one experiment to another. For example, the gaps determined from ARPES are equal to 1.5 and 1.2 meV in the center and corner of the Brillouin zone (BZ), respectively Borisenko2016 . The tunneling spectroscopy usually gives larger value of 2.2 meV Song2011 . In nonlinear conductivity of point contacts, two gaps with 2.5 and 3.5 meV were identified Naidyuk2016 . This discrepancy may result from inhomogeneity or complexity of the band structure: different probes can be more sensitive to different bands with different gap values, not to say affected by close vicinity of several van Hove singularities (VHs’s) to the Fermi level.
In contrast to superconducting ferro-pnictides, the layers of iron chalcogenides are neutral and kept together by weak van der Waals interaction. Therefore, intercalation by atoms and molecules is the most easy way to modify their structure (for recent review see Vivanco2016 ). The first intercalated FeSe compounds AxFe2-ySe2 (A = K, Rb, Cs) have shown up to 30K Guo2010 but it has not been straightforward to determine the structure of the superconducting phase Maletz2013 . From Fig. 3 (i, j) one can see that the normal state resistivity of intercalated KxFe2+ySe2 changes dramatically with both K (i) and Fe (j) slight variations WangDM2011 and it has been shown that the superconducting phase is sandwiched between two AFM insulating phases on the electronic phase diagram as a function of Fe valence Yan2011 .
The structures of the intercalates like K0.8Fe1.7Se2 or Tl0.6Rb0.4Fe1.67Se2 may be optimal for superconductivity since = 32 K seems to be maximal but starts to decrease with pressure Sun2012 . On the other hand, = 30 K does not look maximal for the structure of the ammoniated metal-doped iron selenide, (NH3)yCs0.4FeSe, since superconductivity starts to decrees rapidly with pressure Izumi2015 , see Fig. 2 (d). But in both cases, a superconducting phase with much higher up to 49 K appears at higher pressure: at 12 and 21 GPa, respectively Sun2012 ; Izumi2015 .
One unit-cell (1UC) thick FeSe films grown on a Se-etched SrTiO3 (STO) (001) substrate have shown the superconducting gap about 20 meV in tunneling spectra Wang2012 . Based on this value, it was concluded that could be about 80 K, assuming the same superconducting mechanism as for the bulk FeSe with . The resistivity of 1UC-thick film is tricky to measure and in Ref. Wang2012, only the resistivity of 5-UC-thick FeSe film, shown in Fig. 3 (k), has been presented. The superconducting transition happens above 30 K, and the authors could even say that it starts above 50 K. The later measurements however have shown that is really high and the todays record is slightly above 100 K by in situ four-point probe electrical transport measurements Ge2015 . There is also a number of ARPES data that show the superconducting gap closing above 60 K Liu2012 ; He2013 ; Tan2013 , but those ARPES results we will discuss in more details in the sections below.
A universal phase diagram for the superconducting and structural transitions vs. lattice constant for all mentined FeSe families Tan2013 is shown in Fig. 2 (e). Together with the two-dome phase diagrams of intercalates on pressure Sun2012 ; Izumi2015 , like shown in Fig. 2 (d), it may suggest either two different mechanisms of pairing or two different peculiarities of the electronic band structure responsible for superconductivity. The latter possibility we discuss below, but before should briefly address the issue of the spin ordering and its possible relation to nematicity.
Magnetic ordering. First, unlike the Fe-pnictides Chubukov2015 , the spin-driven nematic scenario for FeSe crystals has been considered as unlikely based on thermal-expansion Bohmer2013 and NMR data Baek2015 ; Bohmer2015 . Ab initio calculations indicated that FeSe is close to magnetic instability Grechnev2012 but no magnetic order has been observed in FeSe thus far McQueen2009 ; Roessler2016 , that could be explained by strong frustration of the magnetic fluctuations Glasbrenner2015 or by formation of a quantum paramagnet Wang2015 . Only spin fluctuations around the AFM wave vector were found in Fe(Te,Se) by inelastic neutron scattering Li2009 . Other neutron scattering experiments show that these spin fluctuations are coupled with orthorhombicity Rahn2015 ; Wang2016 . On the other hand, it has been suggested that the smallness of the Fermi energy in FeSe leads to a near-degeneracy between magnetic fluctuations and fluctuations in the charge-current density-wave channel Chubukov2015 : if , both a spin density wave (SDW) channel and a charge-current density-wave (iCDW) channel are comparable and strongly fluctuating at the nesting vector. One may conclude that in order to resolve the spin- vs orbital fluctuations dilemma, the exact knowledge of the electronic structure with its orbital origin is required Kordyuk2012 ; Evtushinsky2014PRB .
II.1 Single crystals
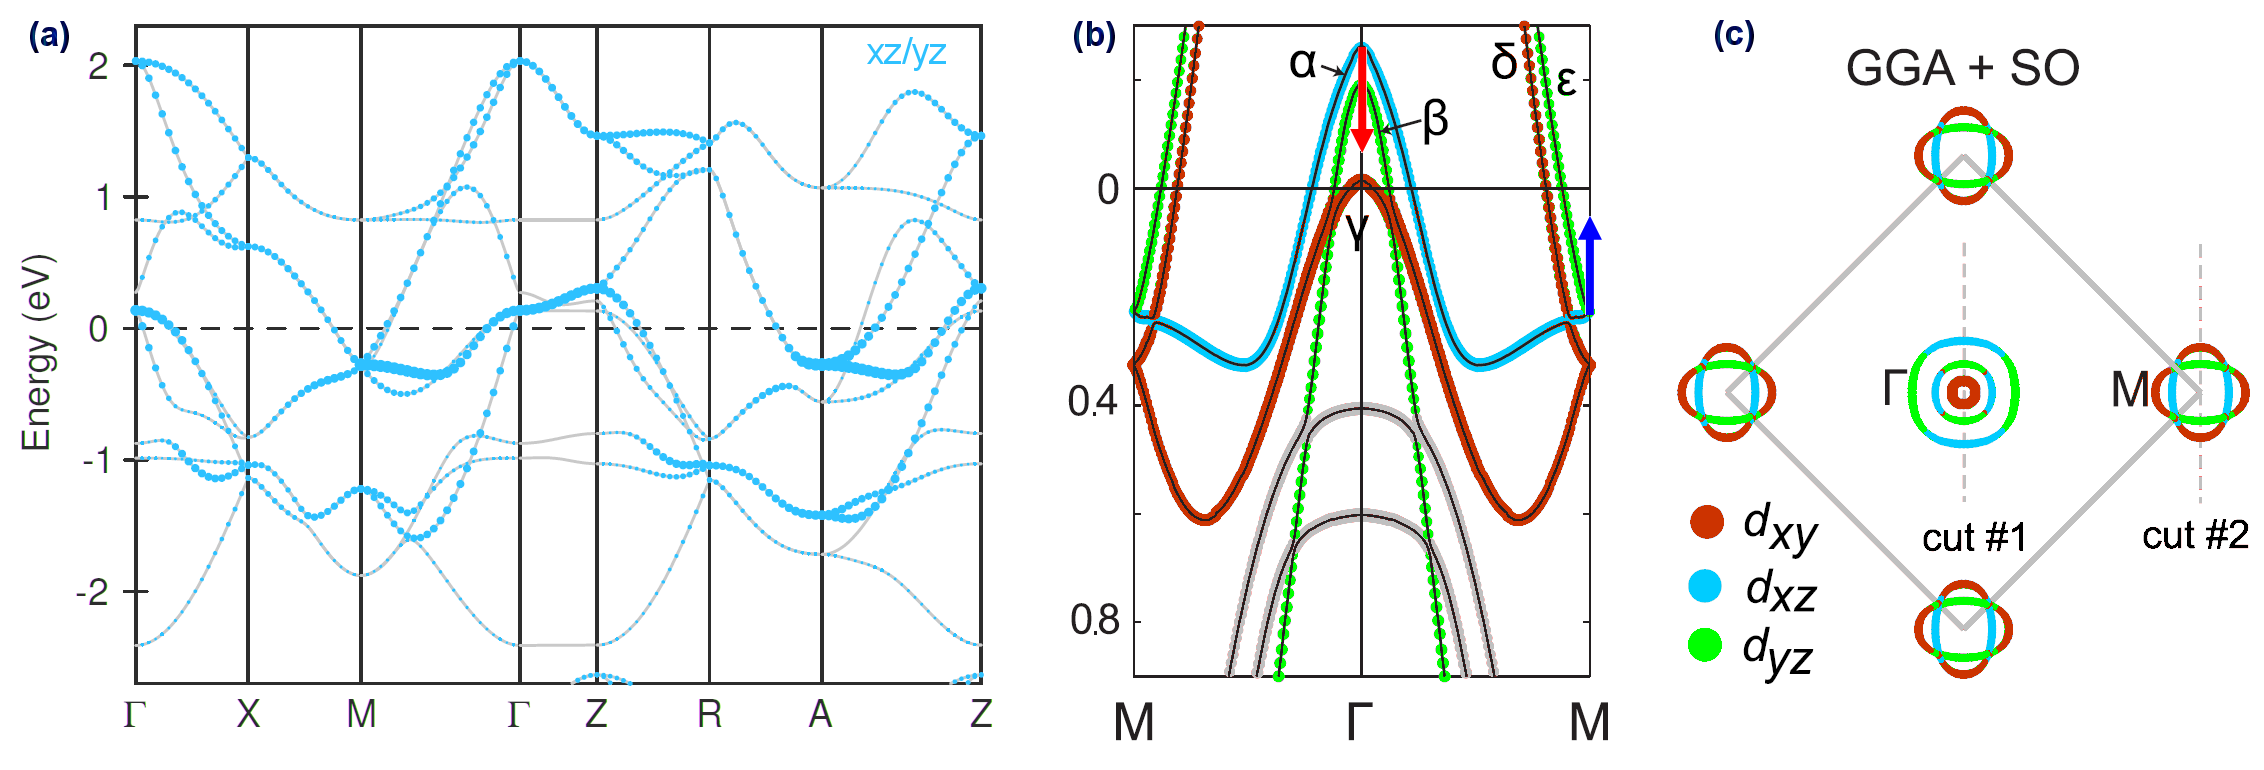
The electronic structures of FeSe single crystal, calculated Maletz2014 ; Watson2015 ; Fedorov2016 and measured by ARPES Watson2015 ; Watson2016 , are presented in Fig. 4. Like in all other Fe-SC’s, the metallic properties are defined by Fe bands and, in calculated band structure (see also Subedi2008 ; Aichhorn2010 ), there are five bands crossing the Fermi level that form five Fermi surface sheets: three around the center of the BZ (-point), and two around its corners (M-point). These bands are formed mainly by , , and orbitals, as shown on the upper panels. The most representative is the cut in the 2Fe BZ taken along M-direction. Along this direction the main orbital character for each band remains the same, if the spin-orbit coupling (SOC) is not taken into account: for band, for and bands, and for and bands. SOC results in hybridization (splitting 20 meV) between and bands in the BZ center and near their crossings with the -band, (b) Cvetkovic2013 ; Maletz2014 ; Borisenko2016 ; Watson2015 . There is also essential dispersion that mainly affects the and bands, as one can see in panel (a) Maletz2014 , where , Z = , M = , A = in 2Fe BZ. Note that in Z-point the splitting between and bands is present even without SOC since band there has essential admixture of Se orbital. Similarly, one can see strong dependence of and bands along M-A direction due to strong admixture of orbitals near M-point.
The band structure seen by ARPES differs from the calculated one in mostly the same way as for all other Fe-SC’s Kordyuk2012 ; Kordyuk2013 : by the overall band renormalization (presumably a result of coupling to electronic excitations, peaked at about 0.5 eV Evtushinsky2014 ) and by shifting of and M-band bunches in the opposite directions, as shown in Fig. 4 (b) by the red and blue arrows. Peculiar for FeSe is that the renormalization of the () band is about 5 Fanfarillo2016 (one of the moderate estimates, comparing to 9 Maletz2014 or 17 Tamai2010 , though the latter was given for ) that is essentially larger than for Ba-122 family Kordyuk2013 , for example. Also, the band sinks below the Fermi level at and usually is hardly visible for ARPES but it hybridizes with and bands (that is often the only way it can be detected). The band structure changes dramatically below 90 K, as one can see in Fig. 4 comparing panels (d, f) to (e, g) Watson2015 ; Watson2016 , but we will discuss it later, in Section III.
In the first column of Fig. 9 we summarize the calculated (top) and experimental (bottom) electronic band structure of FeSe single crystals. In the former, the blue and brown dotted lines show the effect of SOC, but here we will refer to the corresponding solid lines ( and ), to keep the same orbital origin along each band. The experimental bands were fitted to the spectra (mainly from Watson2015 ; Watson2016 ) at about 100 K, that is a bit above the nematic transition.
So, in reality, as a result of the “red-blue shift” shown in Fig. 4 (b), both the hole- and electron-like FS’s are essentially smaller than calculated. There is only one hole-like FS formed by the band. Its evident splitting in two ellipses is attributed to presence of two types of nematic domains Watson2015 ; Watson2016 . The band is 50 meV below at -point. The band is closer, at about -20 meV in and is almost touching the Fermi level in Z-point. Then, from FS topology point of view, FeSe has two VHs’s in close vicinity to : in -point and in M-point. An explanation why is not very high could be that the former band is still below and rather steep while the later is a result of nematicity that competes with superconductivity in some yet unclear way.
The electronic structure of Fe(Se,Te) differs from FeSe by position of band, that crosses the Fermi level forming the outer FS around the BZ center, and by position of band that forms small 3D FS Tamai2010 ; Chen2010 . The increase of hole FS area should be compensated by larger electron pockets, and rather large shallow pocket around M-point has been observed Tamai2010 . Fragments of experimental electronic structure of Fe1.04Te0.66Se0.34 are shown in Fig. 5 Chen2010 . So, in terms of empirical correlation between and proximity to Lifshitz transition of bands Kordyuk2012 , the electronic structure of Fe(Se,Te) should be more favorable for superconductivity. Alternatively, some enhancement of can be related with the suppressed nematicity.
II.2 Intercalates
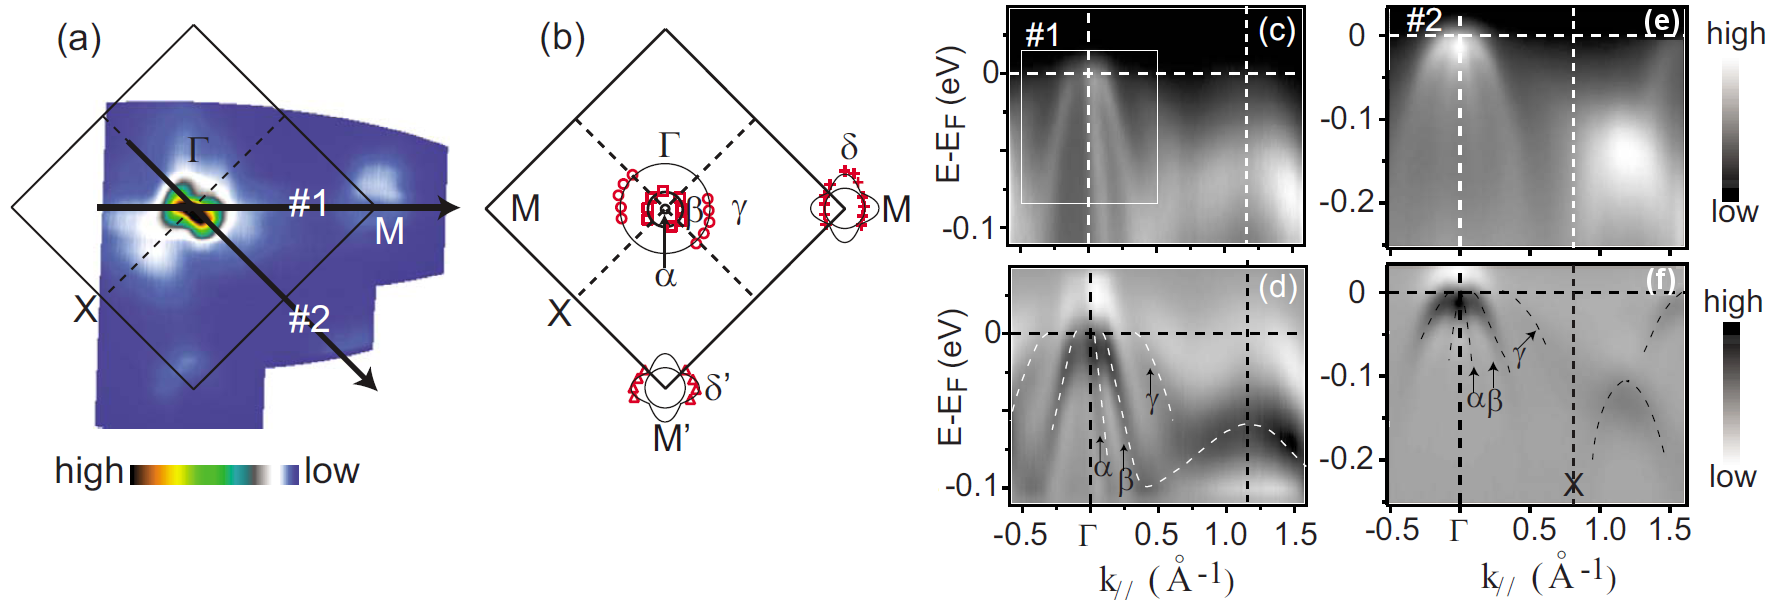
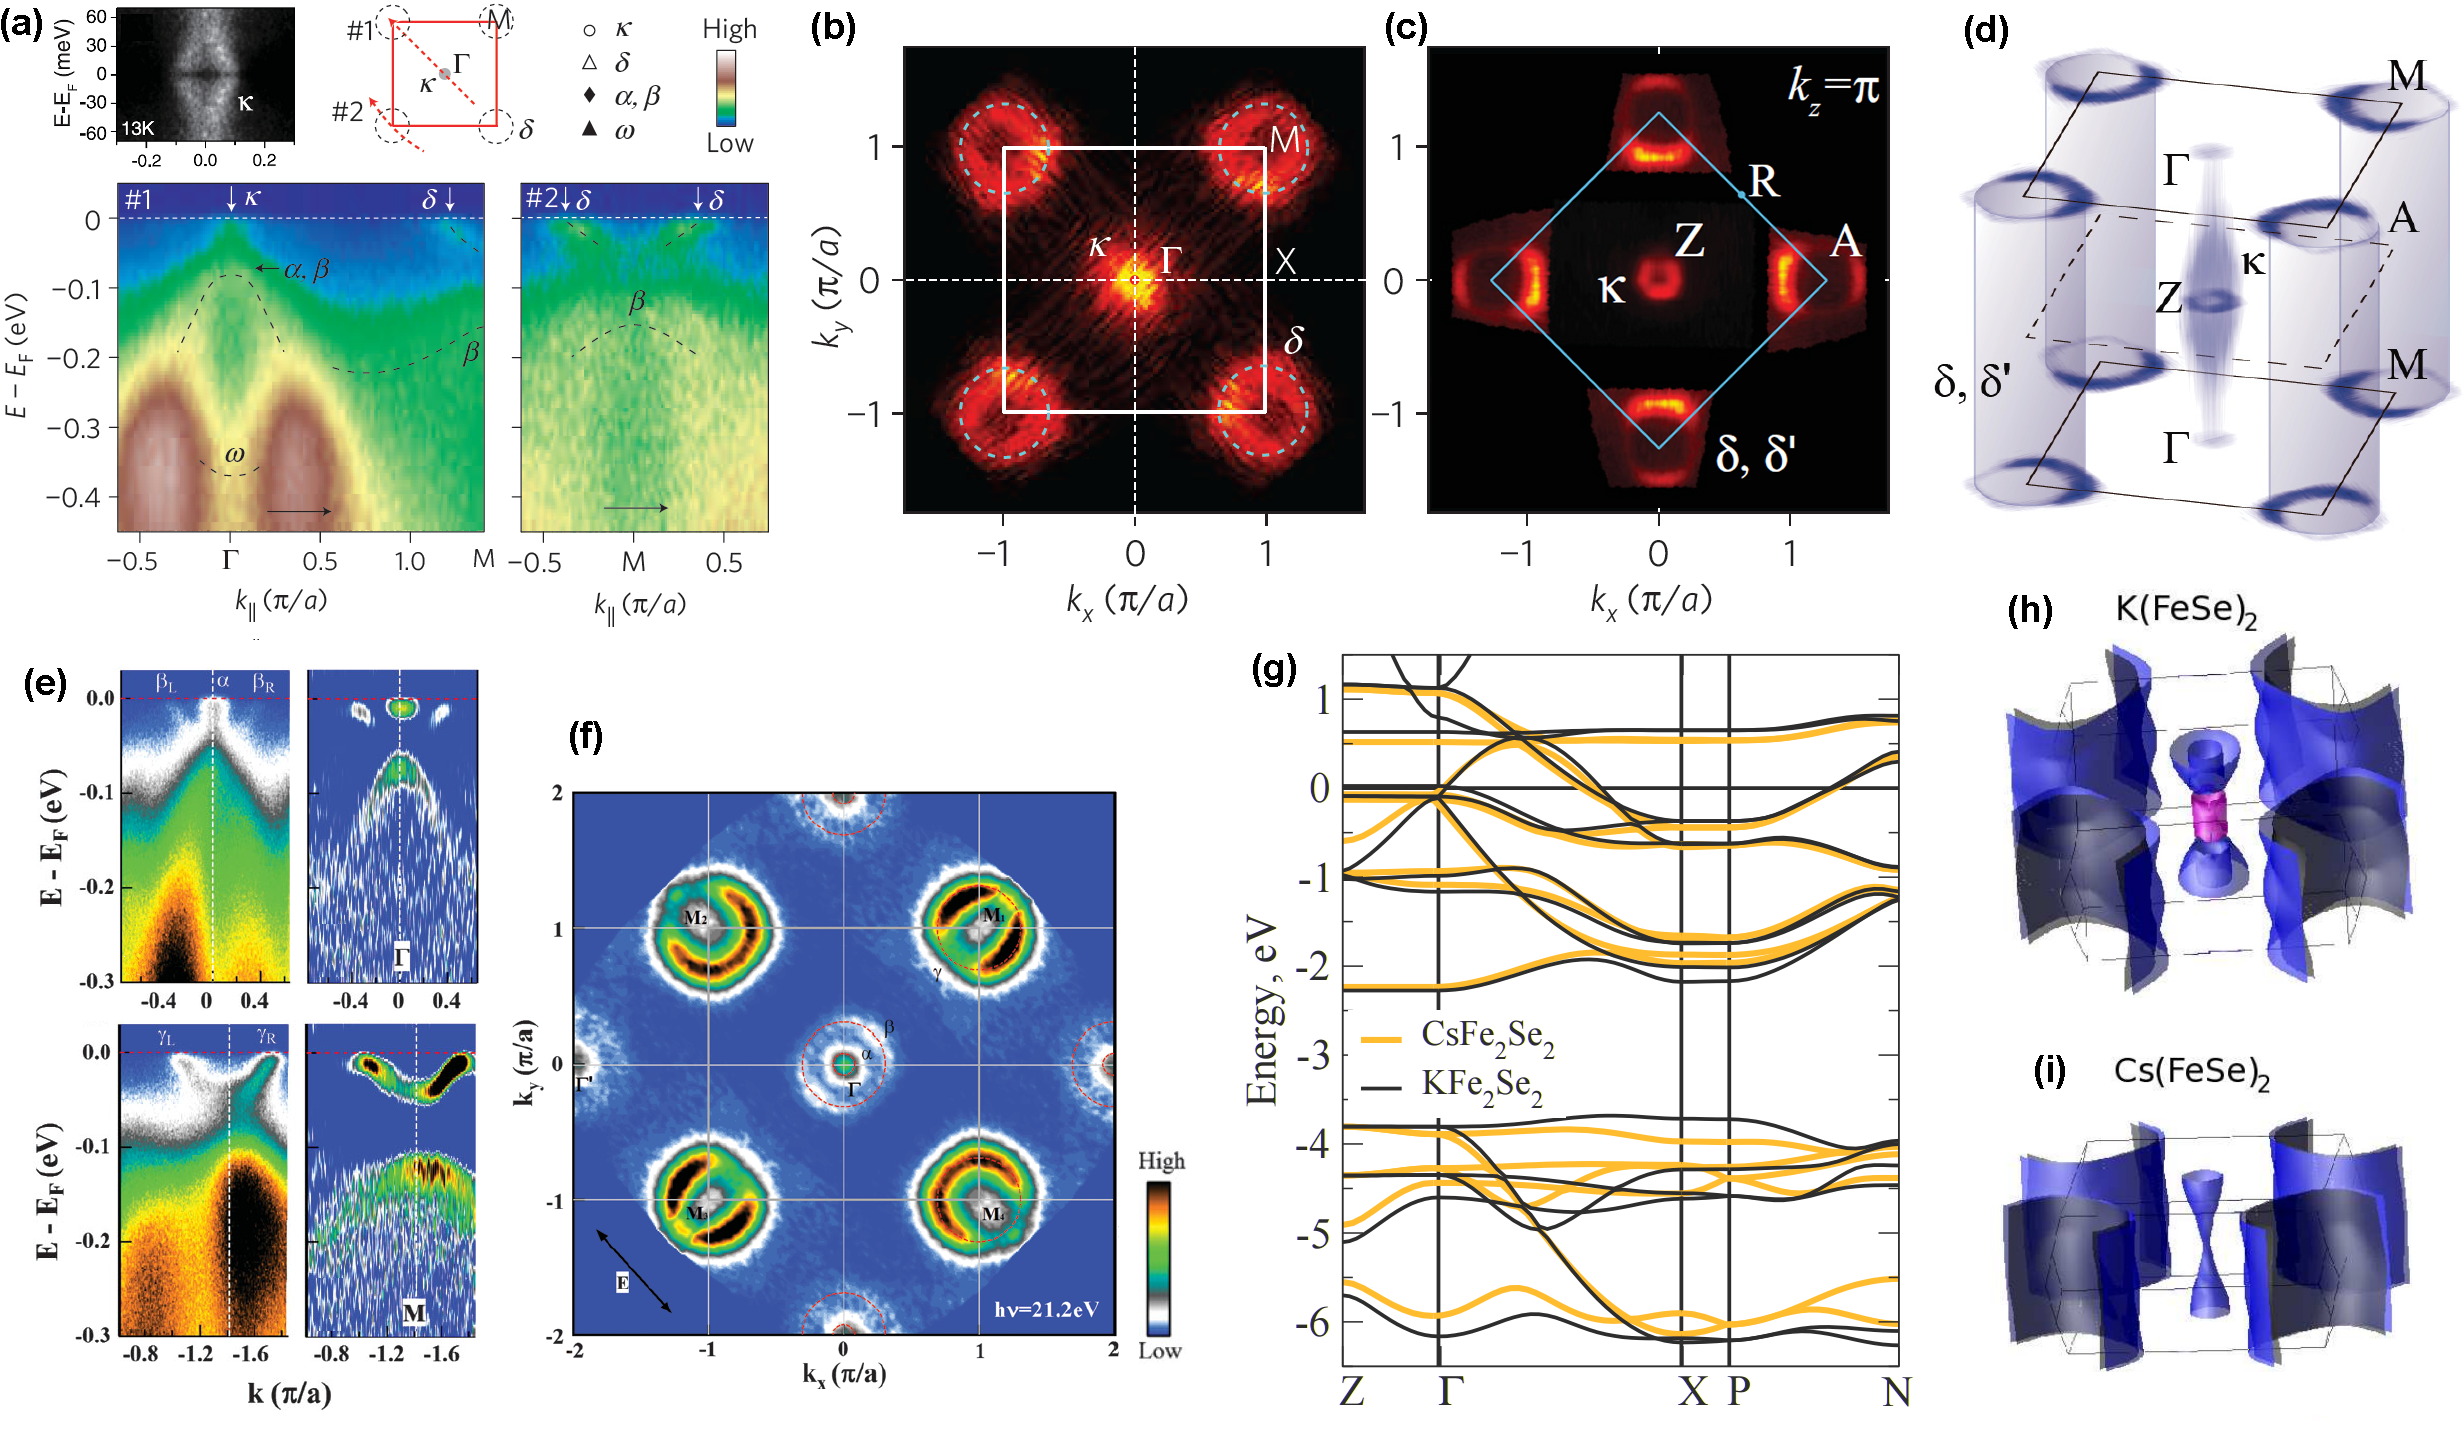
The intercalated FeSe superconductors are electron doped, so that only the electron-like FS’s remain, as one can see in Fig. 6. In LDA calculated electronic band structure of KFe2Se2 Nekrasov2011 the band only touches the Fermi level at -point. A short recent review of calculations of electronic band structure of FeSe-based superconductors, from intercalates to single layer films is given in Nekrasov2016 .
The calculated FS is generally supported by a number of published ARPES spectra measured for FeSe intercalated by alkali metals, in particular for AxFe2-ySe2 (A = K, Cs) Zhang2011 ; Qian2011 ; Xu2012 , ( = 32 K) Mou2011 , (Tl,K)Fe1.78Se2 Wang2011 , Rb0.77Fe1.61Se2 (32.6 K) Maletz2013 ; or by molecules: Lix(NH2)y(NH3)1-y (43 K) Burrard-Lucas2013 , Lix(C2H8N2)y (45 K) Hatakeda2013 , (Li0.8Fe0.2)OH (40 K) Pachmayr2015 ; Lu2015 ; Niu2015 . Evidently, such a FS is away from nesting conditions and its topology does not support the pairing scenario.
However, there are some differences between calculations and experiment. First, it is a small electron pocket that appears in BZ center: band in Fig. 6 (a-c). It makes a small 3D FS centered around Z-point, (d), and according to calculations, consists of Se and Fe orbitals. The pocket is clearly seen in ARPES spectra and accurately studied by many authors Zhang2011 ; Xu2012 ; Maletz2013 .
Second, a larger electron pocket is seen sometimes around -point Wang2011 ; Mou2011 but its origin is not clear. It is not present in LDA calculations and it looks identical to the large pocket around M-point, so, most probably, it is a replica of the pocket from M-point due to superstructure of Se distortions Zhao2012 ; Niu2015 . In the papers where only one small pocket is seen in ARPES spectra Zhang2011 ; Xu2012 , two superconducting gaps are found: the smaller one of 7-8 meV opens on this pocket, and the larger gap of about 10 meV opens on the pocket around M-point. The gap on the extra pocket around , if observed, is the same as on M-pocket Wang2011 or even higher Mou2011 , though it could be because the M-pocket consists of two and bands formed by and orbitals, respectively, see Fig. 9.
Even more complicated picture comes from recent ARPES paper Sunagawa2016 , where, in addition to two mentioned electron pockets, the hole pocket has been found around the BZ center. It is hardly visible but argued to have mainly origin (invisible part) and partially , i.e. to to be “real” band, according notations from Fig. 9. As for the band marked as in Fig. 9 (central column), as well as for the aforementioned large central electron pocket, they are supposed to be either from the surface or from another phase Sunagawa2016 .
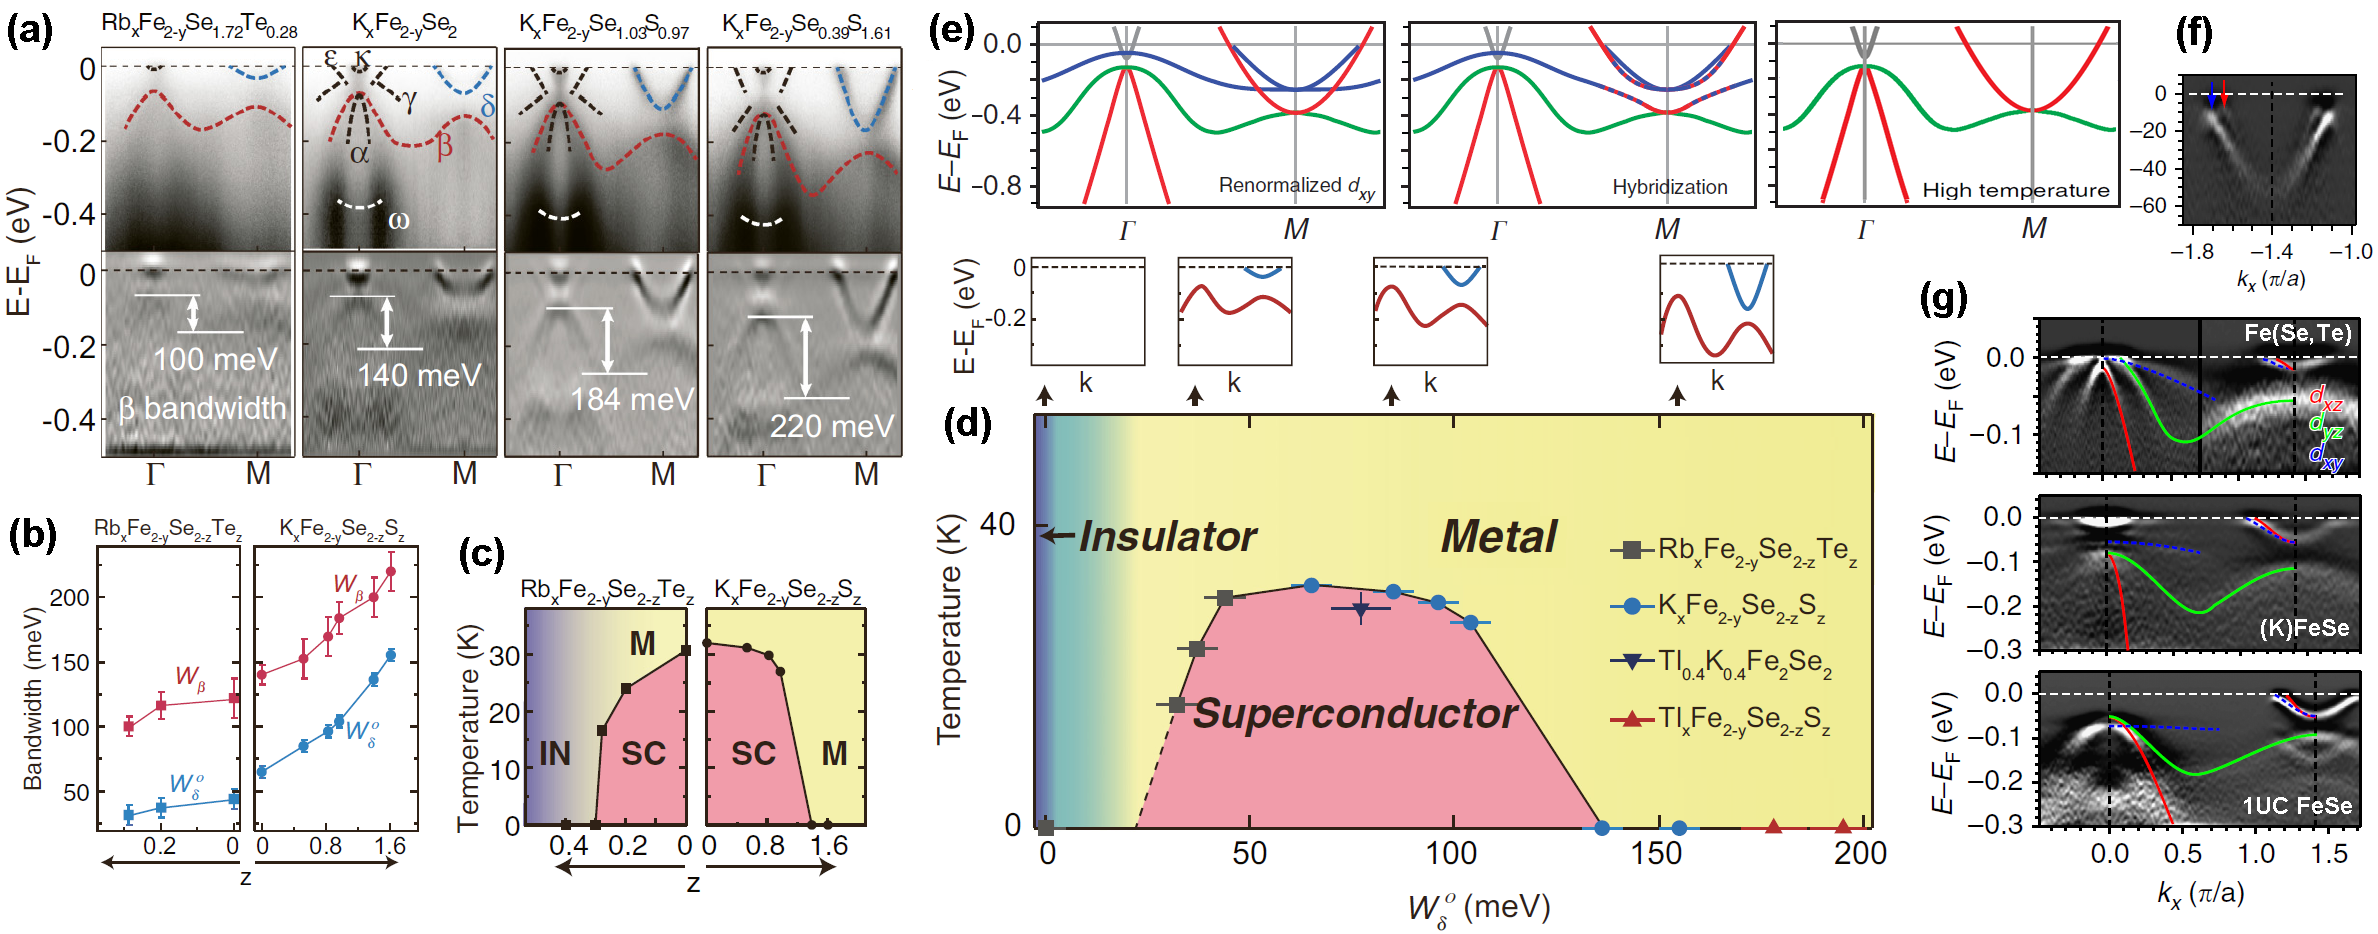
The results of LDA+DMFT Nekrasov2013 , being in general agreement with ARPES data, show that all the Fe bands crossing the Fermi level have equal renormalization. On the other hand, detailed study of the isovalently doped AxFe2-ySe(Te,S)2 Niu2016 shows that the bandwidths of the low energy bands depend on doping. Even when the Fermi surface in the metallic phases is unaffected by the isovalent dopants, the ground state evolves from a metal to a superconductor, and eventually to an insulator when the bandwidth decreases. It has been argued that the band renormalization is strong, orbital-dependent, and universal for all FeSe-based compounds Yi2015 , see Fig. 7.
Finally, one should note that in the intercalated compounds the intrinsic phase separation is often an issue and the studied crystals are just a mixture of metallic/superconducting and insulating/AFM phases Maletz2013 .
II.3 Single layers
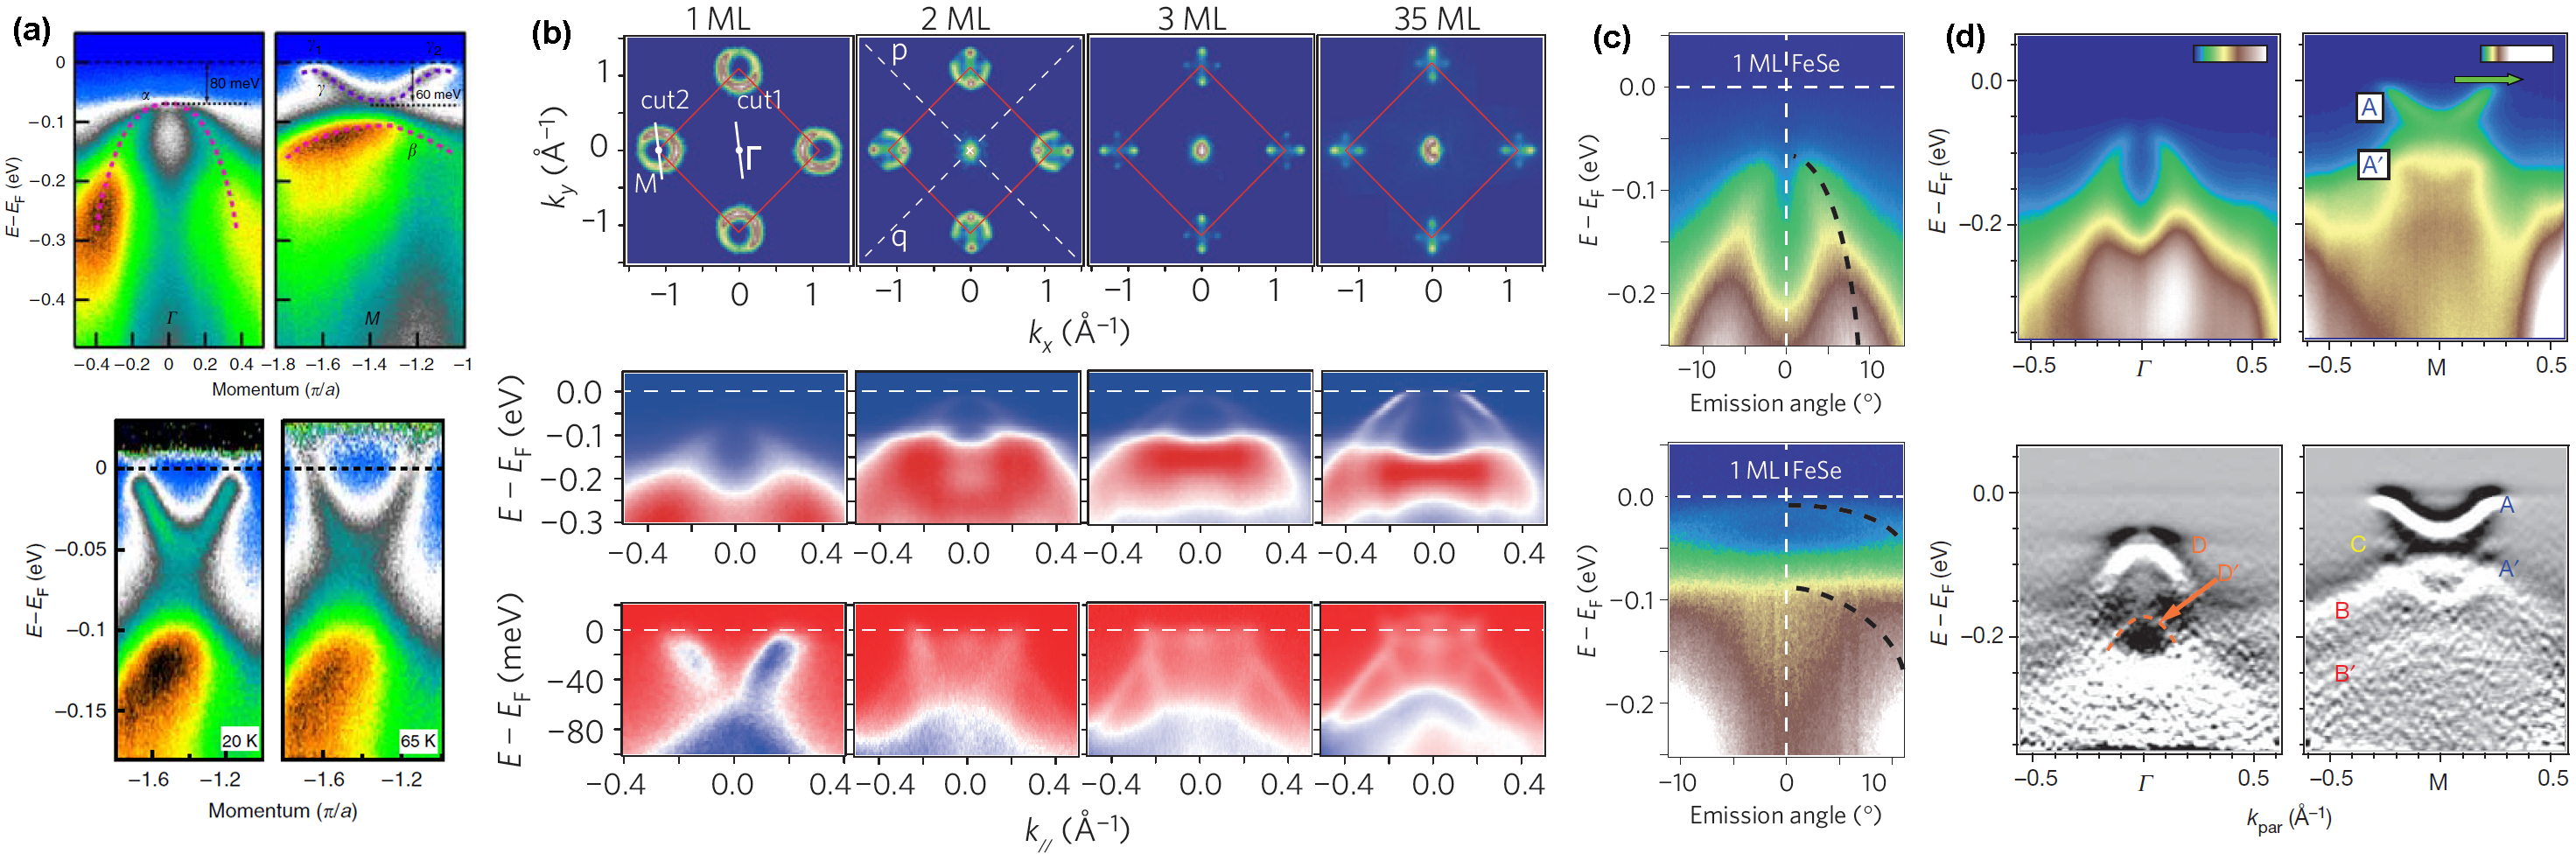
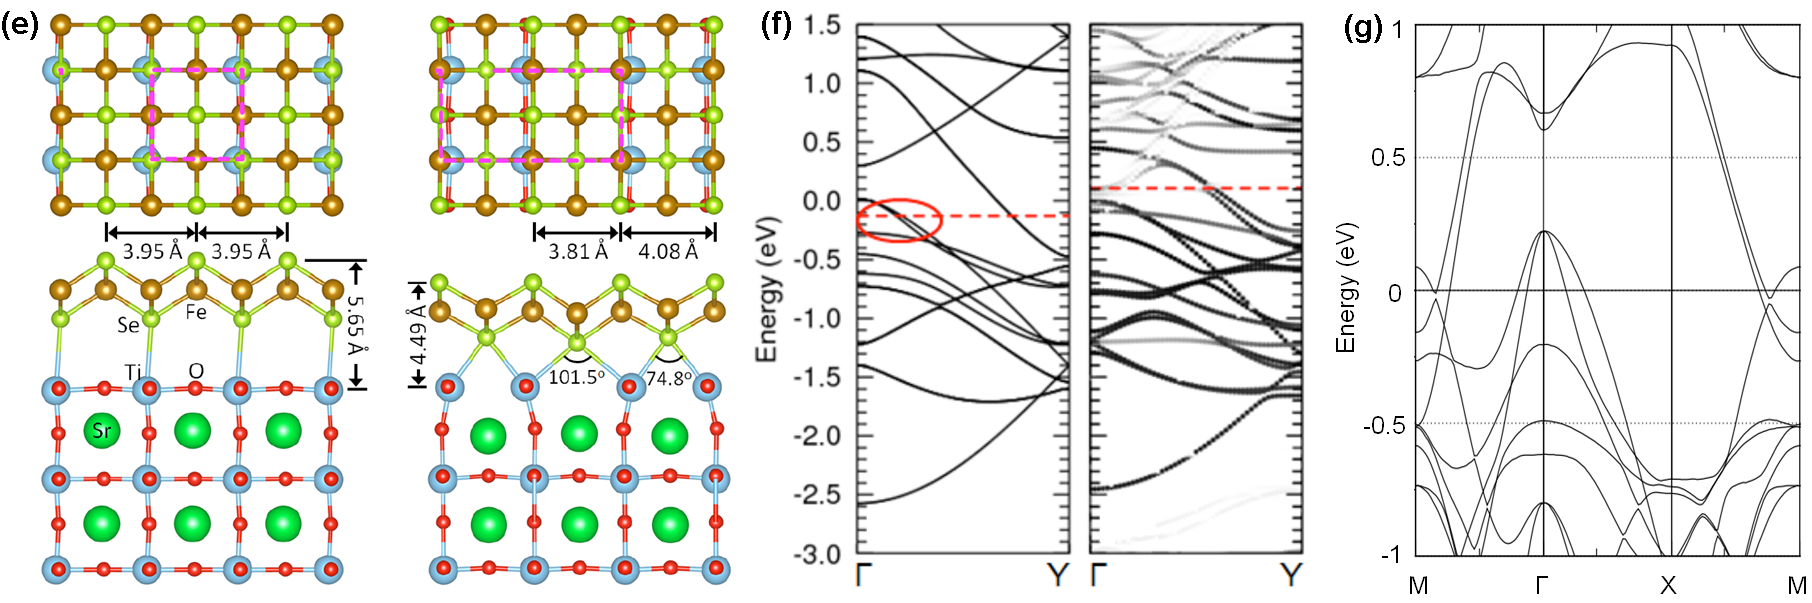
The ARPES spectra from the one unit cell (1UC) film on SrTiO3 (STO) substrate have been measured shortly after discovery of high superconductivity in such films Liu2012 ; He2013 ; Tan2013 . The electronic structure consists only of electron-like pockets near the zone corner without indication of any Fermi surface around the zone center, as shown in Fig. 8 (a,b) (1ML) Liu2012 . Panel (d, top) shows the high-symmetry cuts measured at 16 K along M direction and centered at (left) and M (right): the hole band is located 80 meV below .
Comparing the intercalates with respect to single crystals was natural to expect that their electronic band structure is (1) more two-dimensional, and (2) shifted below the Fermi level due to electron doping. One can see that the electronic structure of 1UC on STO is remarkably similar to that of intercalates, see Fig. 7 (g) or Fig. 9, and the superconducting transition temperature is even higher (above 65 K). Since it is the single layer, the band structure is 2D Nekrasov2016 , by definition, but the reason for electron doping is not quite clear, despite the fact that formation of the electron gas at the interface with the STO is a widely known phenomenon, studied for a long time Ohtomo2004 ; SantanderSyro2011 .
First, it was suggested Wang2012 that STO surface is terminated by a TiO2 layer, but, as shown by Bang2013 , O-deficient surface better explains the observed electron doped FS Liu2012 ; He2013 ; Tan2013 , as well as the (2x1) surface reconstruction seen by STM Wang2012 , see Fig. 8 (e). Indeed, the charge transfer from the STO substrate to the FeSe layer has been detected Bang2013 . This charging fills the hole pocket of the FeSe layer and provides strong Coulomb binding between the FeSe layer and the substrate. The key component of this doping is O vacancies on the STO top layer, which are ordered along the [100] direction and strongly anchor the FeSe layer to the substrate, giving rise to a (2x1) reconstruction Bang2013 . Though, there is recent observation Ding2016 of high- superconductivity in 1UC FeSe films on anatase TiO2(001), with various distinct interfacial properties from STO. If confirmed, this may doubt the interfacial oxygen vacancies as the primary source for charge transfer.
The doping may also be due to charge transfer from STO impurity bands driven by work function mismatch Zhou2016 . On the other hand, the oxygen vacancies at the interface between 1UC FeSe and STO can not only provide electron doping to the interface FeSe layer, but also significantly renormalize the width of the Fe 3 band near the Fermi level for the checkerboard antiferromagnetic state Chen2016 . The LDA calculations of 1UC FeSe on STO substrate Nekrasov2016 reveal the appearance of additional band of O surface states near the Fermi level with good nesting-like matching of the hole Fe band. Also, the 1UC-FeSe-on-STO calculations show rather small splitting of electron bands at M-point.
| Crystal | 560/0 | 550/20 | 470/0 |
|---|---|---|---|
| Intercalate | 600/0 | 300/35 | 300/35 |
| 1UC film | 420/0 | 530/20 | 530/0 |
Unlike the intercalates, all published ARPES spectra for 1UC FeSe show no traces of the electron pocket at the BZ center. This, however, cannot be considered as proof of its absence since all the data have been measured in-situ with helium discharge lamp, i.e. with only 21.2 eV photons Liu2012 ; He2013 . As a counterexample, a rare spectrum measured with 7 eV laser has been shown in Tan2013 , Fig. 8 (c, bottom).
The continuous ARPES measurements during the annealing process He2013 and multi-layer film growth Tan2013 did not result in understanding of gradual evolution of the band structure from bulk to 1UC. In former, two distinct phases have been found that compete during the annealing process: the electronic structure of the phase at low doping (N phase) bears a clear resemblance to the antiferromagnetic parent compound of the Fe-based superconductors, whereas the superconducting phase (S phase) emerges with increase of doping and with suppression of the N phase He2013 . The properties of the 2UC and 1UC films are already very different. In the 2UC film the electronic structure of the interfacial FeSe layer is not affected by the surface FeSe layer, which means that the interlayer coupling and charge transfer are very weak between them Tan2013 .
Another unusual feature in ARPES spectra on 1UC on STO is the replica bands shifted at about 100 meV below the main bands. On right panel of Fig. 8 (d, top) a different color scale highlights two important features: the electron band with a minimum at 60 meV below (labeled A), and a replica electron band (labeled A’). Panel (d, bottom) shows second derivatives in energy of the high-symmetry cuts from top row. An additional weaker replica, labeled C, can now be seen at M (right), sitting below A. At the -point (left) one can see the hole band and a corresponding replica, labeled D and D’, respectively Lee2014 . It has been suggested that these “shake-off” bands appear due to presence of bosonic modes, most probably oxygen optical phonons in SrTiO3 Lee2014 . Such phonons can significantly enhance the energy scale of Cooper pairing and even change the pairing symmetry Xiang2012 . These “shake-off” bands are shown as the dotted bands on the right bottom panel of Fig. 9.
Recently, similar enhancement of superconductivity related with similar electronic structure has been found in the topmost layer in potassium-coated FeSe single crystal Ye2015 : the superconductivity emerges when the inter-pocket scattering between two electron pockets is turned on by a Lifshitz transition of Fermi surface, suggesting an underlying correlation among superconductivity, inter-pocket scattering, and nematic fluctuation in electron-doped FeSe superconductors. The results of this surface doping also confirm recent observation of the two-dome phase diagram of K-doped ultra-thin FeSe films Song2016 ; Miyata2015 .
II.4 Electronic band structure summary
| Bands | ||||||||||||
|---|---|---|---|---|---|---|---|---|---|---|---|---|
| Calculations | ||||||||||||
| FeSe LDA Maletz2014 ; Fedorov2016 | 0.22 | -3 | -1.3 | - | - | 0.17 | -12 | -0.3 | 0.11 | -2.1 | -1.8 | |
| FeSe M LDA Maletz2014 ; Fedorov2016 | -0.3 | -0.35 | -11 | -0.46 | 8.5 | 0.5 | -0.295 | 4.3 | 0.9 | -0.46 | -3.10 | -1.2 |
| 1UC LDA Nekrasov2016 | 0.265 | -4.9 | -0.8 | 0.265 | -8.4 | -0.5 | -0.02 | -2.20 | -1.7 | |||
| 1UC LDA M Nekrasov2016 | -0.27 | -0.5 | -7.6 | -0.45 | 6.5 | 0.6 | -0.275 | 5.5 | 0.7 | -0.45 | -5.50 | -0.7 |
| 1UC DMFT Nekrasov2016 | -0.03 | -6.8 | -0.6 | -0.03 | -6.8 | -0.6 | -0.43 | -0.80 | -4.8 | |||
| 1UC DMFT M Nekrasov2016 | -0.42 | -0.3 | -13 | -0.65 | 5.2 | 0.7 | -0.42 | 3 | 1.3 | -0.64 | -1.60 | -2.4 |
| ARPES | ||||||||||||
| FeSe 10K Watson2015 | 0.004 | -0.93 | -4.1 | 0 | -2.5 | -1.5 | -0.05 | -5 | -0.8 | -0.05 | -0.25 | -15 |
| FeSe Z 10K Watson2015 | 0.028 | -1.3 | -2.9 | 0.009 | -1 | -3.8 | -0.001 | -3 | -1.3 | -0.05 | -0.25 | -15 |
| FeSe Z 120K Watson2015 | 0.02 | -1.3 | -2.9 | - | - | - | -0.001 | -3 | -1.3 | -0.035 | -0.3 | -13 |
| FeSe M 37eV 10K Watson2016 | -0.002 | -0.475 | -8.0 | -0.052 | 2.1 | 1.8 | -0.008 | 4.8 | 0.8 | -0.05 | 2.10 | 1.8 |
| FeSe M 37eV 96K Watson2016 | -0.01 | -0.475 | -8.0 | -0.05 | 2.3 | 1.7 | -0.018 | 4 | 1.0 | -0.04 | -0.84 | -4.5 |
| Mou2011 | -0.07 | -0.9 | -4.2 | -0.01 | 0.9 | 4.2 | -0.07 | -0.9 | -4.2 | |||
| M Mou2011 | -0.12 | -0.3 | -13 | -0.045 | 0.52 | 7.3 | ||||||
| K0.8Fe2Se2 Zhang2011 | -0.081 | -2.3 | -1.7 | |||||||||
| K0.76Fe1.72Se2 Yi2015 | -0.055 | -0.08 | -48 | |||||||||
| K0.8Fe2Se2 Z 31eV Zhang2011 | -0.018 | 1.5 | 2.5 | |||||||||
| KxFe2-ySe2 Z 31eV 13K Xu2012 | -0.03 | 6 | 0.6 | |||||||||
| K0.8Fe2Se2 M Zhang2011 | -0.156 | -0.63 | -6.0 | -0.05 | 0.5 | 7.6 | ||||||
| K0.8Fe2Se2 M 26eV Zhang2011 | -0.05 | 1.1 | 3.5 | |||||||||
| RbxFe2-ySe2-zTez Niu2015 | -0.08 | -0.8 | -4.7 | -0.008 | 2 | 1.9 | ||||||
| RbxFe2-ySe2-zTez M Niu2015 | -0.12 | -0.25 | -15 | -0.047 | 0.52 | 7.3 | ||||||
| (Li0.8Fe0.2)OHFe2Se2 Niu2015 | -0.075 | -0.75 | -5.1 | |||||||||
| (Li0.8Fe0.2)OHFe2Se2 M Niu2015 | -0.11 | -0.25 | -15 | -0.043 | 0.58 | 6.6 | ||||||
| 1UC Liu2012 | -0.07 | -1.65 | -2.3 | |||||||||
| 1UC He2013 | -0.067 | -1.45 | -2.6 | |||||||||
| 1UC Yi2015 | -0.065 | -0.2 | -19 | |||||||||
| 1UC M Liu2012 | -0.11 | -0.6 | -6.4 | -0.05 | 1.1 | 3.5 | ||||||
| 1UC M He2013 | -0.113 | -0.3 | -13 | -0.05 | 0.9 | 4.2 | ||||||
| 50ML Tan2013 | 0.02 | -1.2 | -3.2 | -0.016 | -2.1 | -1.8 | ||||||
| 50ML M 30K Tan2013 | -0.01 | -0.4 | -9.5 | -0.065 | 1.5 | 2.5 | -0.012 | 1.5 | 2.5 | -0.065 | -0.3 | -13 |
| 50ML M 115K Tan2013 | -0.012 | -0.38 | -10 | -0.049 | 1.5 | 2.5 | -0.015 | 3.4 | 1.1 | -0.049 | -0.3 | -13 |
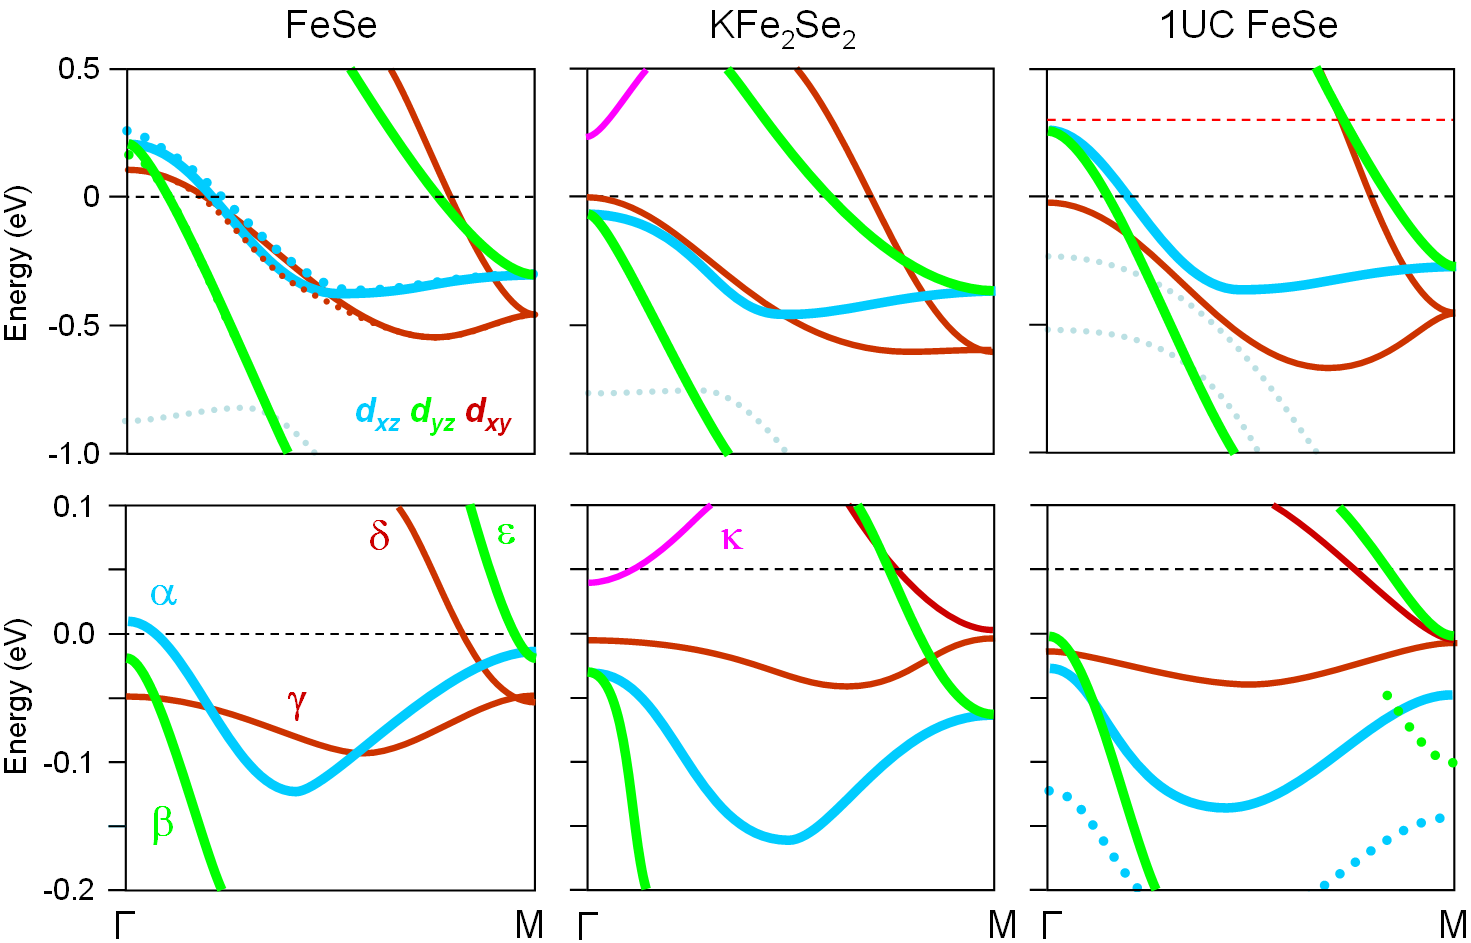
Fig. 9 summarizes the electronic band structure of FeSe-based compounds derived from LDA calculations (top row) and from ARPES experiments (bottom row). We tried to draw these dispersions to represent as many data as possible. Nevertheless, one can say that the most representative data sets to which we fit the dispersions on the first step, where taken from the following references: FeSe LDA Fedorov2016 ; Maletz2014 ; Watson2015 and FeSe ARPES Watson2015 ; Watson2016 , KFe2Se2 LDA Nekrasov2011 and KFe2Se2 ARPES Xu2012 ; He2013 ; Yi2015 ; Sunagawa2016 , 1UC FeSe LDA Nekrasov2016 and 1UC FeSe ARPES Yi2015 . Since we wanted to keep it clear and simple, we did not find reasonable way to show error bars here, and one need to compare it with the original spectrum to feel the level of uncertainty for each band. Still we can say that the most uncertain are the experimental bands near M-point for KFe2Se2 and 1UC, and band for KFe2Se2. The difference in meV in electronic band energies in 2Fe BZ center and corner, , for Fe , , and bands derived from LDA/ARPES, are given in Table 1 with accuracy not better than 5 meV.
One can see that in experiment, comparing to calculations, decreases essentially for each of the bands but to zero for band. From Fig. 9 one can see that in terms of electron hopping, the and bands along the M direction can be well approximated by two nearest neighbors,
where is the Fe-Fe distance, , and are the hopping integrals. Within this oversimplified approximation, would mean that the hopping between the nearest neighbors is blocked completely. Naturally, the peculiar for Fe-SC’s spin or orbital orderings, even in form of spin/orbital-fluctuations, should suppress the near-neighbor hopping, but in order to understand its complete suppression, more sophisticated model should be elaborated.
As for proximity to Lifshitz transitions, only FeSe, and to a greater extent Fe(Se,Te), may belong to -class of Fe-SC’s, similarly to LiFeAs and Ba(Fe,Co)2As2, where superconductivity could be enhanced by a shape resonance Bianconi2013 on small 3D FS formed by the inner hole () band. One may speculate that similar enhancement one can get on band in intercalates and on some yet hidden bands in 1UC films, but this issue certainly requires further investigation.
In Table 2 we give the parameters of different bands obtained by fitting the experimental dispersions around , Z, or M-points with parabolic dispersions : (eV), curvature (eVÅ2), and associated mass (electron mass). In the first column together with the name of the compound we show also the type of the data (LDA, DMFT, or ARPES), and, in case of ARPES, the photon energy and temperature of the sample. The values of were used to evaluate the proximity of certain bands to Lifshitz transition, but does it make any sense to discuss the band curvature or the mass ? These values are often used to evaluate renormalization: . Since all the bands in Fe-SC’s are not only squeezed in energy but also deformed by the “red-blue shift”, as shown schematically in Fig. 4 (b), one needs to either include such a shift in renormalization or take it into account as external effect. The former could be described as a hopping selective renormalization, meaning that electronic interaction differently affects different hopping integrals. In the case of the two nearest neighbor hopping model, the band associated masses in and M points would be different: , . It is indeed the case for FeSe, as one can see from Table 2. For example, for FeSe single crystals at 10 K for band in but -1.5 in M-point at 10 K and about 4 at 96 K. So, one may conclude that evaluation of the renormalization from experiment only makes sense if accompanied by a model of interaction.
III Nematicity and temperature evolution
Nematicity. To address the nematicity issue we should go back to single crystals. Fig. 3 contains a number of examples how the nematic transition is seen in electro-transport measurements. In diffraction experiments this transition appears as spontaneous breaking of the symmetry between the and directions in the Fe-plane but it has been said that its effect on electronic properties is much larger than expected based on the structural distortion observed Tanatar2010 ; Chu2010 . This was the main argument to relate this structural transition with intrinsic electronic instability and call “nematic”.
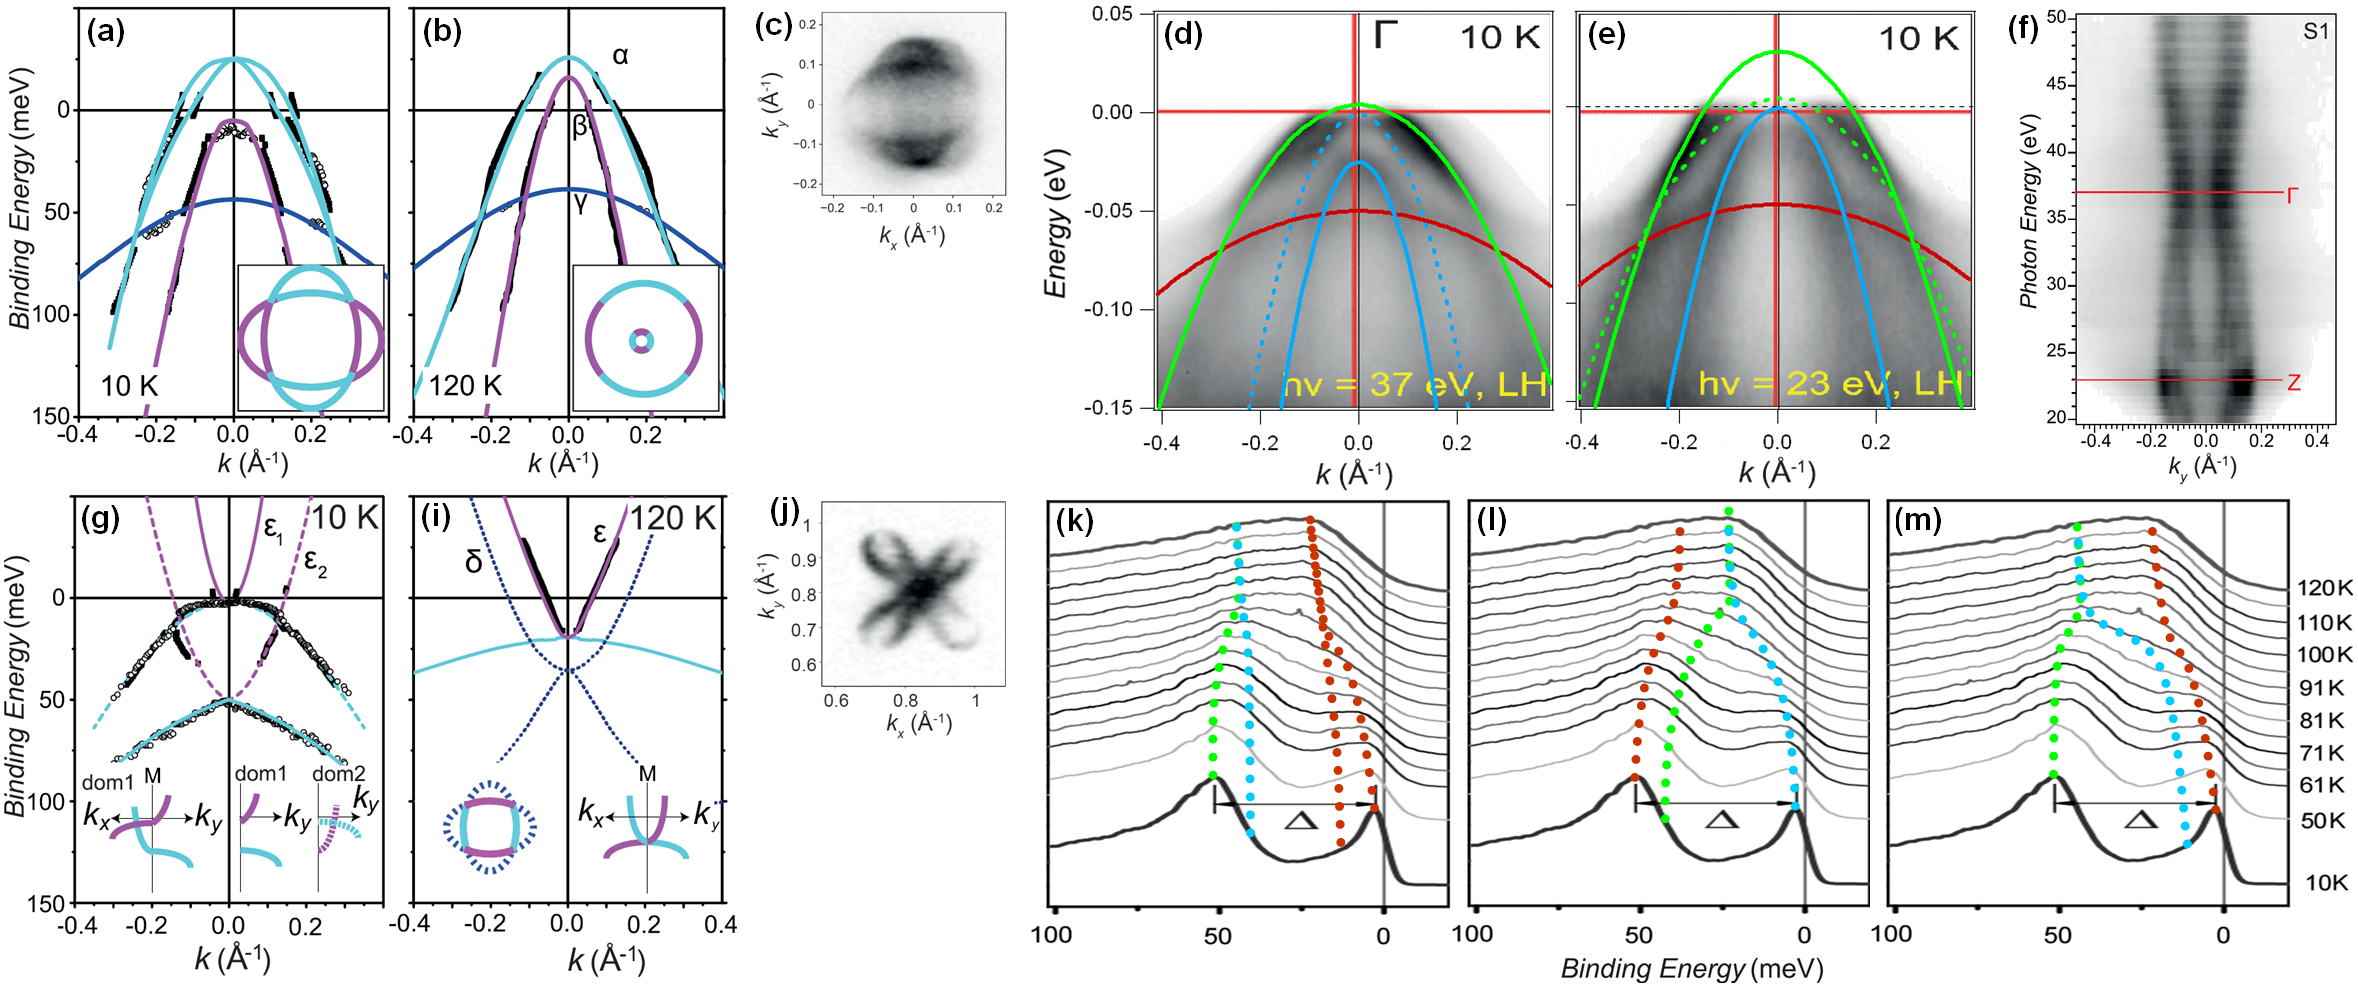
Five years later, when the quality of FeSe crystals had been considerably improved Chareev2013 ; Watson2015 ; Roessler2016 , the electronic structure in nematic state has been revealed and studied in a number of ARPES papers Shimojima2014 ; Nakayama2014 ; Watson2015 . Fig. 4 (d-h) and Fig. 10 show the results of the most accurate ARPES study of the nematic phase as for the middle of 2015 Watson2015 . The effects of nematicity have been observed in both (Z)- and M-regions of BZ. In (Z)-region the circular FS, see inset in Fig. 10 (b), splits into two ellipses below , Fig. 10 (a, c). Each ellipse is attributed to a set of orthogonal domains, so, the corresponding dispersions should meet on Z-axis of BZ. Since the electronic structure in the corners of the orthorhombically distorted BZ may be different, the large splitting of about 50 meV seen in M-point, Fig. 10 (g), has been considered as huge effect of nematicity Shimojima2014 ; Nakayama2014 ; Watson2015 and supported by many other ARPES studies Zhang2015 ; YZhang2015 ; Fanfarillo2016 .
However, even in the original set of spectra from M-point measured at different temperature Watson2015 , one can see that the final splitting is present in all curves above : Fig. 10 (k-m) show this set of spectra with 3 possible scenario of peaks splitting. The authors of Ref. Watson2015, have noticed the final splitting above and have resolved it in recent experiment Watson2016 , but they suggest another scenario, where now no additional splitting appears but the separation between the and bands increases below due to “unidirectional nematic bond ordering”. We think that the most reasonable is the scenario shown in Fig. 10 (k) when both and bands split below of about 10 meV. This scenario is supported by recent data Fedorov2016 , where the nematicity driven splitting is estimated as 15 meV and is also in line with previous theoretical arguments Fernandes2014 . Nevertheless, we think that there is still space for all the scenarios. The point is that the lineshape of each of the two peaks below are evidently not a shape of the single band spectral function, but it should not be so due to strong dependence of the lower band (see Fig. 4a) and certain integration due to very finite electron escape depth Kordyuk2014 .
There are also different opinions about FS splitting in the BZ center. The results of Ref. Fedorov2016, support the nematic domains scenario Watson2015 , while other authors, e.g. YZhang2015 , believe that the splittings at the Z and M points are controlled by different order parameters. In Fig. 10 (d,e) we show the parabolic fits to the experimental hole bands at (d) and Z (e). Based on these fits, we want to note that it is unlikely that the two outer bands meet at their tops, as it would be required by the nematic domain scenario. This is especially clear in Z-point. Also, the middle (dashed blue) band near -point coincides with the inner band (solid blue) from near Z-point, and the middle band (dashed green) near Z-point (e) coincides with the outer (solid green) band from the -point. This may be a result of doubling of the unit cell or similar suppression of the near neighbor hopping in direction. Interestingly, the photon energy dependence of the experimentally measured FS shows a twice smaller period for the inner FS corrugation. The importance of the out-of-plane interaction for nematic ordering follows also from the fact that nematicity is observed in single crystals and in multi layer films Zhang2015 but neither in 1UC films nor in intercalates.
Temperature evolution. As we have shown above, the electronic band structure of bulk FeSe compounds changes dramatically with temperature across the nematic transition. Interestingly, the band structure continues to evolve far above AbdelHafiez2016 (and far below) . Also we have discussed that the real band structure of Fe-SC’s, measured usually at low temperature, in addition to strong renormalization, is also deformed by a “red-blue shift” with respect to first-principle calculations, as shown schematically in Fig. 4 (b). Such shifts are observed for all FeSC’s, in particular for BFCA Brouet2013 , BKFA, and LiFeAs Kordyuk2012 ; Kordyuk2013 and can be described in terms of hopping selective renormalization or as Pomeranchuk instability of the Fermi surface Zhai2009 ; Massat2016 . On the other hand, such a shift can be natural consequence of the strong particle-hole asymmetry in multiband nearly compensated metals Ortenzi2009 ; Benfatto2011 ; Fanfarillo2016 .
In any case, it is tempting to suppose that at hight enough temperature, the band structure, or at least the FS topology, coincides with the result of LDA band structure calculations but an interaction like the hopping selective renormalization develops with lowering temperature and with increase of the strength of fluctuations of certain order. While the temperature dependent ARPES is rather complicated Kordyuk2014 , one may consider the temperature dependent Hall measurements as a complementary tool Evtushinsky2008 that is especially sensitive when the FS goes through the topological Lifshitz transitions, such as from electron like barrels to mixed electron-hole like propellers in BKFA Evtushinsky2011 ; Zabolotnyy2009 . Then, careful temperature dependent ARPES measurements would be a key tool to identify the microscopic interaction that is responsible for both the temperature evolution of the band structure in Fe-SC’s and the nematic instability.
IV Conclusions
In this review, we have analyzed the published results on electronic structure of FeSe-based superconductors: isovalently doped crystals, intercalates, and single layer films. We have summarized the results of first-principle calculations and ARPES experiments in Fig. 9 and Tables I and II. The experimental band structure, with respect to calculations, is renormalized and selectively shifted (“red-blue shift”) such as the Fe-Fe nearest neighbor hopping is suppressed essentially for the Fe 3 conducting band and suppressed completely for the band for all the FeSe compounds here considered. This suggests a crucial role of spin or orbital fluctuations in formation of the normal state electronic structure as a ground state for superconductivity. Temperature dependent ARPES measurements through the nematic transition and to the highest temperatures will be a key tool to identify the microscopic interaction responsible for those shifts.
The nematicity is certainly a result of intrinsic electronic instability but the details of its effect on electronic structure is still controversial. In particular, the role of three-dimensionality is not studied at all.
As for proximity to Lifshitz transitions, only FeSe, and to a greater extent Fe(Se,Te), may belong to -class of Fe-SC’s (see Fig. 1), similarly to LiFeAs and Ba(Fe,Co)2As2, where superconductivity could be enhanced by a shape resonance on small 3D FS formed by the inner hole band. One may speculate that similar enhancement one can get on small electron FS in intercalated samples and on some yet hidden bands in 1UC films, but this issue certainly requires further investigation.
Acknowledgements.
We acknowledge discussions with M. Abdel-Hafiez, V. V. Bezguba, A. Bianconi, S. V. Borisenko, V. Brouet, D. A. Chareev, A. V. Chubukov, A. I. Coldea, I. Eremin, D. V. Evtushinsky, D. S. Inosov, T. K. Kim, M. M. Korshunov, I. V. Morozov, S. Rößler, M. V. Sadovskii, J. Spałek, A. N. Vasiliev, A. N. Yaresko, and V. B. Zabolotnyy.References
- (1) F.-C. Hsu et al., Proc. Natl. Acad. Sci. USA 105, 14262 (2008).
- (2) Y. Mizuguchi and Y. Takano, J. Phys. Soc. Jpn. 79, 102001 (2010).
- (3) S. Medvedev et al., Nat. Mater. 8, 630 (2009).
- (4) J. Guo et al., Phys. Rev. B 82, 180520 (2010).
- (5) L. Sun et al., Nature 483, 67 (2012).
- (6) Q.-Y. Wang et al., Chin. Phys. Lett. 29, 037402 (2012).
- (7) D. Liu et al., Nat Commun 3, 931 (2012).
- (8) J.-F. Ge et al., Nat. Mater. 14, 285 (2015).
- (9) I. Bozovic and C. Ahn, Nat. Phys. 10, 892 (2014).
- (10) M. A. Tanatar et al., Phys. Rev. B 81, 184508 (2010).
- (11) J.-H. Chu et al., Science 329, 824 (2010).
- (12) C. de la Cruz et al., Nature 453, 899 (2008).
- (13) Q. Huang et al., Phys. Rev. Lett. 101, 257003 (2008).
- (14) J. Paglione and R. L. Greene, Nat. Phys. 6, 645 (2010).
- (15) R. M. Fernandes, A. V. Chubukov, and J. Schmalian, Nat. Phys. 10, 97 (2014).
- (16) P. J. Hirschfeld, M. M. Korshunov, and I. I. Mazin, Rep. Prog. Phys. 74, 124508 (2011).
- (17) T. M. McQueen et al., Phys. Rev. Lett. 103, 057002 (2009).
- (18) I. A. Nekrasov et al., arXiv:1605.02404 (2016) (to be published in this issue).
- (19) M. V. Sadovskii, to be published in UFN (2016).
- (20) P. Massat et al., arXiv:1603.01492 (2016).
- (21) A. A. Kordyuk, Low Temp. Phys. 38, 888 (2012).
- (22) A. A. Kordyuk et al., J. Supercond. Nov. Magn. 26, 2837 (2013).
- (23) A. Bianconi, Nat. Phys. 9, 536 (2013).
- (24) A. A. Kordyuk, Low Temp. Phys. 40, 286 (2014).
- (25) A. A. Kordyuk, Low Temp. Phys. 41, 319 (2015).
- (26) N. Katayama et al., J. Phys. Soc. Jpn. 79, 113702 (2010).
- (27) A. V. Fedorchenko et al., Low Temp. Phys. 37, 83 (2011).
- (28) Z. R. Ye et al., arXiv:1512.02526 (2015).
- (29) S.-G. Jung et al., Sci. Rep. 5, 16385 (2015).
- (30) D. Chareev et al., CrystEngComm 15, 1989 (2013).
- (31) K. Deguchi, Y. Takano, and Y. Mizuguchi, Sci. Technol. Adv. Mater. 13, 054303 (2012).
- (32) M. Abdel-Hafiez et al., Phys. Rev. B 93, 224508 (2016).
- (33) X. Lai et al., J. Am. Chem. Soc. 137, 10148 (2015).
- (34) S. Rößler et al., Phys. Rev. B 92, 060505 (2015).
- (35) Y. Sun, S. Pyon, and T. Tamegai, Phys. Rev. B 93, 104502 (2016).
- (36) M. A. Tanatar et al., arXiv:1511.04757 (2015).
- (37) S. V. Borisenko et al., Nat. Phys. 12, 311 (2016).
- (38) C.-L. Song et al., Science 332, 1410 (2011).
- (39) Y. G. Naidyuk et al., Low Temp. Phys. 42, 31 (2016).
- (40) H. K. Vivanco and E. E. Rodriguez, arXiv:1603.02334 (2016).
- (41) J. Maletz et al., Phys. Rev. B 88, 134501 (2013).
- (42) D. M. Wang et al., Phys. Rev. B 83, 132502 (2011).
- (43) Y. J. Yan et al., Sci. Rep. 2, 212 (2011).
- (44) M. Izumi et al., Sci. Rep. 5, 9477 (2015).
- (45) S. He et al., Nat. Mater. 12, 605 (2013).
- (46) S. Tan et al., Nat. Mater. 12, 634 (2013).
- (47) A. V. Chubukov, R. M. Fernandes, and J. Schmalian, Phys. Rev. B 91, 201105 (2015).
- (48) A. E. Böhmer et al., Phys. Rev. B 87, 180505 (2013).
- (49) S.-H. Baek et al., Nat. Mater. 14, 210 (2015).
- (50) A. E. Böhmer et al., Phys. Rev. Lett. 114, 027001 (2015).
- (51) G. Grechnev et al., J. Magn. Magn. Mater. 324, 3460 (2012).
- (52) S. Rößler et al., Phys. Status Solidi B , n/a (2016).
- (53) J. K. Glasbrenner et al., Nat. Phys. 11, 953 (2015).
- (54) F. Wang, S. A. Kivelson, and D.-H. Lee, Nat. Phys. 11, 959 (2015).
- (55) S. Li et al., Phys. Rev. B 79, 054503 (2009).
- (56) M. C. Rahn et al., Phys. Rev. B 91, 180501 (2015).
- (57) Q. Wang et al., Nat. Mater. 15, 159 (2016).
- (58) D. V. Evtushinsky et al., Phys. Rev. B 89, 064514 (2014).
- (59) J. Maletz et al., Phys. Rev. B 89, 220506 (2014).
- (60) M. D. Watson et al., Phys. Rev. B 91, 155106 (2015).
- (61) A. Fedorov et al., arXiv:1606.03022 (2016).
- (62) M. D. Watson et al., arXiv:1603.04545 (2016).
- (63) A. Subedi et al., Phys. Rev. B 78, 134514 (2008).
- (64) M. Aichhorn et al., Phys. Rev. B 82, 064504 (2010).
- (65) V. Cvetkovic and O. Vafek, Phys. Rev. B 88, 134510 (2013).
- (66) D. V. Evtushinsky et al., arXiv:1409.1537 (2014).
- (67) L. Fanfarillo et al., arXiv:1605.02482 (2016).
- (68) A. Tamai et al., Phys. Rev. Lett. 104, 097002 (2010).
- (69) F. Chen et al., Phys. Rev. B 81, 014526 (2010).
- (70) I. A. Nekrasov and M. V. Sadovskii, JETP Letters 93, 166 (2011).
- (71) Y. Zhang et al., Nat. Mater. 10, 273 (2011).
- (72) T. Qian et al., Phys. Rev. Lett. 106, 187001 (2011).
- (73) M. Xu et al., Phys. Rev. B 85, 220504 (2012).
- (74) D. Mou et al., Phys. Rev. Lett. 106, 107001 (2011).
- (75) X.-P. Wang et al., EPL 93, 57001 (2011).
- (76) M. Burrard-Lucas et al., Nat. Mater. 12, 15 (2013).
- (77) T. Hatakeda et al., J. Phys. Soc. Jpn. 82, 123705 (2013).
- (78) U. Pachmayr et al., Angew. Chem. Int. Ed. 54, 293 (2015).
- (79) X. F. Lu et al., Nat. Mater. 14, 325 (2015).
- (80) X. H. Niu et al., Phys. Rev. B 92, 060504 (2015).
- (81) J. Zhao et al., Phys. Rev. Lett. 109, 267003 (2012).
- (82) M. Sunagawa et al., J. Phys. Soc. Jpn. 85, 073704 (2016).
- (83) I. A. Nekrasov, N. S. Pavlov, and M. V. Sadovskii, JETP Letters 97, 15 (2013).
- (84) X. H. Niu et al., Phys. Rev. B 93, 054516 (2016).
- (85) M. Yi et al., Nat Commun 6, (2015).
- (86) A. Ohtomo and H. Y. Hwang, Nature 427, 423 (2004).
- (87) A. F. Santander-Syro et al., Nature 469, 189 (2011).
- (88) J. Bang et al., Phys. Rev. B 87, 220503 (2013).
- (89) H. Ding et al., arXiv:1603.00999 (2016).
- (90) Y. Zhou and A. J. Millis, arXiv:1603.02728 (2016).
- (91) M. X. Chen, D. F. Agterberg, and M. Weinert, arXiv:1603.03841 (2016).
- (92) J. J. Lee et al., Nature 515, 245 (2014).
- (93) Y.-Y. Xiang et al., Phys. Rev. B 86, 134508 (2012).
- (94) C.-L. Song et al., Phys. Rev. Lett. 116, 157001 (2016).
- (95) Y. Miyata et al., Nat. Mater. 14, 775 (2015).
- (96) T. Shimojima et al., Phys. Rev. B 90, 121111 (2014).
- (97) K. Nakayama et al., Phys. Rev. Lett. 113, 237001 (2014).
- (98) P. Zhang et al., Phys. Rev. B 91, 214503 (2015).
- (99) Y. Zhang et al., arXiv:1503.01556 (2015).
- (100) R. M. Fernandes and O. Vafek, Phys. Rev. B 90, 214514 (2014).
- (101) V. Brouet et al., Phys. Rev. Lett. 110, 167002 (2013).
- (102) H. Zhai, F. Wang, and D.-H. Lee, Phys. Rev. B 80, 064517 (2009).
- (103) L. Ortenzi et al., Phys. Rev. Lett. 103, 046404 (2009).
- (104) L. Benfatto and E. Cappelluti, Phys. Rev. B 83, 104516 (2011).
- (105) D. V. Evtushinsky et al., Phys. Rev. Lett. 100, 236402 (2008).
- (106) D. V. Evtushinsky et al., J. Phys. Soc. Jpn. 80, 023710 (2011).
- (107) V. B. Zabolotnyy et al., Nature 457, 569 (2009).