Being WISE II: Reducing the Influence of Star Formation History on the Mass-to-Light Ratio of Quiescent Galaxies
Abstract
Stellar population synthesis models can now reproduce the photometry of old stellar systems (age 2 Gyr) in the near-infrared (NIR) bands at 3.4 and 4.6m (WISE W1 W2 or IRAC 1 2). In this paper we derive stellar mass-to-light ratios for these and optical bands, and confirm that the NIR M/L shows dramatically reduced sensitivity to both age and metallicity compared to optical bands, and further, that this behavior leads to significantly more robust stellar masses for quiescent galaxies with [Fe/H] –0.5 regardless of star formation history (SFH). We then use realistic early-type galaxy SFHs and metallicity distributions from the EAGLE simulations of galaxy formation to investigate two methods to determine the appropriate M/L for a galaxy: 1) We show that the uncertainties introduced by an unknown SFH can be largely removed using a spectroscopically inferred luminosity-weighted age and metallicity for the population to select the appropriate single stellar population (SSP) equivalent M/L. Using this method, the maximum systematic error due to SFH on the M/L of an early-type galaxy is 4 at 3.4 m and typical uncertainties due to errors in the age and metallicity create scatter of 13. The equivalent values for optical bands are more than 2-3 times greater, even before considering uncertainties associated with internal dust extinction. 2) We demonstrate that if the EAGLE SFHs and metallicities accurately reproduce the true properties of early-type galaxies, the use of an iterative approach to select a mass dependent M/L can provide even more accurate stellar masses for early-type galaxies, with typical uncertainties 9.
1. Introduction
Mass appears to be the principle property of galaxies, and can act as the main parameter determining almost all other attributes such as star formation rate (e.g. Peng et al., 2010; Li et al., 2011), assembly history (e.g. Kauffmann et al., 2003b), color (e.g. Peng et al., 2010), and morphology (e.g. Bamford et al., 2009). When discussing galaxy mass, it is important to differentiate the different mass components present. Arguably the most fundamental property is total dynamical mass which encompasses all baryonic and non-baryonic (i.e. dark matter) components. A close second in importance is the total mass locked up in stars and stellar remnants. Finally, there are the generally smaller (at ) components of gas and dust.
Determining the exact quantities of each mass component present in a galaxy is a major challenge, with the robust determination of stellar mass being notoriously difficult. Fundamentally, all methods to determine the stellar mass of galaxies rely on the use of stellar population synthesis (SPS) models to produce estimates of the amount of light emitted at some wavelength per unit mass of stars present, i.e. the stellar mass-to-light ratio (hereafter M/L). At its simplest this can be done assuming a galaxy has a single stellar population (SSP) and using a single photometric bandpass. More sophisticated approaches use multiple photometric bands and/or spectra in order to attempt to fit more realistic star formation histories and to estimate dust obscuration, and thereby to decompose the integrated light into the constituent components emitted by each stellar population separately (see e.g. Bell et al. 2003; Kannappan & Gawiser 2007; da Cunha et al. 2008; Zibetti et al. 2009; McDermid et al. 2015; Magris C. et al. 2015 for various implementations and Mitchell et al. 2013 for a detailed examination of the systematic uncertainties present in this approach). In effect this results in the fitting of multiple mass-to-light ratios to each galaxy’s stellar make-up.
However, regardless of the sophistication of the analysis procedure, all approaches to estimate the stellar masses of galaxies suffer from several complicating effects including: 1) the strong age dependence of the spectral energy distribution of a stellar population that biases the derived properties towards those of the youngest population present, 2) the influence of gas and dust absorption and emission, 3) the poorly constrained effect of rare but luminous stellar phases such as thermally pulsating asymptotic giant branch stars (TP-AGB), 4) an imperfect knowledge of the star formation history (and the associated metallicity evolution) of the galaxy being studied, and 5) the possible variation of the initial mass function (IMF) from galaxy to galaxy or even from stellar population to stellar population within galaxies.
The study of the stellar emission of galaxies in the near infra-red has long held promise as a way to reduce the influence of many of the effects listed above. For example, the NIR M/L ratios of old stellar systems are significantly less affected by unconstrained age variations than their optical counterparts (e.g. Meidt et al., 2014). In addition, in the NIR the metallicity dependence of the mass-to-light ratio is significantly reduced relative to that seen in the optical (see e.g. Norris et al., 2014). The NIR is also significantly less influenced by the presence of obscuring dust and gas as compared to the optical bands; the V band extinction for example is a factor of 15 times larger than that in the 3.4m band assuming a Milky Way-like extinction law (Schlafly & Finkbeiner, 2011; Yuan et al., 2013). Finally, there is evidence that the influence of poorly constrained stellar phases such as the TP-AGB phase may not be as significant as previously thought (for example see Gonzalez-Perez et al. 2014 for a description of the differences in predicted galaxy luminosity functions resulting from the use of different TP-AGB prescriptions). In particular McGaugh & Schombert (2015) find that all objects in their sample of gas-rich disk galaxies are consistent with having the same M/L with very small (0.12 dex) scatter in the IRAC1 (Fazio et al., 2004) band. In this study we further reduce the confusing influence of TP-AGB stars by focussing on quiescent galaxies, where the influence from TP-AGB stars is negligible.
Motivated by the dramatic increase in observations of galaxies in the 3.4/3.6m bands due to the large surveys undertaken by the Spitzer space telescope (e.g. SINGS; Kennicutt et al. 2003, S4G; Sheth et al. 2010), and the all-sky WISE mission (Wright et al., 2010), we will quantify the reliability of stellar mass estimates derived from this photometry. In particular, we are interested in whether the combination of these NIR photometric observations with the equally dramatic increase in available spectroscopic observations of large samples of galaxies (from e.g. ATLAS3D; Cappellari et al. 2011, SDSS; York et al. 2000, CALIFA; Sánchez et al. 2012) can be used to significantly improve estimates of stellar mass for older (age 2 Gyr) stellar populations.
This paper is structured as follows. In Section 2 we discuss the stellar population models used here. In Section 3 we discuss the effect of star formation history (SFH) on mass-to-light ratios for a range of simple SFHs. In Section 4 we extend this analysis to more realistic SFHs for simulated early-type galaxies, and we further examine possible ways to select the appropriate M/L for early-type galaxies. In Section 5 we discuss the implications of our work, and finally in Section 6 we provide some concluding remarks.
2. Stellar Population Models
In this paper we examine the accuracy of the near infrared bands as stellar mass indicators, in particular when the NIR photometry can be combined with simple spectroscopically derived ages and metallicities. To do this we make use of the stellar population synthesis models of Bressan et al. (2012, 2013). We use these models because of the current generation of SPS models they were found to most accurately reproduce the photometry of a large sample of globular clusters and early-type galaxies (age 2 Gyr) in Paper I of this series (Norris et al., 2014).
We convert the output of the SSP models into predictions for the stellar mass-to-light ratio using the prescription outlined in Paper I. We use the SSP (i.e. single burst) models of Bressan et al. (2012, 2013) with a Chabrier (Chabrier, 2003) IMF, which we convert into M/L assuming that the fractional mass remaining in stars and remnants over time follows the tracks presented by Into & Portinari (2013) for a Kroupa (Kroupa, 2001) IMF, as the Kroupa IMF mass losses are almost identical to those of a Chabrier IMF (Leitner & Kravtsov, 2011).
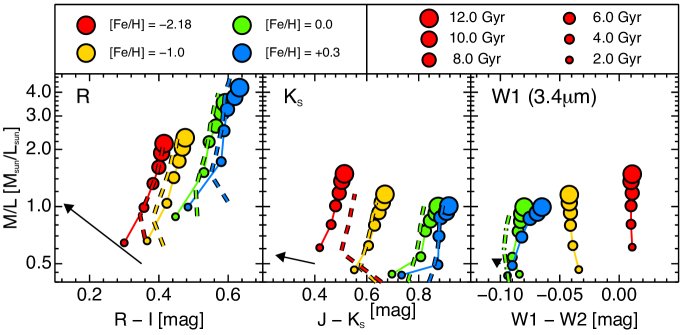
In Figure 1 we show the predicted M/L variation with age and metallicity for three photometric bands that have been posited as accurate proxies for stellar mass; the NIR K (e.g. Kannappan & Wei, 2008) and W1/IRAC1 3.4/3.6m bands (e.g. Eskew et al., 2012; Meidt et al., 2014; Norris et al., 2014; Röck et al., 2015), and the optical R band (e.g. Kannappan et al., 2013). Overplotted on each panel (as the dashed lines) where available are the M/L ratios predicted by the models of Maraston (2005) and the new NIR models of Röck et al. (2015) for similar metallicities and a Kroupa IMF for the purpose of comparison. The slight variation present between the models may be considered as indicative of the typical theoretical uncertainties in the different flavours of SSP models. In particular, as Röck et al. (2015) show, the choice of stellar isochrone models can affect the derived M/L at old ages by 10 - 20. Other potential causes of variation between the models include differences in the implementation of stellar phases such as TP-AGB stars. Nevertheless, the close correspondence between our Bressan et al. (2012, 2013) derived models, and those of Maraston (2005) and Röck et al. (2015) for the R, Ks and W1 bands is heartening, indicating broad agreement for those ages where the influence of rare but luminous stellar phases is reduced (i.e. age 2 Gyr).
From Figure 1 it is clear that the sensitivity of the M/L to both age and metallicity is dramatically reduced in the W1 band compared to the behavior in the R band. In fact, both the Ks and W1 band mass-to-light ratios show approximately half the sensitivity to age, and have essentially no dependence on metallicity [Fe/H] –1 dex (see also Röck et al., 2015). This insensitivity to metallicity –1 dex has particularly useful implications for the study of massive galaxies, since these generally have metallicities in this range. Unfortunately, in contrast to the behaviour in the NIR, the R band M/L approximately doubles when the metallicity is increased from -1 to 0 dex at fixed age and only displays insensitivity to metallicity at lower metallicities than generally observed in galaxies.
Also plotted in each panel of Figure 1 is an arrow denoting the effect on the measured colors and M/L ratio if an extinction of 1 magnitude AV is present but uncorrected. It is clear that the effect of extinction, which is already significantly reduced in the Ks band, is further reduced by a factor of two when moving to the W1 band.
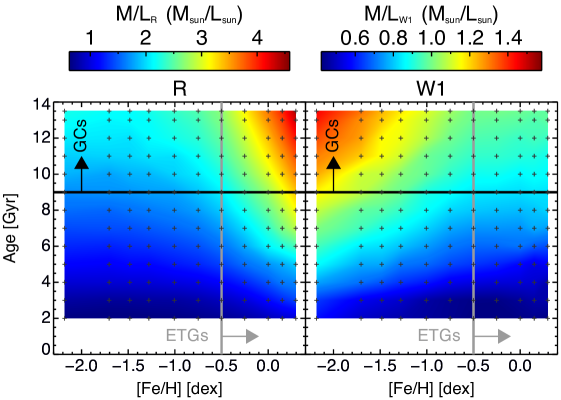
The upper panels of Figure 2 display a smoothed interpolated grid of SSP models, showing the dependence of M/L in the R and W1 bands on age and metallicity. The almost total independence of the mass-to-light ratio of W1 on metallicity for metallicities –1 dex is now even more obvious. As most large galaxies have metallicities in excess of this value, this observation has the potential to be extremely useful when deriving stellar masses for such systems. Additionally, as the lower panels of Figure 2 illustrate more clearly (by normalising each M/L grid to the median of the M/L in each band), for metallicities typical of galaxies the change in M/L when increasing age from 2 to 13.5 Gyr is about a factor of 4 in the R band, but less than a factor of 2 in the W1 band (and a very similar factor in Ks). This relative insensitivity to age implies that the M/L of NIR bands should also benefit from reduced sensitivity to star formation history.
 |
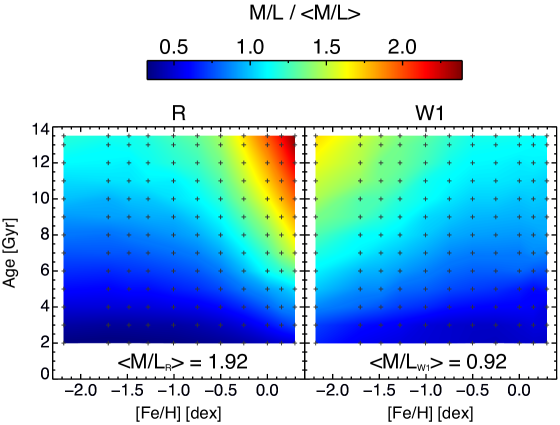 |
Lower Panels: The relative change in M/L for the R (left) and W1 (right) bands. Each panel has been rescaled by the median of the mass-to-light ratios in each band (1.92 in the R, and 0.92 in W1). The relative change in M/L for the W1 band is a maximum of a factor of 2 for ages and metallicities typical of galaxies, while for the R band it is around a factor of 5.
3. The Effect of Star Formation History on Mass-to-Light Ratios
In the preceding section we demonstrated that M/L ratios of the W1 band have several significant advantages over optical bands and can be useful stellar mass indicators for the simplest stellar populations. However, we did this using single stellar population models. In reality most galaxies consist of composite populations formed in many individual star forming events. As such the stellar populations of galaxies are a mixture of stars with a potentially wide range of ages and metallicities. In the real world the usefulness of single mass-to-light ratios derived from SSPs is therefore not obvious.
There are several potential ways to address the problem of the composite nature of the stellar populations of galaxies affecting the measurement of stellar mass. One widely used approach is to attempt to decompose the stellar population of a galaxy into its individual components, or more accurately into a series of pseudo-SSP populations that can then be individually multiplied by their appropriate M/L ratio to give the total stellar mass (see e.g. McDermid et al., 2015; Norris et al., 2015). This approach requires significantly higher quality data that is not available for most current studies and is fraught with degeneracies in the star formation history parameters that can potentially lead to non-unique solutions.
Another approach is to attempt to marginalise over the uncertainty in the SFH by comparing the observed SED/spectra with models that attempt to cover a wide range of SFHs (Kauffmann et al., 2003a; Zibetti et al., 2009). This method suffers from some of the same problems associated with approach 1, as well as uncertainties regarding how well the library of SFHs reproduce those of real galaxies.
A final potential approach is hinted at by the relative insensitivity of the NIR bands to both age and metallicity, as seen in Figures 1 2. In this approach we first examine the actual sensitivity of the M/L in various bands to changes in star formation history and attempt to quantify its importance.
To this end we have computed a range of composite stellar populations (CSPs) using the SSP models and our derived M/L ratios described previously. These models come in two forms, simplistic SFHs designed to illuminate general behavior, and a second set of “realistic” SFHs derived from the EAGLE galaxy formation simulations (Schaye et al., 2015; Crain et al., 2015). We use simulated galaxies, because no large sample of well constrained (i.e. with good age and metallicity resolution) SFHs exist for observed galaxies, particularly for early-type galaxies. Principally this is because very few massive early-type galaxies exist within distances (i.e. within 10 Mpc) for which it is possible to resolve their stellar populations into individual stars. This forces the analysis of early-type galaxies to be done using integrated properties, which inevitably leads to significantly larger uncertainties.
In the case of the simple SFHs, we create our CSPs by constructing a SFH from a series of pseudo-bursts of duration 100 Myr, i.e. all stars formed in each 100 Myr bin are all assigned the same age and metallicity.
For the realistic star formation histories from the EAGLE simulations we wish to adequately reproduce the age and metallicity combinations present in galaxy populations, without having to analyse each star particle individually (the largest galaxies have 500,000 particles). We therefore bin the star particles by logarithmic age and metallicity to provide 41 values of age, with bin centres from 133 Myr to 13.3 Gyr, and 20 of metallicity from –4 to +1 dex. We then convert these composite SFHs into the combined M/L for the whole population at , and determine the R band luminosity-weighted age and metallicity of the composite population. In the later analysis we assume axiomatically these values are the same as the luminosity-weighted age and metallicity that would be derived using spectroscopic methods, such as line index measurements or full spectral fitting as used in, for example, the ATLAS3D (Kuntschner et al., 2010; McDermid et al., 2015) survey. With the luminosity-weighted age and metallicity we then determine the SSP-equivalent M/L for the population and compare this to the true integrated M/L of the simulated galaxy. In order to achieve a more representative comparison with the observations, where the uncertainties on luminosity-weighted age and metallicity can be considerable, we run 100 Monte Carlo re-simulations of the data where we add appropriate measurement errors to the luminosity-weighted age and metallicity and see what effect this has on the mismatch between the true and SSP M/L.
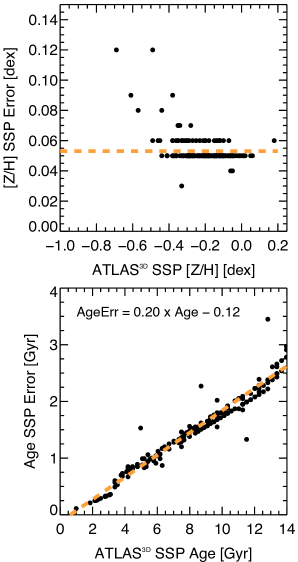
The uncertainties on the age and metallicity used in the Monte Carlo analysis are chosen to match those reported by the ATLAS3D survey (McDermid et al., 2015). We do this because we make the working assumption that the luminosity-weighted stellar population ages and metallicities of our simulated SFHs are equivalent to the SSP-equivalent ages that would be measured using the spectroscopic techniques employed by for example the ATLAS3D survey. Note however, that while this is a very good assumption for metallicity, it is not always the case for age (Trager & Somerville, 2009), SSP ages greater than around 4 Gyr do tend to track lumionsity-weighted age quite well, but at younger ages the correspondence becomes much weaker. Our choice to use realistic errors on the derived age and metallicity is important, because, as expected and Figure 3 demonstrates, the measurement uncertainty on the SSP equivalent age is a function of age (but approximately a constant fraction, 15-20, of the age). This is due to the fact that the primary age sensitive absorption feature used by the ATLAS3D survey to determine the age of a stellar population, H, evolves most rapidly at younger ages. Therefore, for a fixed signal-to-noise ratio (and hence uncertainty on the line strength index), the absolute uncertainty on the age is lower for younger ages. In practice when carrying out the Monte Carlo analysis, the luminosity-weighted age (i.e. SSP equivalent) of the full SFH is calculated, then the error on that age is determined following the relation shown in Figure 3. This means that the uncertainty on an SSP equivalent age drops from around 2 Gyr at 12 Gyr, to around 0.25 Gyr at 2 Gyr. In contrast to the situation for the measured SSP equivalent ages, the SSP equivalent metallicities from the ATLAS3D survey are found to have errors that are approximately independent of metallicity (and age). Therefore a fixed uncertainty of 0.052 dex is applied to the luminosity-weighted metallicity during the Monte Carlo analysis.
3.1. Single Burst Star Formation Histories
The simplest possible SFH is a single burst population with a single metallicity, such as those often assumed for compact stellar systems such as globular clusters (see e.g. Kuntschner et al. 2002; Puzia et al. 2005; Norris et al. 2008). Figure 4 shows the behaviour of the true M/L to SSP M/L ratio as a function of the age of the single burst, for both the R and W1 bands. As expected for such a simple SFH, both the R and W1 SSP M/L ratios accurately reproduce the true M/L in the sense that the ratio M/LTrue to M/LSSP is indistinguishable from unity. Furthermore, this figure also demonstrates that the decreased sensitivity of W1 to age described in Section 2 leads to a corresponding decrease in the scatter of the M/LTrue to M/LSSP ratio, which is reduced in the W1 band by around 50 compared to R, to a statistical uncertainty of less than 10 at all ages. Obviously, it is not surprising that we are able to recover the M/L ratio of an input SSP accurately. However, this plot does demonstrate the absolute minimum uncertainty obtainable on the derived M/L ratio under the assumption of a true SSP, in the absence of dust, and with only random uncertainties on the age and metallicity described in the previous section.
3.2. Constant Star Formation Histories
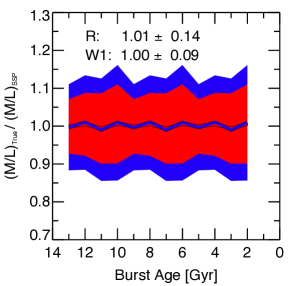
The next step towards a more realistic SFH for a galaxy is to include populations with a range of ages. Figure 5 shows a constant SFH, with stars being formed at a constant rate from 14 to 2 Gyr with constant metallicity. In this figure we can see that for the constant SFH the true M/L to SSP M/L ratio is not unity for either filter, but that the W1 band does do a better job of matching the true M/L and still with reduced scatter relative to the R band. Repeating the procedure for different metallicities yields similar results: in all cases the W1 band SSP M/L is significantly closer to the true value with lower scatter than for the R band. A further feature common to all constant SFHs is that it is clear that the spread in the derived M/LTrue to M/LSSP ratio is slightly asymmetric, with the median ratio indicating that in most cases the Monte Carlo simulations show that the SSP M/L overestimates the true M/L, while the tail indicates that a significant fraction of SSP models underestimate the true M/L. Part of the asymmetry reflects the asymmetry in the luminosity evolution of a stellar population; an error towards younger ages has a larger effect on the M/L than an equal error (in linear age) towards older ages.
Another step towards increasing realism is to include metallicity evolution. Due to enrichment of the inter stellar medium by supernovae and stellar mass loss, subsequent generations of stars are typically more metal-rich than than those that preceded them, although the accretion of fresh, low-metallicity gas from the inter galactic medium can complicate this picture. We have experimented with a range of constant and exponentially declining SFHs (with of 1, 2 and 4 Gyr ), with variable metal enrichment (constant or monotonically increasing). We find that in common with the cases above, the W1 band SSP M/L is almost always closer to the true M/L and always has lower scatter than the R band SSP M/L. The few cases where the R band does provide a better match to the true M/L result from SFHs which, while not technically unphysical, are not seen in the real Universe, i.e. an exponentially declining star formation history with a monotonically smoothly increasing metallicity that takes 14 Gyr to get from –2 dex to solar. However, a common occurrence with the models is for a slight, possibly systematic, mismatch between the SSP and the true M/L. In order to examine this point further it is necessary to examine more realistic SFHs.
3.3. “Realistic” Star Formation Histories
In this section we make use of the EAGLE simulations to examine the effect of more realistic SFHs on the derived M/L. The EAGLE simulations comprise a set of hydrodynamical simulations of cosmologically representative volumes of the Universe with prescriptions for various forms of stellar and AGN feedback. Here we use the largest (in terms of volume and particle number) EAGLE simulation, i.e. model Ref-L100N1504, which consists of a 100 Mpc3 volume, which yields more than 325,000 galaxies with total stellar mass greater than 109.5 M⊙ at . This large sample of simulated galaxies broadly reproduces many observed properties of the galaxy population, including; the stellar mass function, passive galaxy fraction, and most critically for us, the mass-metallicity relation (Schaye et al., 2015). In addition, EAGLE broadly reproduces the observed evolution of the galaxy mass function (Furlong et al., 2015) and the observed bi-modality of galaxy colours (Trayford et al., 2015). Furthermore, the simulations have the benefit that they track the formation of every star particle (each of which has a mass of approximately 106 M⊙ and can be treated as an SSP), whether it formed initially within the most massive progenitor of the =0 galaxy, or within an initially separate galaxy that was accreted by =0. This means that the derived SFHs are much closer to those of real early-type galaxies (which are believed to form through a two phase build up; see e.g. Oser et al. 2010), than the simple toy models we have discussed so far.
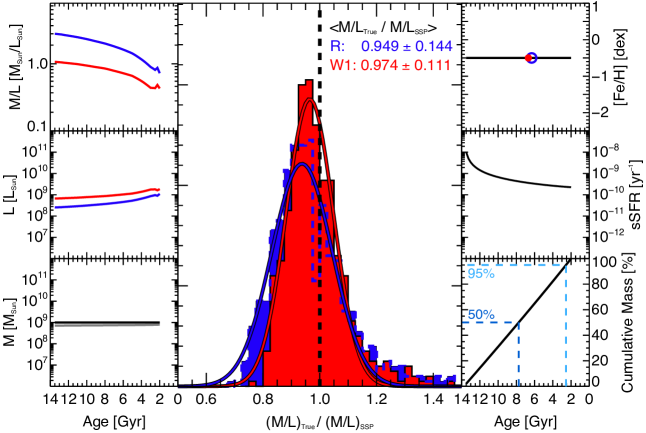
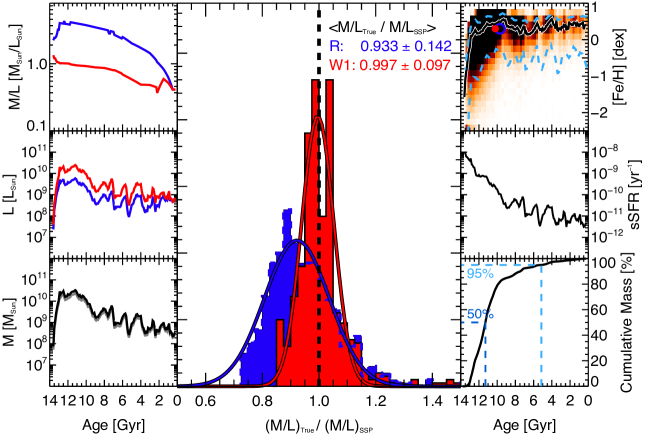
Figure 6 shows the SFH and metallicity enrichment history of one such simulated galaxy, in this case one of the more massive galaxies in the simulation with M⋆ = 6 1011 M⊙. From examination of the bursty nature of the SFH (bottom left panel) and complex metallicity evolution (upper right panel), it is immediately obvious that the evolution of this galaxy is much more realistic than the toy models examined previously. The metallicity evolution in particular captures both periods of rapid increase, during the initial burst of star formation, and then periods of slight decline due to the accretion of lower-metallicity dwarf galaxies or pristine gas from the inter galactic medium. This galaxy also suggests that even the most massive early-types could still be actively forming some stars at . In fact, the rate of star formation and even the sSFR at can be similar to that of the Milky Way. However, compared to the vast bulk of stars already formed, the recently formed stellar mass is negligible. In this simulated galaxy only 5 of the stars were formed in the last 5.5 Gyr. It is also notable that despite the more complex star formation and metallicity enrichment history (compared to the toy model seen in Figure 5), the offset and scatter between true and SSP M/L is still significantly smaller in the W1 band for this galaxy.
As described in Section 3 we bin the EAGLE SFHs into bins of age and metallicity in order to speed up the analysis. We have examined a subset of galaxies using both the binning prescription and one where we analyse each star particle individually, this analysis confirmed that our binning procedure leads to no significant differences when compared to analysing the full star particle sample. However, this is not the case if the data is binned only by age i.e. if the average metallicity is calculated at each timestep (e.g. the black solid line in the age-metallicity panel of Figure 6), in such a binning scheme the influence of lower metallicity stars at younger ages (from accreted dwarfs) is suppressed.
4. Mass-to-Light Ratios of Simulated Quiescent Galaxies
4.1. Selecting Quiescent Galaxies
We are interested primarily in SFHs that lead to early-type/quiescent galaxies, because the light output at 3.4/3.6m for such galaxies is unaffected by significant dust emission that would bias the M/L determination, and the maximum contribution due to non-stellar emission is 15 for such galaxies (Querejeta et al., 2015). We first limit our selection to galaxies with total stellar mass 109.5 M⊙ at to ensure adequate sampling of the ISM and hence to reduce resolution-dependent stochasticity in the star formation rate (Furlong et al., 2015). We choose to use the specific star formation rate (sSFR) vs. stellar mass space as an quiescent galaxy selector as opposed to a more typical color-magnitude or color-stellar mass selection, because this measure is independent of the choice of post-processing done to the EAGLE simulations to convert their stellar masses into luminosity. In other words we avoid any problems caused by there being a mismatch between the models used by the EAGLE simulations to convert mass-to-light, and our approach. In practice these selections also ensure that none of the galaxies selected form more than 5 of their stars within the last 2 Gyr. Such a limit also has the positive benefit for real observed galaxies of limiting the uncertainty caused by highly luminous AGB phases which are most problematic for young ages and are not well constrained in the SSP models used to determine the M/L.
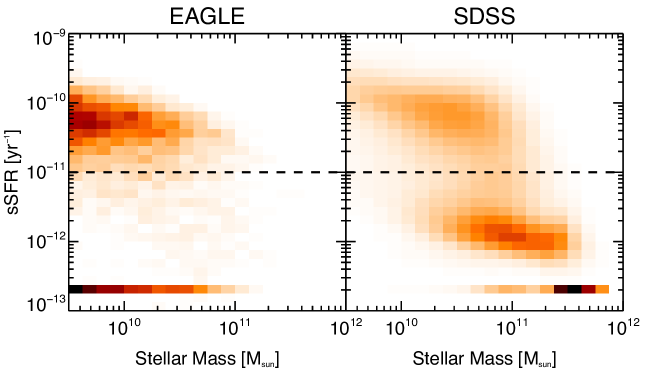
The left panel of Figure 7 shows the sSFR for the full sample of EAGLE galaxies from the 100 Mpc3 volume, while the right panel shows the observed distribution from the SDSS (Kauffmann et al., 2003a; Brinchmann et al., 2004; Salim et al., 2007). The comparison between observed and simulated galaxies is not entirely fair, as the simulated galaxies are able to measure sSFRs that are significantly lower (the minimum sSFR is effectively set by the minimum particle mass) than the observed galaxies, where observational effects mean that either upper limits are all that can be measured, or the sSFR is fixed to be zero. Furthermore, there is a fundamental difference between the EAGLE sample and that of SDSS, the former is volume limited, while the latter is a magnitude limited. Regardless, it is clear that simulated galaxies exist with approximately the correct combinations of sSFR and stellar mass to be safely selected as early-type/quiescent galaxies. Given that the volume-limited sample (if large enough to reduce cosmic variance) is the truer representation of the real Universe we therefore select all EAGLE simulated galaxies which have sSFR 10-11 yr-1 as our simulated quiescent galaxy sample. This selection yields a total sample of 2185 simulated galaxies.
4.2. Estimating M/L Using SSP-Equivalent Ages and Metallicities
Figure 8 shows the result of measuring the mismatch between the true M/L and the luminosity-weighted SSP-equivalent M/L for each of the EAGLE galaxy SFHs. We plot the ratio of the true to SSP M/L vs. stellar mass to search for signs of a systematic trend in the mismatch parameter. Furthermore, the color scale indicates the sSFR of the simulated galaxies in order to search for signs of a correlation with this parameter. The orange dashed line is the best-fit linear relation to the colored dots (with the parameters of the fit indicated at the top of the panel). The grey scale shows the density of 50 Monte Carlo simulations of the input data where to the luminosity-weighted age and metallicity noise was added following the prescription given in Section 3. The green solid line is the median of the grey points in bins of stellar mass, the green dashed lines are the 1 error bars on the median.
Several points are immediately apparent from an inspection of Figure 8:
-
•
The significant reduction in the scatter of the M/LTrue to M/LSSP ratio for the W1 relative to the R band is clear, especially before observational errors are applied (colored points). The scatter in the R band varies from 3 to 8, while in the W1 band it is only 1 to 3. This scatter represents the minimum possible uncertainty achievable when using this method to ascribe a perfectly known luminosity-weighted average age and metallicity to a stellar population.
-
•
In the W1 band there is a statistically significant systematic trend of increasing offset between true and SSP M/L with decreasing stellar mass. This trend appears to be due to the fact that the EAGLE simulations are able to reproduce the effect of cosmological downsizing (Cowie et al., 1996). This downsizing is the observation that, on average, lower-mass galaxies build up larger fractions of their stellar mass at lower redshift than high-mass galaxies. Again, where there is a larger fraction of younger stars, the SSP M/L has more difficulty accurately reproducing the true average M/L. The magnitude of this offset is small, never more than 3-4 in the W1 and could be iteratively removed.
-
•
If such a mass dependent trend for the R band exists, it appears to be obscured by increased scatter in that band due to its larger sensitivity to SFH. In contrast to naive expectations, the worst outliers in the R band (those with M/LTrue / M/LSSP 1) are due to the oldest galaxies. A quick glance at Figure 2 reveals the cause. The M/L ratio changes most dramatically at old ages; the outlying galaxies are those where most of their light comes from stars with a wide spread in metallicity at relatively old ages, typically with little or no star formation later than 8 Gyr. For such galaxies the R band M/L of their stars can span 2 to 4.5 due to the relatively rapid period of metallicity increase common to most galaxies during the first 4 Gyr (see Figure 6), no single SSP is able to adequately reproduce the M/L in this situation. Because these galaxies are then mostly truncated, they never get to build enough additional stars to overpower this effect. In contrast for W1 the M/L change over the same metallicity range is 40-50 so the effect is much less pronounced.
-
•
Finally, even when realistic observational errors are applied (see grey scale in the background), the 1 scatter is a maximum of 13 in W1.
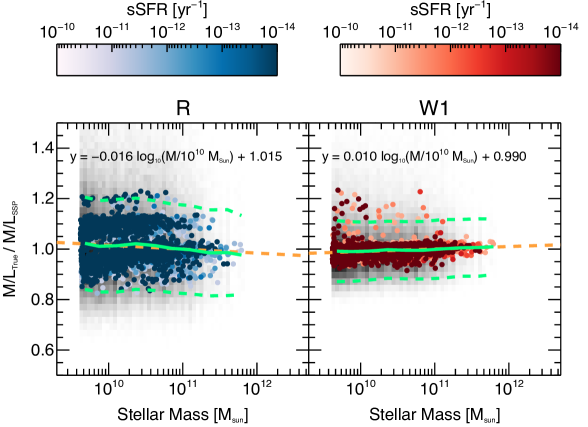
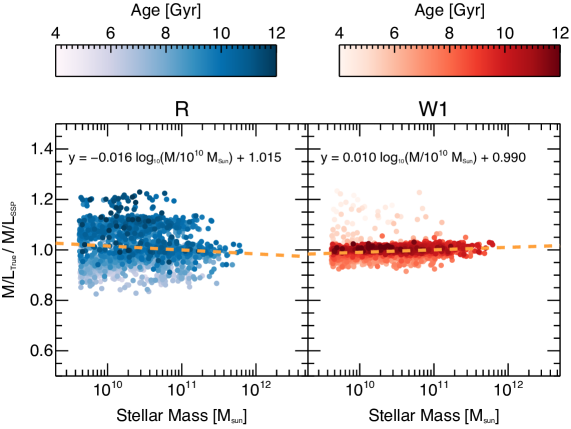
Figure 9 again shows the mismatch between true and luminosity-weighted SSP-equivalent M/L against the stellar mass, only in this case the color scale indicates the luminosity-weighted age of each galaxy. We omit the additional Monte-Carlo simulations for clarity here. From this figure it is clear that offsets from the true to SSP M/L = 1 relation for W1 are driven by age differences. When the SSP equivalent age is 9 Gyr, there is essentially no offset, no systematic trend with mass, and almost negligible scatter for the W1 band (when neglecting observational errors). We shall discuss this point further in Section 5.
4.3. “Constant” Mass-to-Light Ratios
In the previous sections we examined the use of the SSP-equivalent (i.e. luminosity-weighted) age and metallicity of a composite stellar population to derive the appropriate average M/L for that population. We found that given the current observational uncertainties this approach leads to a maximum systematic uncertainty (which can be removed) of only 4 and a random scatter (assuming the smallest currently achievable observational uncertainties on SSP ages and metallicities) of only 13. If the uncertainties on the observational measurement of SSP parameters could be entirely removed the theoretical minimum uncertainty introduced by differences in the SFH is a remarkably small 3 (for the most massive galaxies).
We now examine the common situation whereby the spectroscopic data necessary for the inference of the SSP equivalent age and metallicity are unavailable. Previous studies have indicated that constant mass-to-light ratios in the NIR can be used to provide remarkably accurate stellar mass estimators for both early-type galaxies Meidt et al. (2014) and even late type disks Querejeta et al. (2015); McGaugh & Schombert (2015). Meidt et al. (2014) used a range of exponentially declining SFHs combined with an empirically updated form of the Bruzual & Charlot (2003) models to demonstrate that a single M/L ratio of 0.6 for the IRAC 1 3.6m band can provide a good approximation to the true stellar mass, with only 0.1 dex scatter. Similarly, McGaugh & Schombert (2015) used both a color-mass-to-light ratio relation from population synthesis models, and the Baryonic Tully-Fisher relation, to demonstrate that galaxy disks were well fit by a single M/L of 0.45 (at 3.6 m) with a scatter of only 0.12 dex. Using the S4G sample, Querejeta et al. (2015) find essentially exactly the same M/L (M/Ls range from 0.4 to 0.55) for their sample of disk galaxies later than Sa. In fact, a M/L of 0.45 is consistent with the M/L predicted by our SSP models when the observed luminosity-weighted age and metallicity of spiral galaxy thin disks ( 1 Gyr in the outer regions of the disk; Yoachim & Dalcanton, 2008) is used to select the appropriate M/L.
Our simulated EAGLE SFHs enable us to go a step further, and examine the M/L distribution of simulated quiescent/early-type galaxies. As Figure 10 clearly demonstrates, the spread in M/L for the full sample is remarkably small, in the R band the median M/L is 2.70, with a 1- scatter of only 0.38, for the W1 band the median M/L is 0.86 with a 1- scatter of 0.08. The value of the median M/L is larger than the 0.6 found by Meidt et al. (2014), which likely reflects the slightly different SFHs assumed, slight bandpass and zeropoint differences between the IRAC 1 and W1 filters, and zeropoint differences between the two sets of SSP models used to determine the evolution of the M/L (a modified version of Bruzual & Charlot 2003 for Meidt et al. 2014, and Bressan et al. 2012, 2013 used here). Comparison with observed galaxies will be required before the exact zeropoint can be reliably determined (i.e. by comparing dynamical and stellar masses derived with varying zeropoints). However, the general trends and behavior described here are independent of the zeropoint, and the results should therefore be robust, irrespective of the flavor of stellar population model used to construct the M/L grids.
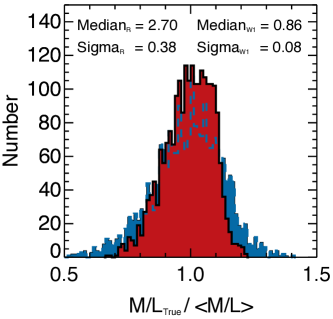
The tight distribution of M/L displayed by the simulated quiescent/early-type galaxies indicates that using a single fixed M/L provides an accurate mass estimator, with scatter of only 9. This is only a factor of three larger than the theoretical minimum uncertainty of the SSP M/L method derived in Section 3.3. It is also slightly better than the typical uncertainty (13) of the SSP-based method, when the current typical observational uncertainties on the luminosity-weighted age and metallicity are taken into account.
However, remarkably, it is possible to further improve the accuracy of this stellar mass indicator. As Figure 11 shows, the M/L correlates strongly with the stellar mass of the galaxy. This trend is driven primarily by the changing average age of the galaxies with stellar mass, which itself is a result of the EAGLE simulations ability (Furlong et al., 2015) to reproduce a form of cosmological “downsizing” (Cowie et al., 1996). This is the observation that lower mass galaxies form more of their stars at later epochs compared to higher mass galaxies, hence the average age of the low mass galaxies is lower than that of high mass galaxies. The well-behaved nature of the trend, and the tightness of the relation (the scatter about the relation varies from a maximum of 9 to only 3) suggests that an iterative approach could be used to determine the appropriate M/L to use for any particular galaxy.
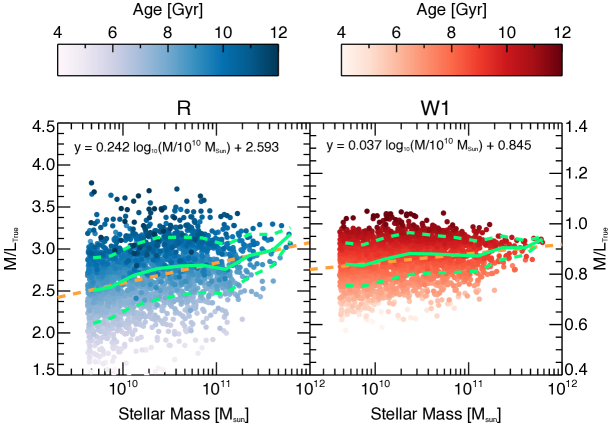
We have tested whether such an iterative approach will work and find that when starting with the median M/L of the full population (2.70 in R and 0.86 in W1), and using the following fits:
| (1) |
| (2) |
we find that convergence is obtained within 5 iterations for all of our EAGLE simulated galaxies. We discuss in Section 5 the implications and positive and negative aspects of both methods for determining the correct M/L in the discussion section.
4.4. The Effect of Dust Extinction
Despite the significant effect that relatively small amounts of dust extinction can have on derived stellar masses (especially in the optical), most studies of early-type galaxies do not attempt to measure or correct for extinction internal to the galaxy being studied (as opposed to Milky Way extinction). Instead, the majority of studies assume that early-types are dust free, despite many early-type galaxies being shown to have significant amounts of dust. For example, di Serego Alighieri et al. (2013) find that around 17 of elliptical and 40 of lenticular galaxies in the Virgo cluster have measurable amounts of dust, a fraction that rises to 24 and 62 in a volume-limited sample of early-type galaxies (Smith et al., 2012).
Here using the NIR bands to determine stellar mass again provides significant benefits. Based on the extinction corrections found in Schlafly & Finkbeiner (2011) and Yuan et al. (2013), the extinction in the W1 band is a factor of 12 less severe than in the R band. Although it must be noted that possible emission from the 3.3m PAH feature can complicate exactly how much cleaner the W1 band is for a given dust mass. However, this effect is likely to be quite small, as Querejeta et al. (2015) demonstrate that non-stellar emission always accounts for less than 15 of the IRAC1 emission for early-type galaxies from the S4G sample. Given the RV values from Schlafly & Finkbeiner (2011) and Yuan et al. (2013), an uncorrected uniform screen of dust providing 0.1 magnitudes of V band extinction would bias the M/L by 7 in the R band and by 0.6 in the W1 band. With 0.5 mag of V extinction the M/L would be incorrect by 31 in the R and by 3 in the W1 bands respectively. Therefore for any reasonable amount of dust extinction the effect would be negligible in the W1 band whilst being significant in the R band (and even worse in bluer bands).
5. Discussion
It is clear from our results that the NIR bands at 3.4 and 3.6 m (and to a very similar extent the K band at 2.2 m) provide an exceptional tracer of stellar mass. The previously noted reduced (relative to the optical) sensitivity of the M/L ratios of these bands to the age of a stellar population translates directly into a reduced sensitivity to the SFH as well.
Using the realistic SFHs from the EAGLE simulations we have demonstrated that when a fully resolved SFH is unavailable, the theoretical minimum uncertainty on a derived M/L is of the order of 3 when using the M/L of an SSP with the same luminosity-weighted age and metallicity as the stellar population. Though we caution that as discussed below the practically achieved minimum uncertainty is nearer 13 when typical errors on spectrally derived SSP age (2 Gyr) are included, and the spectrally derived SSP parameters are assumed to be unbiased compared to those of the true light-weighted parameters. Furthermore, the theoretical minimum scatter does not account for the weak trend of a decreasing offset from unity of the ratio of the true M/L to SSP M/L with stellar mass observed in Figure 8. This trend is driven by systematic changes in the population of galaxies with stellar mass, in the sense that at lower mass there are more young galaxies, and fewer uniformly old galaxies, while at high mass, there are essentially only old galaxies. This trend, which is a manifestation of cosmological downsizing, means that at all stellar masses the M/L of old galaxies is well reproduced by the SSP M/L, but galaxies which are younger (and found preferentially at lower mass) have more extended SFHs which are harder to reproduce with a single SSP equivalent M/L.
The minimum uncertainty is set by second order effects that are not fully captured by the use of a luminosity-weighted age and metallicity to ascribe an SSP M/L to a particular stellar population. In principle, using the observed residuals seen in Figure 9 (e.g. the age dependence of the offset from the 1-to-1 relation), it is possible to create an additional correction to further reduce this uncertainty. However, as Figure 8 amply demonstrates, this step would be largely irrelevant, as in practice the uncertainty on the SSP M/L in the NIR is dominated by the measurement uncertainties on the luminosity-weighted age and metallicity of the stellar population. For the parameterisation of the SSP age and metallicity uncertainties used here (chosen to match those found by the ATLAS3D survey), this uncertainty in the M/L is around 13. The typical uncertainties on the luminosity-weighted age and metallicity would have to be reduced by a factor of around 3 before the magnitude of the two effects would become comparable, and the application of the additional age-dependent second-order correction would become advantageous.
Using the same simulated galaxy SFHs, we have also examined the efficacy of making use of “constant” NIR M/L ratios to determine galaxy stellar masses. In common with other studies (Meidt et al., 2014; McGaugh & Schombert, 2015), we find that this approach provides a robust stellar mass. However, because of the extra information provided by our simulated SFHs, we are able to go a step further and employ an iterative approach to derive a mass-dependent M/L for a quiescent/early-type galaxy. This method accounts for the systematic variation of the population average M/L with galaxy stellar mass. This again is a manifestation of the cosmological downsizing, as Figure 11 demonstrates, the trend of decreasing M/L with decreasing stellar mass is driven by the decreasing average age of galaxies at lower stellar mass. We caution that the exact form of this correction depends on the ensemble properties of the simulated galaxies used to derive it, and the uncertainties on its use are likely to be significantly larger than the stated scatter, due in large part to a form of “cosmic variance” and the relatively small number of simulated galaxies used to define the correction. For example, if we define the relation using quiescent/early-types selected exclusively in cluster environments, the average ages at all stellar masses would likely be higher and the slope of the relation would change somewhat. However, regardless of the exact form of the relation and hence on its applicability as a correction formula, we are confident that this behavior is an unavoidable consequence of the downsizing paradigm, and must be present in some form for real galaxy populations.
Despite the apparently improved accuracy provided by the mass-dependent M/L approach, we would still advise the use of the SSP-M/L approach in cases where the necessary SSP ages and metallicities are available. This is principally because the results of the SSP-M/L approach are more robustly model independent; the maximum systematic offset indicated by the models is only 3-4 over the mass range studied, and as long as the luminosity-weighted age of the galaxy is 4 Gyr, this uncertainty should not be exceeded. The accuracy of the mass-dependent M/L depends on how closely the sample of simulated galaxies used to derive it actually matches the population of galaxies it is being applied to. For example, if a large fraction of the observed galaxies are lower mass, but genuinely old (i.e. SSP age 9 Gyr), the mass-dependent M/L method would lead to a significantly larger error than expected.
In either case, the use of W1/IRAC1 (or K) photometry is strongly advised over the use of optical bands, simply because the contribution of dust extinction in quiescent/early-type galaxies is not zero and even 0.1 magnitudes of V extinction leads to a M/L bias of 7 in the R band, but less than 0.6 in W1.
6. Conclusions
Using state-of-the-art simple stellar population models (SSP) and cosmological hydrodynamical simulations, we have examined the influence of the star formation history (SFH) and the metallicity distribution on our ability to recover accurate average stellar mass-to-light ratios in the optical and near infrared. We find that when additional information is available in the form of the luminosity-weighted (i.e. SSP equivalent) age and metallicity of the composite stellar population, it is possible to determine accurately the stellar mass of a quiescent/early-type galaxy using the NIR bands. We find that when using the W1 band as the stellar mass tracer for quiescent/early-type galaxies the maximum systematic uncertainty due to variations in the SFH is 4 for total stellar mass 109.5 M⊙, with a SFH-dependent scatter at fixed stellar mass that is of a similar order. When assuming appropriate uncertainties on the luminosity-weighted age and metallicity ( 2 Gyr when 12 Gyr old, 0.25 Gyr when 2 Gyr old, and uncertainty of 0.052 dex on metallicity at all ages), we estimate typical uncertainties on individual stellar mass estimates to be 13 when using the W1 band, while the equivalent uncertainties for the R band are 2-3 times larger even before internal dust extinction effects (which are negligible in the IR) are included. Where such high-quality, spectroscopically derived, SSP-equivalent ages and metallicities are available we suggest their use in conjunction with NIR W1/IRAC1 photometry as the most robust estimator of early-type stellar mass.
Furthermore, we present an iterative method for determining a mass-dependent M/L that yields formal uncertainties 9. As this method requires no additional information, it is ideally suited for large volume-limited surveys which match the environment distribution seen in the EAGLE simulations, but which lack suitable spectroscopic observations to determine SSP-equivalent ages and metallicities.
In cases where the particular galaxy survey is not likely to adequately sample the true volume-limited galaxy population fairly (or more correctly the EAGLE representation of the population), in order to avoid introducing sample dependent correlations it would be preferable to assume a fixed NIR M/L.
In a forthcoming paper we will apply both these procedures to data from the ATLAS3D survey, and use them to investigate the existence of a systematic variation in the IMF with stellar mass for quiescent/early-type galaxies.
7. Acknowledgements
The authors would like to thank the anonymous referee for their helpful comments that greatly improved this paper.
RAC is supported by a Royal Society University Research Fellowship. We thank PRACE for awarding us access to the Curie facility based in France at Tres‘ Grand Centre de Calcul. This study used the DiRAC Data Centric system at Durham University, operated by the Institute for Computational Cosmology on behalf of the STFC DiRAC HPC Facility (www.dirac.ac.uk); this equipment was funded by BIS National E-infrastructure capital grant ST/K00042X/1, STFC capital grant ST/H008519/1, STFC DiRAC Operations grant ST/K003267/1 and Durham University. DiRAC is part of the National E-Infrastructure. The study was sponsored by the Dutch National Computing Facilities Foundation (NCF) for the use of supercomputer facilities, with financial support from the Netherlands Organisation for Scientific Research (NWO), and the European Research Council under the European Unions Seventh Framework Programme (FP7/2007- 2013) / ERC Grant agreements 278594 GasAroundGalaxies, GA 267291 Cosmiway, and 321334 dustygal. Support was also received via the Interuniversity Attraction Poles Programme initiated by the Belgian Science Policy Office ([AP P7/08 CHARM]), the National Science Foundation under Grant No. NSF PHY11-25915, and the UK Science and Technology Facilities Council (grant numbers ST/F001166/1 and ST/I000976/1) via rolling and consolidating grants awarded to the ICC.
GvdV, and ES acknowledge support from the FP7 Marie Curie Actions of the European Commission, via the Initial Training Network DAGAL under REA grant agreement n∘ 289313. SM acknowledges support from the German Science Foundation (DFG) via grant DFG SCHI 536/7-1.
References
- Bamford et al. (2009) Bamford, S. P., Nichol, R. C., Baldry, I. K., et al. 2009, MNRAS, 393, 1324
- Bell et al. (2003) Bell, E. F., McIntosh, D. H., Katz, N., & Weinberg, M. D. 2003, ApJS, 149, 289
- Bressan et al. (2013) Bressan, A., Marigo, P., Girardi, L., Nanni, A., & Rubele, S. 2013, in European Physical Journal Web of Conferences, Vol. 43, European Physical Journal Web of Conferences, 3001
- Bressan et al. (2012) Bressan, A., Marigo, P., Girardi, L., et al. 2012, MNRAS, 427, 127
- Brinchmann et al. (2004) Brinchmann, J., Charlot, S., White, S. D. M., et al. 2004, MNRAS, 351, 1151
- Bruzual & Charlot (2003) Bruzual, G., & Charlot, S. 2003, MNRAS, 344, 1000
- Cappellari et al. (2011) Cappellari, M., Emsellem, E., Krajnović, D., et al. 2011, MNRAS, 413, 813
- Chabrier (2003) Chabrier, G. 2003, ApJ, 586, L133
- Cowie et al. (1996) Cowie, L. L., Songaila, A., Hu, E. M., & Cohen, J. G. 1996, AJ, 112, 839
- Crain et al. (2015) Crain, R. A., Schaye, J., Bower, R. G., et al. 2015, MNRAS, 450, 1937
- da Cunha et al. (2008) da Cunha, E., Charlot, S., & Elbaz, D. 2008, MNRAS, 388, 1595
- di Serego Alighieri et al. (2013) di Serego Alighieri, S., Bianchi, S., Pappalardo, C., et al. 2013, A&A, 552, A8
- Eskew et al. (2012) Eskew, M., Zaritsky, D., & Meidt, S. 2012, AJ, 143, 139
- Fazio et al. (2004) Fazio, G. G., Hora, J. L., Allen, L. E., et al. 2004, ApJS, 154, 10
- Furlong et al. (2015) Furlong, M., Bower, R. G., Theuns, T., et al. 2015, MNRAS, 450, 4486
- Gonzalez-Perez et al. (2014) Gonzalez-Perez, V., Lacey, C. G., Baugh, C. M., et al. 2014, MNRAS, 439, 264
- Into & Portinari (2013) Into, T., & Portinari, L. 2013, MNRAS, 430, 2715
- Kannappan & Gawiser (2007) Kannappan, S. J., & Gawiser, E. 2007, ApJ, 657, L5
- Kannappan & Wei (2008) Kannappan, S. J., & Wei, L. H. 2008, in American Institute of Physics Conference Series, Vol. 1035, The Evolution of Galaxies Through the Neutral Hydrogen Window, ed. R. Minchin & E. Momjian, 163–168
- Kannappan et al. (2013) Kannappan, S. J., Stark, D. V., Eckert, K. D., et al. 2013, ApJ, 777, 42
- Kauffmann et al. (2003a) Kauffmann, G., Heckman, T. M., White, S. D. M., et al. 2003a, MNRAS, 341, 33
- Kauffmann et al. (2003b) —. 2003b, MNRAS, 341, 54
- Kennicutt et al. (2003) Kennicutt, Jr., R. C., Armus, L., Bendo, G., et al. 2003, PASP, 115, 928
- Kroupa (2001) Kroupa, P. 2001, MNRAS, 322, 231
- Kuntschner et al. (2002) Kuntschner, H., Ziegler, B. L., Sharples, R. M., Worthey, G., & Fricke, K. J. 2002, A&A, 395, 761
- Kuntschner et al. (2010) Kuntschner, H., Emsellem, E., Bacon, R., et al. 2010, MNRAS, 408, 97
- Leitner & Kravtsov (2011) Leitner, S. N., & Kravtsov, A. V. 2011, ApJ, 734, 48
- Li et al. (2011) Li, I. H., Glazebrook, K., Gilbank, D., et al. 2011, MNRAS, 411, 1869
- Magris C. et al. (2015) Magris C., G., Mateu P., J., Mateu, C., et al. 2015, PASP, 127, 16
- Maraston (2005) Maraston, C. 2005, MNRAS, 362, 799
- McDermid et al. (2015) McDermid, R. M., Alatalo, K., Blitz, L., et al. 2015, MNRAS, 448, 3484
- McGaugh & Schombert (2015) McGaugh, S. S., & Schombert, J. M. 2015, ApJ, 802, 18
- Meidt et al. (2014) Meidt, S. E., Schinnerer, E., van de Ven, G., et al. 2014, ApJ, 788, 144
- Mitchell et al. (2013) Mitchell, P. D., Lacey, C. G., Baugh, C. M., & Cole, S. 2013, MNRAS, 435, 87
- Norris et al. (2015) Norris, M. A., Escudero, C. G., Faifer, F. R., et al. 2015, MNRAS, 451, 3615
- Norris et al. (2014) Norris, M. A., Meidt, S., Van de Ven, G., et al. 2014, ApJ, 797, 55
- Norris et al. (2008) Norris, M. A., Sharples, R. M., Bridges, T., et al. 2008, MNRAS, 385, 40
- Oser et al. (2010) Oser, L., Ostriker, J. P., Naab, T., Johansson, P. H., & Burkert, A. 2010, ApJ, 725, 2312
- Peng et al. (2010) Peng, Y.-j., Lilly, S. J., Kovač, K., et al. 2010, ApJ, 721, 193
- Puzia et al. (2005) Puzia, T. H., Kissler-Patig, M., Thomas, D., et al. 2005, A&A, 439, 997
- Querejeta et al. (2015) Querejeta, M., Meidt, S. E., Schinnerer, E., et al. 2015, ApJS, 219, 5
- Röck et al. (2015) Röck, B., Vazdekis, A., Peletier, R. F., Knapen, J. H., & Falcón-Barroso, J. 2015, MNRAS, 449, 2853
- Salim et al. (2007) Salim, S., Rich, R. M., Charlot, S., et al. 2007, ApJS, 173, 267
- Sánchez et al. (2012) Sánchez, S. F., Kennicutt, R. C., Gil de Paz, A., et al. 2012, A&A, 538, A8
- Schaye et al. (2015) Schaye, J., Crain, R. A., Bower, R. G., et al. 2015, MNRAS, 446, 521
- Schlafly & Finkbeiner (2011) Schlafly, E. F., & Finkbeiner, D. P. 2011, ApJ, 737, 103
- Sheth et al. (2010) Sheth, K., Regan, M., Hinz, J. L., et al. 2010, PASP, 122, 1397
- Smith et al. (2012) Smith, M. W. L., Gomez, H. L., Eales, S. A., et al. 2012, ApJ, 748, 123
- Trager & Somerville (2009) Trager, S. C., & Somerville, R. S. 2009, MNRAS, 395, 608
- Trayford et al. (2015) Trayford, J. W., Theuns, T., Bower, R. G., et al. 2015, MNRAS, 452, 2879
- Wright et al. (2010) Wright, E. L., Eisenhardt, P. R. M., Mainzer, A. K., et al. 2010, AJ, 140, 1868
- Yoachim & Dalcanton (2008) Yoachim, P., & Dalcanton, J. J. 2008, ApJ, 683, 707
- York et al. (2000) York, D. G., Adelman, J., Anderson, Jr., J. E., et al. 2000, AJ, 120, 1579
- Yuan et al. (2013) Yuan, H. B., Liu, X. W., & Xiang, M. S. 2013, MNRAS, 430, 2188
- Zibetti et al. (2009) Zibetti, S., Charlot, S., & Rix, H.-W. 2009, MNRAS, 400, 1181