NuSTAR and XMM–Newton observations of the ultraluminous X-ray source NGC 5643 X-1
Abstract
We present a high-quality hard X-ray spectrum of the ultraluminous X-ray source (ULX) NGC 5643 X-1 measured with NuSTAR in May–June 2014. We have obtained this spectrum by carefully separating the signals from the ULX and from the active nucleus of its host galaxy NGC 5643 located 0.8 arcmin away. Together with long XMM–Newton observations performed in July 2009 and August 2014, the NuSTAR data confidently reveal a high-energy cutoff in the spectrum of NGC 5643 X-1 above keV, which is a characteristic signature of ULXs. The NuSTAR and XMM–Newton data are consistent with the source having a constant luminosity erg s-1 (0.2–12 keV) in all but the latest observation (August 2014) when it brightened to erg s-1. This increase is associated with the dominant, hard spectral component (presumably collimated emission from the inner regions of a supercritical accretion disc), while an additional, soft component (with a temperature keV if described by multicolour disc emission), possibly associated with a massive wind outflowing from the disc, is also evident in the spectrum but does not exhibit significant variability.
keywords:
accretion, accretion discs – galaxies: individual: NGC 5643 – X-rays: binaries – X-rays: individual: NGC 5643 X-1.1 Introduction
Ultraluminous X-ray sources (ULXs) are point-like X-ray sources located in extra-nuclear regions of nearby galaxies with observed X-ray luminosities exceeding the Eddington limit of erg s-1 for black holes. Recently, evidence has been growing, primarily from XMM–Newton high-quality X-ray spectral and timing data (Stobbart, Roberts, & Warwick 2006; Gladstone, Roberts, & Done 2009; Sutton, Roberts, & Middleton 2013; see Feng & Soria 2011; Roberts et al. 2016 for recent reviews), that most ULXs are stellar-remnant black holes (with masses possibly reaching Zampieri & Roberts, 2009; Belczynski et al., 2010) accreting in super-Eddington, or ‘ultraluminous’, regime (Shakura & Sunyaev, 1973; Poutanen et al., 2007).
The salient ULX feature revealed by XMM–Newton observations and witnessing in favor of super-Eddington accretion is a turndown of the X-ray spectrum above –10 keV. However, as XMM–Newton operates at energies below keV, hard X-ray observations of ULXs were highly anticipated to obtain better constraints on their spectra. The first dedicated imaging hard X-ray observations of ULXs, namely M82 X-1 and Ho IX X-1, were performed in 2009–2013 with the IBIS coded-mask instrument aboard INTEGRAL (Sazonov et al., 2014), which, in combination with lower energy XMM–Newton data, clearly revealed a rollover above keV in the spectra of both sources. The advent of the Nuclear Spectroscopic Telescope Array (NuSTAR) (Harrison et al., 2013) has opened a new era of hard X-ray observations of ULXs. Its excellent angular resolution and broad (3–78 keV) energy response made it possible for the first time to obtain a large set of broad-band ULX spectra (Walton et al., 2013a, 2014, 2015a, 2015b; Mukherjee et al., 2015; Rana et al., 2015).
The source NGC 5643 X-1 (hereafter also referred to as X-1) in the nearby Seyfert 2 galaxy NGC 5643 is one of the most luminous known ULXs, with the X-ray luminosity of a few erg s-1. The source was recently observed by Annuar et al. (2015) in hard X-rays with NuSTAR as part of a campaign mainly devoted to local Compton-thick active galactic nuclei. The hard X-ray (above 10 keV) emission from NGC 5643 X-1 was measured for the first time and showed evidence for a high energy spectral cutoff, thus confirming the ULX nature of the source.
The active nucleus of NGC 5643 (hereafter also referred to as the AGN) and X-1 are separated by 52”, which is sufficent to spatially resolve these X-ray sources with NuSTAR, thanks to its 18” FWHM angular resolution. However, a detailed spectral analysis depends on the amount of collected X-ray photons in a given area, which is commonly expressed in terms of a half-power diameter (HPD), enclosing half of the focused X-rays. Due to the wide wings of the NuSTAR PSF, the corresponding HPD reaches (Madsen et al., 2015), which causes partial confusion of the AGN and ULX. Therefore, Annuar et al. (2015) restricted the spectrum extraction areas around both sources to circles of radius. This, however, corresponds to only 30% PSF enclosed counts (Madsen et al., 2015) and thus implies a significant loss in sensitivity. In this work, we utilize the full collecting power of the NuSTAR PSF to extract spatially resolved spectra of the NGC 5643 nucleus and X-1, by applying 2D image fits to NuSTAR images in a number of narrow energy bands. This, together with long XMM–Newton observations of NGC 5643 taken in 2009 and 2014, enables us to obtain high-quality broad-band spectra of X-1.
The paper is organized as follows. In Sect. 2 we describe the analysis of NuSTAR (Sect. 2.1) and XMM–Newton data (Sect. 2.2). Variability and spectral analyses are presented, respectively, in Sect. 3 and 4. The results are discussed and summarized in Sect. 5. Following Annuar et al. (2015), we assume a metric distance to NGC 5643 of Mpc (Sanders et al., 2003) based on the cosmic attractor flow model described in Mould et al. (2000). We assume that X-1 is located in the galaxy NGC 5643.
2 Observations and Data Analysis
| Mission | Date | ObsID | Exp. | Frac.∗ | Flux∗∗ |
|---|---|---|---|---|---|
| (ks) | (%) | ||||
| XMM | 2009-07-25 | 0601420101 | 54.52 | 87 | |
| NuSTAR | 2014-05-24 | 60061362002 | 22.46 | 100 | |
| NuSTAR | 2014-06-30 | 60061362004 | 19.71 | 100 | |
| XMM | 2014-08-27 | 0744050101 | 116.9 | 91 |
∗ Good time fraction; ∗∗NGC 5643 X-1 (3–8 keV) unabsorbed flux in units of erg s-1 cm-2 (see Sect. 3 for details).
NGC 5643 X-1 was first clearly detected in archival ROSAT/HRI observations in 1997 by Guainazzi et al. (2004). These authors analysed XMM–Newton observations of the Seyfert 2 galaxy NGC 5643 taken in 2003 and found an X-ray source located north-east of the nucleus, which was 50 per cent brighter than the AGN. Under the assumption that the source belongs to the NGC 5643 galaxy, its luminosity was estimated at erg s-1, classifying X-1 as an ULX. New, longer XMM–Newton observations were performed in 2009 (Matt et al., 2013) and 2014 (Pintore et al., 2016). The first hard X-ray ( keV) imaging observations of NGC 5643 were carried out with NuSTAR in 2014 by Annuar et al. (2015), who also analysed simultaneous Swift/XRT and archival XMM–Newton and Chandra observations (Bianchi, Guainazzi, & Chiaberge, 2006).
We use the NuSTAR data to constrain the high-energy cutoff in the spectrum of NGC 5643 X-1 and the long XMM–Newton observations of 2009 and 2014 to extend our spectral coverage to lower energies. The dates, exposures and ObsIDs of these observations are listed in Table. 1.
Below we describe the procedures that we used to spatially separate the spectra of the NGC 5643 nucleus and X-1 in the NuSTAR data. We also outline the standard data analysis for XMM–Newton observations.
2.1 NuSTAR
NGC 5643 was observed with NuSTAR in 2014 in two sessions separated by 37 days (Table 1). NuSTAR carries two co-aligned twin X-ray telescopes, with angular resolution of 18” (FWHM) and HPD of , and operates in a wide energy range from 3 to 78 keV. The detector modules of each telescope – the focal plane modules A and B (FPMA and FPMB) – provide spectral resolution of eV (FWHM) at keV.
We processed the data from both modules using the NuSTAR Data Analysis Software (nustardas) v.1.5.1 and heasoft v6.17. The data were filtered for periods of high instrumental background when the spacecraft passed the South Atlantic Anomaly and for known bad/noisy detector pixels.
After running the pipeline, we ended up with event lists for the two NuSTAR observations with a total exposure of 42 ks (Table 1). We performed astrometric correction of the celestial coordinates of each incoming photon using NGC 5643 cataloged position and the centroid position of its AGN core in the NuSTAR images.
| Parameter∗ | NuSTAR observations | ||
|---|---|---|---|
| 60061362002 | 60061362004 | combined | |
| /d.o.f. | 1.15/13 | 0.94/13 | 1.23/13 |
∗The parameter represents the 3–24 keV unabsorbed flux in units of erg s-1 cm-2.
Annuar et al. (2015) pointed out that NGC 5643 X-1 did not show significant variability between the two NuSTAR observations. To independently verify this assertion, we extracted source spectra using 2D image fitting procedures, described below, in order to estimate the variability of NGC 5643 X-1 between the two NuSTAR measurements in 2014. The spectra were approximated by a power-law model modified by Galactic and intrinsic absorption. As the energy response of NuSTAR is not very sensitive for measuring low absorption columns, we fixed the total absorption column at cm-2, which is roughly consistent with the results of the subsequent analysis involving XMM–Newton low-energy data. The best-fit model parameters and derived 3–24 keV fluxes are given in Table 2. We see that within the uncertainties the power-law slopes and inferred fluxes are not significantly different between the two observations and consistent with those measured by Annuar et al. (2015). This justifies combining the two NuSTAR observations in 2014 for the following analysis. We conclude that the available data are consistent with NGC 5643 X-1 being at the same luminosity level during both NuSTAR observations. We further discuss the question of NGC 5643 X-1 variability using XMM–Newton data in Sect. 3 below.
We finally combined the data from both NuSTAR observations and both NuSTAR modules into sky mosaics in 15 energy bands logarithmically covering the NuSTAR energy band of 3–78 keV. The subsequent analysis of NuSTAR data is based on these mosaic images and the broad-band spectra derived from them.
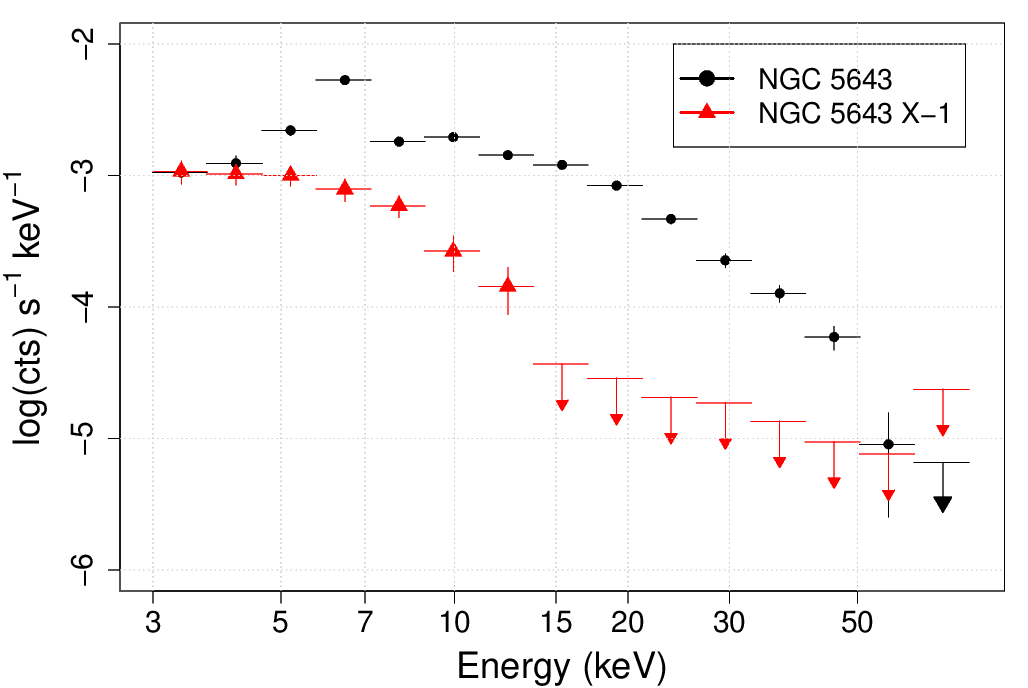
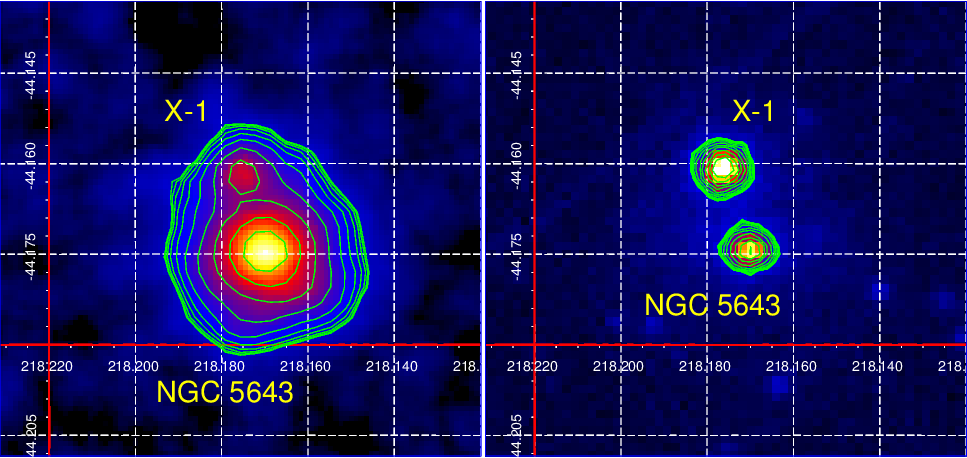
Fig. 1 shows the combined image of NGC 5643 in the 3–78 keV energy band. Partial confusion of the AGN and X-1 is evident. To decouple emission from these two components, we fitted a spatial model convolved with the NuSTAR PSF using the sherpa package (Freeman et al., 2001), which is part of the ciao-4.7 software (Fruscione et al., 2006). The spatial model of the sources is represented by two 2D Gaussians positioned at the NGC 5643 nucleus and X-1 cataloged coordinates. Following a similar analysis in Krivonos et al. (2014), the width of the Gaussians were fixed at FWHM, chosen to emulate the PSF smearing effect. The amplitudes of the 2D Gaussians were free parameters. The NuSTAR background is characterized by a spatial gradient across the field of view, unique to each mirror module (Wik et al., 2014). However, as a result of co-adding of the FPMA and FPMB data and data from the two observations with different spacecraft position angles (), the background spatial pattern has been largely averaged out and can be considered flat. We thus estimated the constant background term at from the AGN. After running the fitting procedure in each of the 15 energy bands, we estimated the flux of both spatial components by sampling model parameter values over a Gaussian distribution with the normal_sample command in sherpa. The count rates and the corresponding errors, estimated from the characteristic values of the distribution (plot_cdf), were combined into PHA files (denoted below with a ’2D’ superscript). Note that the described 2D-fitting gives the model flux (counts) for NuSTAR PSF enclosed energy, since we use a large fitting area () around the NGC 5643 nucleus. To generate the corresponding RMF2D and ARF2D response files, we ran the standard analysis with the nuproducts tool for the AGN within the circle, producing a spectrum and response files for a point-like source. The RMF matrix was used as is for RMF2D. The effective area for the spatially resolved spectra, ARF2D, was estimated by comparing the AGN 2D count rate (phot s-1, stored in PHA2D) and the corresponding count rate per cm2 calculated in xspec with the flux command (phot s-1 cm-2) operated on the model described below. Since the spectrum of the NGC 5643 nucleus reveals typical features of a Compton-thick AGN: a strong 6.4 keV iron line and a Compton reflection continuum above 10 keV, we applied the pexrav model (Magdziarz & Zdziarski, 1995) commonly used for reflection-dominated spectra. The model also includes a primary power-law component with an exponential cutoff at 200 keV and a slope tied to the corresponding pexrav model parameter, and iron K and K emission lines. The spectral modelling of the AGN in NGC 5643 is discussed in detail by Annuar et al. (2015) and Krivonos et al. (2016, in preparation). Note that the ARF2D created in this way is model dependent. We checked that different reflection-dominated models well fitting the spectrum of the NGC 5643 nucleus produce negligible deviations in ARF2D.
The 2D image analysis finally resulted in the spectra of the decoupled AGN and X-1 shown in Fig. 2.
2.2 XMM–Newton
XMM–Newton observations of NGC 5643 in 2009 and 2014 were performed with the EPIC CCD cameras (PN, MOS1 and MOS2), operated in full frame mode with the medium filter. We performed data processing with the sas v1.2 data analysis software, applying time filtering for the particle background.
The data taken in 2009 were affected by soft proton flares known to be the main source of the high particle background for XMM–Newton observations. Pintore et al. (2016) filtered out 78% of the data in 2009 due to background flare contamination. In our analysis, we considered NGC 5643 X-1 a moderately bright X-ray source and assumed that it was not strongly affected by the flares. The point-like shape of the source, in contrast to the extended faint sources, which are more affected by high particle background (Pradas & Kerp, 2005), provides support to this assumption. We applied a moderate time filter (MOS1), (MOS2) and (PN), thus filtering out of the data in 2009. We verified that stronger flare filtering conditions did not significantly affected the resulting spectra of NGC 5643 X-1. Time filters and were applied, respectively, to MOS1, MOS2 and PN data taken in 2014, which contain only one clearly discernible proton flare, filtering out only of the total exposure.
Spectra were extracted using a aperture centred on the AGN and X-1 for all the cameras. Background spectra were extracted within circles located away from the sources, within the same chip. We used patterns 0 to 4 and 0 to 12 for PN and MOS, respectively. The right panel in Fig. 1 demonstrates a PN, MOS1 and MOS2 combined 0.5–8 keV mosaic image constructed from the 2014 data set. NGC 5643 X-1 appeared on a CCD gap of the PN instrument during the observations in 2009. Therefore, to have a uniform data set and avoid dealing with multiple cross-normalization coefficients, we excluded the PN data from the spectral analysis and assumed there were no calibration differences between the MOS1 and MOS2 cameras.
3 Time variability
To check if NGC 5643 X-1 varied over the considered period, we fitted simultaneously the two XMM–Newton (2009 and 2014) and two NuSTAR (May 24 and June 30, 2014) data sets with an absorbed (tbabs) cutoff power-law model, allowing free cross-normalizations between the spectra. This resulted in relatively poor fit statistics, /d.o.f.= 1.13/695, indicating that the spectral model has not fully captured the data () and suggesting that spectral changes of X-1 between the observations are possible. The resulting best-fit model parameters cm-2, and are close to those obtained for the high-quality data set taken in 2014, which likely dominates the fit. The corresponding 3–8 keV flux estimates are listed in Table 1. One can see that X-1 brightened in the latest (August 2014) XMM–Newton observation by a factor of compared to the previous XMM–Newton and NuSTAR observations. This level of variability is typical for this source, as indicated by its long-term light curve presented in Annuar et al. (2015) and Pintore et al. (2016).
4 Spectral modelling
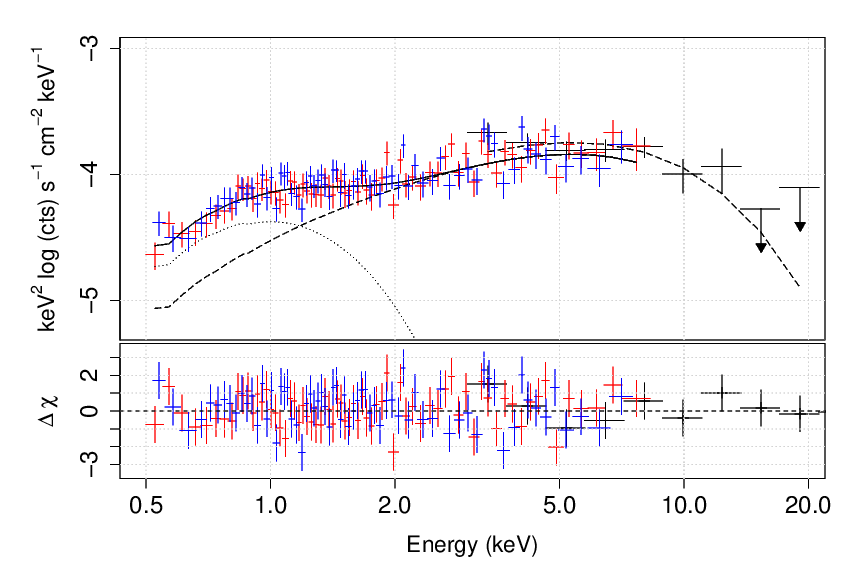
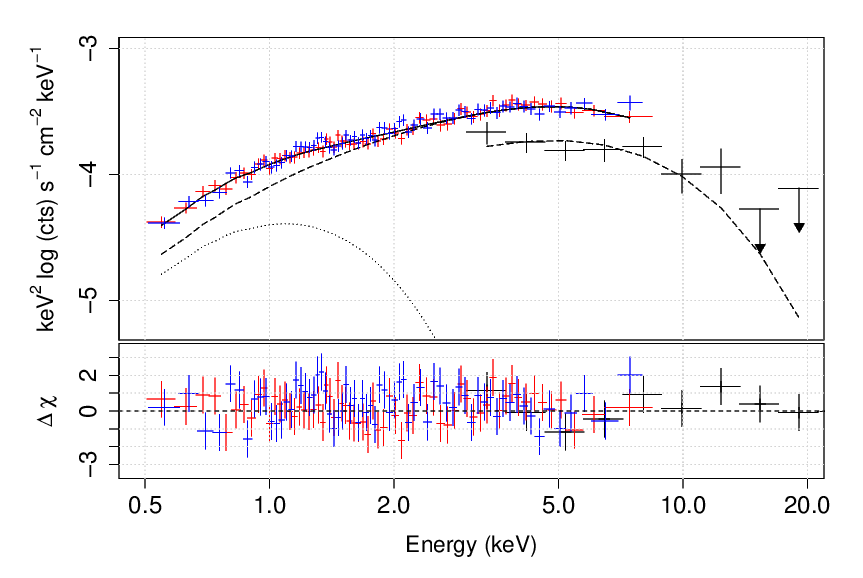
In this section, we describe our X-ray spectral analysis of the XMM–Newton (MOS1 and MOS2) and combined NuSTAR data covering the 0.5–9 keV and 3–78 keV energy bands, respectively. The MOS1 and MOS2 spectra measured in 2009 and 2014 are shown in Fig. 3 together with the NuSTAR data points taken in 2014. Since NGC 5643 X-1 has not been detected above 20 keV, we truncate the plot at this energy for a more detailed view. Note that although we show upper limits for the two highest energy bins, our spectral analysis described below uses the actual measurements. Spectral fitting and flux derivations were done using the xspec package (Arnaud, 1996), photoionization cross sections from Verner et al. (1996) and abundances for the interstellar absorption from Wilms, Allen, & McCray (2000). We used statistics for fitting; all quoted errors are at the confidence level.
As a first step in spectral modelling, we analysed the NuSTAR data for X-1. We started with a simple power-law model modified by line-of-sight absorption. The fitting yielded a photon index of (Table 2), with for 13 degrees of freedom (d.o.f.). This slope measured in the hard X-ray band is thus much steeper than the photon index found in the soft X-ray band (Guainazzi et al., 2004; Matt et al., 2013), suggesting a high-energy downturn or a cutoff.
We then fitted the same absorbed power-law model to the XMM–Newton data taken in two epochs in 2009 and 2014. As mentioned before, the available data do not rule out that NGC 5643 X-1 went through state changes over this period of time. Nevertheless, we combined the high-quality XMM–Newton observations with non-simultaneous but unique NuSTAR data to better constrain the high-energy part of the spectra where a cutoff is expected. An intrinsic absorption in the host galaxy was added to the fixed Galactic absorption column density ( cm-2, Kalberla et al., 2005) using two tbabs components. For the broad-band spectra, we also added a cross-normalization constant between the XMM–Newton and NuSTAR data, fixing the latter to unity. The measured best-fit model parameters are shown in Table 3. The fits are marginally acceptable.
| Parameter∗ | Unit | XMM | XMM+NuSTAR | ||
| 0601420101 | 0744050101 | 0601420101 | 0744050101 | ||
| Epoch 1 | Epoch 2 | Epoch 1 | Epoch 2 | ||
| Model = TBABSTBABSCONSTPOWERLAW | |||||
| cm-2 | |||||
| – | – | ||||
| /d.o.f. | 1.11/135 | 1.02/506 | 1.40/149 | 1.12/520 | |
| Model = TBABSTBABSCONSTCUTOFFPL | |||||
| cm-2 | |||||
| keV | |||||
| – | – | ||||
| /d.o.f. | 1.12/134 | 0.94/505 | 1.20/148 | 0.93/519 | |
| Model = TBABSTBABSCONST(DISKBB+CUTOFFPL) | |||||
| cm-2 | |||||
| keV | |||||
| keV | |||||
| – | – | ||||
| erg s-1 | – | – | |||
| erg s-1 | 2.34 | – | – | ||
| /d.o.f. | 1.04/132 | 0.92/503 | 0.98/146 | 0.90/517 | |
| Model = TBABSTBABSCONST(DISKBB+COMPST) | |||||
| cm-2 | |||||
| keV | |||||
| keV | |||||
| – | – | ||||
| erg s-1 | – | – | |||
| erg s-1 | 2.80 | – | – | ||
| /d.o.f. | 1.05/132 | 0.92/504 | 1.02/146 | 0.92/517 | |
| Model = TBABSTBABSCONST(DISKBB+DISKPBB) | |||||
| cm-2 | |||||
| keV | |||||
| keV | |||||
| – | – | ||||
| erg s-1 | – | – | |||
| erg s-1 | – | – | |||
| /d.o.f. | 1.04/132 | 0.92/503 | 0.98/146 | 0.90/517 | |
∗The model parameters for the power-law, power-law with an exponential cutoff (cutoffpl), multi-temperature blackbody accretion disk (diskbb), a Comptonization spectrum (compST), and multi-temperature disk blackbody with power-law dependence of temperature on radius (diskpbb), are shown with , , , , and , respectively.
As mentioned above, the hard X-ray data indicate the presence of a high-energy cutoff (see also Annuar et al. 2015). We thus next fitted an absorbed cutoff power-law model (cutoffpl in xspec). This led to a significant improvement in the fit statistics and allowed us to constrain the cutoff energy for the combined XMM–Newton and NuSTAR spectra at keV and keV for the first and second epochs, respectively. The former value agrees with and significantly improves upon the keV constrain obtained by Annuar et al. (2015) using the same 2009 XMM–Newton and 2014 NuSTAR data sets. Regarding the second epoch, is consistent with Pintore et al. (2016) result based on XMM–Newton only data taken in 2014, which is also seen in Table 3. Here, the NuSTAR data further narrow the allowed range for the cutoff energy. The and parameters measured for the two epochs using a combination of XMM–Newton and NuSTAR data are marginaly consistent with each other and suggest a change in the spectral state of X-1.
ULX spectra are often described with a sum of two spectral components: hard X-ray emission, presumably emergent from the inner regions of a supercritical accretion disc, and soft X-ray emission, often attributed to a thick outflowing wind. We thus next fitted a two-component, diskbb plus power-law, model (with absorption), but only to the XMM–Newton data. The best-fit parameters are listed in Table 4. This was primarily done to determine which type NGC 5643 X-1 might belong to in the ULX classification scheme introduced by Sutton, Roberts, & Middleton (2013) (see Sect. 5 below). The inner disc temperature of the diskbb component in the 2014 data was not constrained by the fit, and so we fixed it at 0.3 keV to be consistent with the following spectral analysis. The inferred power-law photon index (both in 2009 and in 2014) and low multicolour-disc temperature keV (reliably measured in the 2009 XMM–Newton observation) put NGC 5643 X-1 into the class of hard ultraluminous ULX states.
| Parameter | Unit | XMM | |
|---|---|---|---|
| 0601420101 | 0744050101 | ||
| Epoch 1 | Epoch 2 | ||
| cm-2 | |||
| keV | 0.3 (fixed) | ||
| erg s-1 cm-2 | |||
| erg s-1 cm-2 | |||
| /d.o.f. | 1.04/133 | 1.02/505 | |
We then replaced the power law for the hard component by a high-energy cutoff power-law model and applied the resulting diskbb plus cutoffpl model to the XMM–Newton and combined XMM–Newton and NuSTAR data. This significantly improved the fit statistics for the first epoch, both for the XMM–Newton data alone and for the combined XMM–Newton and NuSTAR data, with respect to single power-law and cutoffpl models (Table 3), which suggests a two-component structure of the ULX spectrum. Note that Pintore et al. (2016) could fit the X-1 spectrum well with just one broad component, analyzing the same XMM–Newton data set taken in 2009. We determined the statistical significance of the soft diskbb component using the xspec script simftest with trials, and found that the null hypothesis, i.e. no soft component, can be rejected at a significance level, which corresponds to a detection of the soft component, assuming a normal distribution. We can speculate that the non-detection of the soft component by Pintore et al. (2016) might have been mainly caused by their too strong data filtering (see Sect. 2.2). The spectrum of the second epoch is dominated by the hard component, and the addition of a soft multicolour-disc component provides only a marginal improvement (as also mentioned by Pintore et al. 2016). The corresponding significance of the soft component estimated as described above is .
We conclude that the diskbb plus cutoffpl phenomenological model constrains well both the diskbb temperature and the shape of the hard component, and implies a low keV, hard photon index and relatively low –6 keV. Note that NuSTAR data have low sensitivity to the soft component due to the energy response starting at 3 keV. Hence, we do not provide estimates of the luminosities of the spectral components in the 0.2–12 keV band in Table 3 for joint XMM–Newton and NuSTAR data, as we do for XMM–Newton data alone.
Power-law spectra with a high-energy cutoff can be explained as Comptonization of soft radiation by hot electrons. We thus next tried to describe the hard component with the compst model for Comptonized radiation from a cloud of hot gas (Sunyaev & Titarchuk, 1980). The resulting gas temperature is keV and the Thompson optical depth of the cloud is 20, similar to findings for other ULXs (e.g. Sazonov et al. 2014; Kobayashi, Nakazawa, & Makishima 2016). In all other respects, this model is almost indistinguishable from the previous, diskbb plus cutoffpl, model.
We finally fitted the XMM–Newton and NuSTAR spectra with the multicolour blackbody accretion disc model diskpbb with a variable temperature disc profile (Mineshige et al., 1994), in combination with a soft diskbb component. The fit statistics are similar to those obtained for the preceeding two models. The inferred radial temperature profile parameter is smaller than expected for a thin disc (, Shakura & Sunyaev, 1973), which is consistent with a radiation dominated accretion disc.
5 Discussion and summary
The two long XMM–Newton observations of NGC 5643 X-1 taken in 2009 and 2014 allow us to compare its spectral states in two epochs separated by five years. The NuSTAR data taken 3 and 2 months before the later XMM–Newton observation, and analysed here paying special attention to the separation of the contributions of the ULX and the nearby active nucleus of NGC 5643, provide a more stringent constraint on the high-energy cutoff and further information on the luminosity state of the source.
Our analysis of the XMM–Newton and NuSTAR data has demonstrated that the spectrum of NGC 5643 X-1 contains two components: i) a dominant hard one, which can be empirically described as a power law with photon index and a cutoff at –6 keV (fitting the XMM–Newton data by a simple power-law model yields ), and ii) a soft one, characterized by temperature keV if described in terms of multicolour disc emission. These spectral parameters suggest that NGC 5643 X-1 was in the hard luminous ULX state during these observations, according to the Sutton, Roberts, & Middleton (2013) empirical classification scheme ( keV, ).
Pintore et al. (2016) recently carried out a spectral and temporal analysis of all the available XMM–Newton observations of NGC 5643 X-1 and suggested that its spectrum could be well modelled by a single broad, thermal-like component, such as an advection dominated disc or an optically thick Comptonizing corona. In their analysis, the diskpbb model fitted the data better than a combination of a soft diskbb and power-law components, suggesting that the source might belong to the broadened disc class rather than the hard luminous class in the empirical ULX scheme of Sutton, Roberts, & Middleton (2013). Nevertheless, Pintore et al. (2016) favoured association of NGC 5643 X-1 with the latter class given the high X-ray luminosity of the source, and in fact demonstrated that a sum of a hard Comptonization component and a soft diskbb component led to a somewhat better fit compared to a single broadened disc model. These conclusions were mostly based on the 2014 XMM–Newton data set, for which we obtain very similar results, i.e. the soft diskbb component is only marginally detected in these data. However, according to our new analysis, the XMM–Newton data clearly reveal the presence of an additional, soft keV thermal-like component in the 2009 data set, which was only briefly discussed by Pintore et al. (2016) since they had filtered out the bulk of the XMM–Newton data for that observation.
The 0.2–12 keV luminosity of the source nearly doubled in the second XMM–Newton observation compared to the first one, from to erg s-1. However, this change in luminosity apparently reflects NGC 5643 X-1 variability on a time-scale of weeks rather than years, since both NuSTAR observations took place within three months before the XMM–Newton observation in August 2014 and found the source at the same (low) luminosity level as in the XMM–Newton observation taken in 2009. Most if not all of this variability can be attributed to the hard spectral component. The luminosity of the soft component is consistent with being constant but the data permit it to have varied by a factor of between the observations. We have not detected any significant changes in the shape of either spectral component.
Similar to other ULXs with high-quality data, the observed two-component spectrum of NGC 5643 X-1 can be interpreted in terms of supercritical accretion on to a stellar-mass black hole in a binary system. In this scenario (Shakura & Sunyaev, 1973; Poutanen et al., 2007; Middleton et al., 2015), previously discussed in application to NGC 5643 X-1 by Pintore et al. (2016), the hard component is emission from the hot, inner regions of a thick accretion disc observed nearly face-on, collimated by reflections off the walls of its central funnel, while the soft component is photons diffusing out from a massive wind outflowing from the accretion disc, which is possibly somewhat collimated too (King, 2009). If so, the two-fold increase in the hard X-ray luminosity of NGC 5643 X-1 observed by XMM–Newton in August 2014, as compared to the previous XMM–Newton and NuSTAR observations, may be primarily the result of an increased beaming (i.e. decreased opening angle of the funnel) caused by a moderate increase in the accretion rate on to the black hole.
Acknowledgments
This work has made use of data from the NuSTAR mission, a project led by the California Institute of Technology, managed by the Jet Propulsion Laboratory and funded by the National Aeronautics and Space Administration, and reobservations obtained with XMM-Newton, an ESA science mission with instruments and contributions directly funded by ESA Member States and NASA. The research has made use of the NuSTAR Data Analysis Software (nustardas) jointly developed by the ASI Science Data Center (ASDC, Italy) and the California Institute of Technology (USA). The work was supported by the Russian Science Foundation (grant 14-12-01315).
References
- Annuar et al. (2015) Annuar A., et al., 2015, ApJ, 815, 36
- Arnaud (1996) Arnaud K. A., 1996, ASPC, 101, 17
- Belczynski et al. (2010) Belczynski K., Bulik T., Fryer C. L., Ruiter A., Valsecchi F., Vink J. S., Hurley J. R., 2010, ApJ, 714, 1217
- Bianchi, Guainazzi, & Chiaberge (2006) Bianchi S., Guainazzi M., Chiaberge M., 2006, A&A, 448, 499
- Feng & Soria (2011) Feng H., Soria R., 2011, NewAR, 55, 166
- Freeman et al. (2001) Freeman, P., Doe, S., & Siemiginowska, A. 2001, Proc. SPIE, 4477, 76
- Fruscione et al. (2006) Fruscione, A., McDowell, J. C., Allen, G. E., et al. 2006, Proc. SPIE, 6270,
- Gladstone, Roberts, & Done (2009) Gladstone J. C., Roberts T. P., Done C., 2009, MNRAS, 397, 1836
- Guainazzi et al. (2004) Guainazzi M., Rodriguez-Pascual P., Fabian A. C., Iwasawa K., Matt G., 2004, MNRAS, 355, 297
- Harrison et al. (2013) Harrison, F. A., Craig, W. W., Christensen, F. E., et al. 2013, ApJ, 770, 103
- Kalberla et al. (2005) Kalberla P. M. W., Burton W. B., Hartmann D., Arnal E. M., Bajaja E., Morras R., Pöppel W. G. L., 2005, A&A, 440, 775
- King (2009) King A. R., 2009, MNRAS, 393, L41
- Kobayashi, Nakazawa, & Makishima (2016) Kobayashi S., Nakazawa K., Makishima K., 2016, AN, 337, 479
- Krivonos et al. (2014) Krivonos R. A., et al., 2014, ApJ, 781, 107
- Madsen et al. (2015) Madsen, K. K., Harrison, F. A., Markwardt, C. B., et al. 2015, ApJS, 220, 8
- Magdziarz & Zdziarski (1995) Magdziarz P., Zdziarski A. A., 1995, MNRAS, 273, 837
- Matt et al. (2013) Matt G., Bianchi S., Marinucci A., Guainazzi M., Iwawasa K., Jimenez Bailon E., 2013, A&A, 556, A91
- Middleton et al. (2015) Middleton M. J., Heil L., Pintore F., Walton D. J., Roberts T. P., 2015, MNRAS, 447, 3243
- Mineshige et al. (1994) Mineshige S., Hirano A., Kitamoto S., Yamada T. T., Fukue J., 1994, ApJ, 426, 308
- Mould et al. (2000) Mould J. R., et al., 2000, ApJ, 529, 786
- Mukherjee et al. (2015) Mukherjee, E. S., Walton, D. J., Bachetti, M., et al. 2015, ApJ, 808, 64
- Pintore et al. (2016) Pintore F., Zampieri L., Sutton A. D., Roberts T. P., Middleton M. J., Gladstone J. C., 2016, MNRAS, 459, 455
- Poutanen et al. (2007) Poutanen J., Lipunova G., Fabrika S., Butkevich A. G., Abolmasov P., 2007, MNRAS, 377, 1187
- Pradas & Kerp (2005) Pradas J., Kerp J., 2005, A&A, 443, 721
- Rana et al. (2015) Rana V., et al., 2015, ApJ, 799, 121
- Roberts et al. (2016) Roberts T. P., Middleton M. J., Sutton A. D., Mezcua M., Walton D. J., Heil L. M., 2016, AN, 337, 534
- Sanders et al. (2003) Sanders D. B., Mazzarella J. M., Kim D.-C., Surace J. A., Soifer B. T., 2003, AJ, 126, 1607
- Sazonov et al. (2014) Sazonov, S. Y., Lutovinov, A. A., & Krivonos, R. A. 2014, Astronomy Letters, 40, 65
- Shakura & Sunyaev (1973) Shakura N. I., Sunyaev R. A., 1973, A&A, 24, 337
- Sunyaev & Titarchuk (1980) Sunyaev R. A., Titarchuk L. G., 1980, A&A, 86, 121
- Stobbart, Roberts, & Warwick (2006) Stobbart A.-M., Roberts T. P., Warwick R. S., 2006, MNRAS, 370, 25
- Sutton, Roberts, & Middleton (2013) Sutton A. D., Roberts T. P., Middleton M. J., 2013, MNRAS, 435, 1758
- Verner et al. (1996) Verner D. A., Ferland G. J., Korista K. T., Yakovlev D. G., 1996, ApJ, 465, 487
- Walton et al. (2013a) Walton D. J., et al., 2013a, ApJ, 779, 148
- Walton et al. (2014) Walton D. J., et al., 2014, ApJ, 793, 21
- Walton et al. (2015a) Walton D. J., et al., 2015a, ApJ, 799, 122
- Walton et al. (2015b) Walton D. J., et al., 2015b, ApJ, 806, 65
- Wilms, Allen, & McCray (2000) Wilms J., Allen A., McCray R., 2000, ApJ, 542, 914
- Wik et al. (2014) Wik D. R., et al., 2014, ApJ, 792, 48
- Zampieri & Roberts (2009) Zampieri L., Roberts T. P., 2009, MNRAS, 400, 677