The specific shapes of gender imbalance in scientific authorships: a network approach
Abstract
Gender differences in collaborative research have received little attention when compared with the growing importance that women hold in academia and research. Unsurprisingly, most of bibliometric databases have a strong lack of directly available information by gender. Although empirical-based network approaches are often used in the study of research collaboration, the studies about the influence of gender dissimilarities on the resulting topological outcomes are still scarce. Here, networks of scientific subjects are used to characterize patterns that might be associated to five categories of authorships which were built based on gender. We find enough evidence that gender imbalance in scientific authorships brings a peculiar trait to the networks induced from papers published in Web of Science (WoS) indexed journals of Economics over the period 2010-2015 and having at least one author affiliated to a Portuguese institution. Our results show the emergence of a specific pattern when the network of co-occurring subjects is induced from a set of papers exclusively authored by men. Such a male-exclusive authorship condition is found to be the solely responsible for the emergence that particular shape in the network structure. This peculiar trait might facilitate future network analyses of research collaboration and interdisciplinarity.
Keywords: co-occurrence networks, gender, research collaboration, interdisciplinarity, bibliometrics, minimum spanning tree
1 Introduction
The handiness of powerful computational instruments and recent improvements in multidisciplinary methods are providing researchers an ever-greater opportunity to investigate societies in their complex nature [1]. Several research outcomes have been showing that men and women differ in characteristics that could be related to their collaboration patterns. Research collaboration is increasing in frequency and scope. It is driven, among other causes, by growing relationship across scientific disciplines, improvement of the efficiency in research resources in projects and development of information and communication technologies [2]. The motivations [3], strategies, patterns and impacts on scientific productivity in quantity and quality in research collaboration have received great scholarly attention ([4];[5];[6]). The patterns vary across space ([7];[8]), academic ranks [9], professional origins [10] and scientific disciplines [11].
Economic science makes connections with many other scientific disciplines, like Statistics or Social Sciences, like Sociology, History or Management ([12];[13]). Economics shows a growing increase of co-authorship ([5];[14];[15]). On average, a researcher in Economics had less than one co-author in the 1970s, 1.24 co-authors in the 1980s and 1.67 in 1990s ([16];[11]).
Gender differences in collaborative research concerning motivations, strategies, patterns and impacts on science performance have received little attention, contrasting with the growing importance that women hold in academia and research. The literature shows mixed results about the gender differences concerning research collaboration strategies [15], impacts ([15];[2];[17]-[21]) and patterns ([22]-[31]).
Bibliometric studies and survey analysis are the main methodologies to the study of research collaboration [32]. Large bibliometric databases like Web of Science ([33];[34];[35]) are the main sources used to bibliometric analysis. However, that bibliometric databases have a strong weakness concerning the study of the differences by gender; they do not include information separated by male-female and the way to overcame that weakness is to obtain the information from the first name [36] or the family name of the author [27].
The present paper seeks to build upon the previous analysis about gender aspects in research collaboration which literature was recently surveyed in [22]. Here, we intend to contribute to at least two points of the literature: the differences of research collaboration and interdisciplinary participation by gender. Focusing in Economics, a scientific subject strongly connected to other scientific domains [13] and constructing five categories of articles in a gender authorship perspective, this study addresses both issues: research collaboration and interdisciplinarity.
Applying a network approach and using as unit of analysis articles indexed in the Web of Science (WoS) this analysis maps the research collaboration by gender within dozen of scientific subjects, all associated with Economics. The choice of network approaches to study research collaboration in economics [12] has been extensively embraced. It often relies on the discovery of patterns of collaborations within researcher communities, aiming to find the influence of individual researchers in the networks using citation analysis. Reference [10], in the first complete theory of scientific collaboration, list and discuss the causes for that collaboration. They stress that it is necessary, when scientists deal with research questions, that cross disciplinary bounds. They also identify a large variation in collaboration by discipline, which is being further investigated in more recently published studies ([22];[25]).
Its well known that the adoption of a network approach allows the modeling of social structures from a bottom-up perspective, as resulting from the interaction (or likeness) of individual characteristics [1]. Moreover, as the individual characterization might be driven by multiple aggregate concerns, the network approaches allow for simultaneously considering that multiplicity of individual aspects and the consequences of the aggregate structures themselves on the emergence of collective patterns. Meanwhile, in the adoption of a network approach, one shall be aware that the choice of a given network representation is only one out of several other ways to look at a given set of elements. As connecting the elementary units of a system may be conceived in many different ways, that choice may depend strongly on the available empirical data and on the questions that a network analysis aims to address [37].
The main question addressed in this paper is whether some relevant characteristics of research collaboration would emerge in networks where subjects are linked whenever they co-occur in a common paper. We hypothesized that gender imbalance in authorship of papers might influence the shape of those networks, allowing to uncover patterns from gender differences. If it happens, the emerging patterns may help to understand important characteristics of research collaboration, of the relationship among subjects and its relation to gender.
The paper is organized as follows: next section presents the empirical data we work with and some preliminary statistical results. Section 3 describes the network approach and the results from its application. Section 4 concludes.
2
The Data
The Web of Science (WoS) is one of the major bibliometric databases (together with Google Scholar and Scopus) and includes all scientific subjects. It comprises a total of 11,990 Journals (8,778 from Science and 3,212 from Social Sciences) [34]. Concerning the scientific domain of Economics, it includes 334 Publications111In Journal of Citation Report 2016 the number of journals is 344.. The WoS classifies each journal in one or more subjects (or categories).
Taking as examples the journals Journal of Informetrics and Research Policy, the former is classified in ”Computer Science, Interdisciplinary Applications” and ”Information Science & Library Science”, while the latter is classified in ”Management” and ”Planning & Development”.
From the original WoS database a selection of articles was carried on adopting as criteria: articles published in WoS indexed journals over the period 2010-2015, having Economics as scientific subject and at least one author affiliated to a Portuguese institution.
Our motivation to focus on the field of Economics and on the papers whose authors are affiliated to Portuguese institutions is twofold:
-
1.
Economic science makes connections with many other scientific subjects.
-
2.
According OECD data, Portugal presents the highest percentage of women in research during the period of 2004-2012 (OECD, 2016).
Consequently, our approach is applied to a data set comprising 1,138 papers published in 2010, 2011, 2012, 2013, 2014 and 2015 and having Economics as the main subject matter.
Besides Economics, each paper may have extra (or secondary) subjects. Table 1 presents the set of secondary (extra) subjects found in our data set. Each paper in the data set is coded by a string that informs about the presence of extra subjects. In the broader set of 1,138 papers having Economics as the main subject matter, 29 different extra (or secondary) subjects were found.
| Subject | Subject |
|---|---|
| 1 Agricultural Economics | 2 Area Studies |
| 3 Business | 4 Cultural Studies |
| 5 Environmental Science | 6 Education |
| 7 Ecology | 8 Finance |
| 9 Geography | 10 Health Policy |
| 11 History Of S.Sciences | 12 Hospitality |
| 13 Industrial Rel. & Labor | 14 Interdisciplinary St. |
| 15 International Relations | 16 Leisure, Sport & Tourism |
| 17 Management | 18 Mathematics |
| 19 Occupational Health | 20 Operations Research |
| 21 Planning & Development | 22 Political Science |
| 23 Science & Technology | 24 Social Sciences |
| 25 Sociology | 26 Statistics & Probability |
| 27 Transportation | 28 Urban Studies |
| 29 Engeeniring |
Table 1: Secondary (or extra) subjects besides Economics.
The structure presented in Table 2 exemplifies the way we represent the presence (and thus the co-occurrence) of subjects in each paper, it also shows the way we organize information on gender authorship 222The gender of the authors was identified by the first given name, because in Portuguese, the first given name defines the gender without any ambiguity. When the authors did not have Portuguese given names, the identification was made by visiting the institutional web pages of each of the authors..
| id | #w | #m | 1 | 2 | 3 | 4 | 5 |
| 0001 | 0 | 2 | 3 | 29 | 0 | 0 | 0 |
| 0002 | 1 | 0 | 1 | 0 | 0 | 0 | 0 |
| … | .. | .. | .. | .. | .. | .. | .. |
| 1,138 | 2 | 3 | 0 | 0 | 0 | 0 | 0 |
Table 2: Exemplifying the representation of papers in the data set ().
There, three papers are represented: the column conveys the paper identification, the column stores the number of female authors, the column provides the number of male authors and the columns labeled store the presence of extra subjects.
The examples in Table 2 inform that paper has two male authors and Business(3) and Engineering(29) as secondary (and co-occurring) subjects. It also informs that paper has just one female author and Agricultural Economics(1) as its single secondary subject. The paper has five authors: two female and three male authors and no extra subject.
As we aim to address interdisciplinarity issues, from the whole set of 1,138 papers we select those the have at least one extra subject. They are 535 papers whose subjects are assemble in the set The superscript 0 identifies the subset of that comprises all papers with at least one secondary subject. The first subscript () indicates the size of this data set while the second subscript () stands for the position of the extra subject in paper with . There, each cell informs whether paper has subject ( ) with . Later in the paper, the set is used to construct the topological representation of the 29 subjects co-occurring with Economics in scientific publications.
2.1 Authorship Categories
Besides the subject concerns and depending on the authorship characteristics, each paper belongs to at least one of the following (not mutually exclusive) categories. The definition of the five categories of authorship based on gender settles the basis for the identification of patterns of research collaboration and their relation to gender. The following list of categories is ranked in descending order of average percentage of female authors per article: 100, 51, 42, 20 and 0, respectively. The set papers belonging to the authorship categories are labeled and , respectively.
-
1.
:all authors are women (W.Exc)
-
2.
:authors include at least one woman (W.Inc)
-
3.
:authors include both women and men (W&M)
-
4.
:authors include at least one man (M.Inc)
-
5.
:all authors are men (M.Exc)
Considering the articles in each category, some statistical values are computed:
-
•
the number of articles (Size)
-
•
the average number of authors per article (Author)
-
•
the average percentage of female authors per article (% female)
-
•
the number of articles with a single author (#Single)
-
•
the average number of subjects by article (Subject)
-
•
the number of articles with at least one extra subject (XSubject)
2.2 Overview of the data set
Table 3 shows the overall statistics for the 1,138 papers from 2010 to 2015 in Economics, according to the five authorship categories above presented. While the columns correspond to the authorship categories, the rows in Table 3 provide the values obtained for the statistical indicators above described.
| Authorship | All | W.Exc | W.Inc | W&M | M.Inc | M.Exc |
| Category | 0 | 1 | 2 | 3 | 4 | 5 |
| Size | 1,138 | 105 | 525 | 252 | 1,033 | 316 |
| Author | 2.4 | 1.8 | 2.7 | 3 | 2.5 | 2.1 |
| female | 25 | 100 | 51 | 42 | 20 | 0 |
| Single | 210 | 46 | 164 | |||
| Subject | 2 | 1.75 | 1.9 | 1 | 2 | 2.1 |
| XSubject | 535 | 57 | 266 | 209 | 478 | 269 |
Table 3: Overall Statistics for 2010-2015 papers in Economics.
The results in Table 3 seem to contradict the hypothesis that women have more propensity to interdisciplinary research collaboration, because the category man exclusive (M.Exc) is the one which has the higher average number of subjects. The average number of authors is higher in the mixed category W&M but the woman inclusive (W.Inc) is the category with second highest number of authors (the size of co-authorship). These results apparently converge to the hypothesis that women prefer to work in teams. However, this hypothesis is not confirmed by the average number of authors of the papers in the woman exclusive category (W.Exc), being the smallest value in the Author row, it indicates that when papers are exclusively authored by women, the working teams tend to be smaller than any of those that also include men. Looking at the number of papers authored by a single individual (210 papers), 22% and 78% are the respective percentages of female and male authorships. A similar proportionality characterizes the percentages of woman exclusive and man exclusive authorships (W.Exc and M.Exc) in the total amount of papers in these two exclusive categories, they are 25% (105 papers) and 75% (316 papers), respectively.
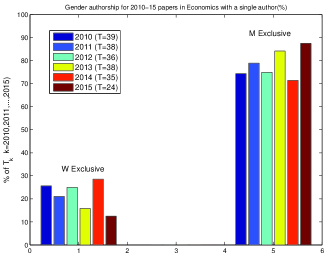
Figures 1 and 2 show the dynamic of the five categories of authorship across time (2010-2015). Figure 1 displays the distributions of the number of papers in each authorship category. The plots in Figures 2 show the distributions of the papers in Economics with at least one secondary subject and the distribution of the papers in Economics with a single author.
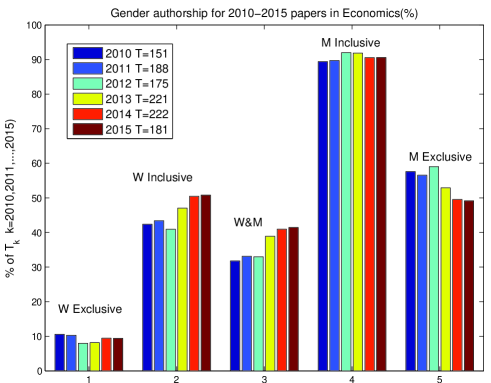
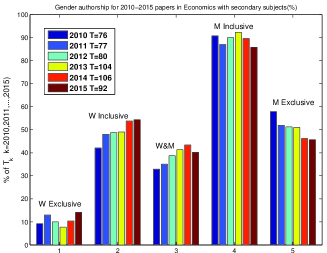
The distributions in Figures 1 and 2 are quite similar meaning that constraining our sample to the papers with at least one extra subject does not introduce any bias, the only (and unimportant) exception regards the man inclusive category (M.Inc) in the first two years. The same would apply to the distributions presented in Figure 2 if the year of 2014 was excluded. In 2014 the proportions of gender-based single authorship shows a different balance between male and female authorships (moving from 32% and 5% to 25% and 10%, respectively). As presented in the last rows of Table 3, the set of papers presenting a least one extra subject comprise 535 papers and the average number of extra subjects by paper in this set is 2.
In general, the Figure 1 and Figure 2(a) reveal that there is an increasing trend in the number of published articles across time, in all co-authorship categories. However, there is a decrease from 2014 to 2015 with one single exception: the papers in Economics with a secondary subject exclusively authored by women (W.Exc).
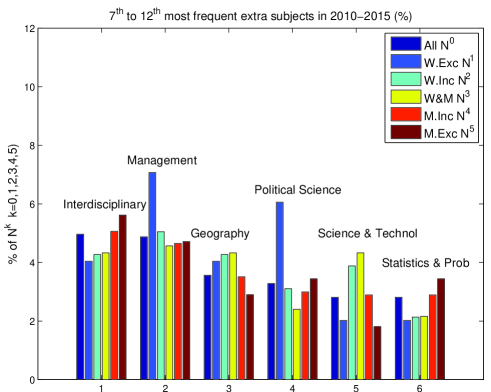
Figures 3 shows the distributions of the relative frequencies (%) of the six most frequent extra subjects in each authorship category. Figure 4 shows the distributions of the relative frequencies (%) of the 7th to the 12th most frequent extra subjects in each authorship category.
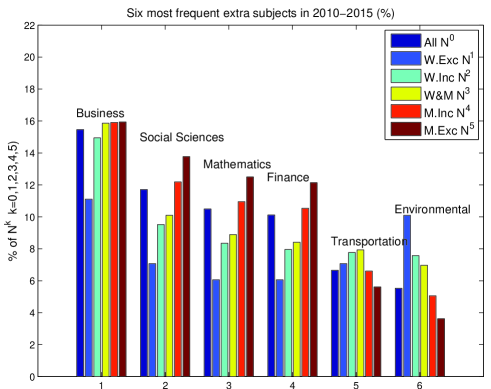
These distributions show that the exclusive categories W.Exc (dark blue) and M.Exc (red) display the greater fluctuations along the different subjects. These fluctuations increase from the 5th most frequent subject (Transportation) until the 10th (Political Sciences). The larger imbalance between the relative frequencies of the exclusive categories W.Exc and M.Exc relies on the subjects Environmental Sciences, Management and Political Sciences. When compared with the high homogeneous distribution that characterizes Business, the relative frequencies of Environmental Sciences, Management and Political Sciences increase in the woman exclusive category (W.Exc) in the same proportion they decrease in the man exclusive (M.Exc) one. These very first results indicate that the subjects Environmental Sciences, Management and Political Sciences are more likely to co-occur in female-dominated papers in Economics.
In summary, when considering papers published in WoS indexed journals over the period 2010-2015 in the scientific domain of Economics and whose authors are affiliated to a Portuguese institution, our results suggest that:
-
1.
men have more propensity to interdisciplinary research collaboration, since the man exclusive category ( has the highest average number of subjects
-
2.
the woman inclusive (W.Inc) is the category with the second highest average number of authors. These results apparently converge to the hypothesis that women prefer to work in teams but
-
3.
when papers are exclusively authored by women (W.Exc), the working teams tend to be smaller than any of those that also include men
-
4.
academic women compared with their male counterparts reveal preference for the subjects Environmental Sciences, Management and Political Sciences
-
5.
conversely, the subjects Social Sciences, Mathematics and Finance display higher frequencies in papers either inclusively (M.Inc) or exclusively authored by men (M.Exc)
In the next section, a network approach is applied to combine the gender authorship perspective with the analysis of interdisciplinarity. To this end, the categories of articles are used to construct the topological representation of the 29 subjects (Table 1) co-occurring with Economics in scientific publications.
3 Network Induction
Network induction makes reference to the method by which networks are created on the basis of a certain data set or system. As earlier mentioned, network approaches are quite common in the analysis of systems where a network representation is the most intuitive. As connecting the elementary units of a system may be conceived in many different ways, that choice may depend strongly on the available empirical data and on the questions that a network analysis aims to address. Here, six bipartite networks are induced from the subsets of papers defined by the authorship categories presented in Section 2.1.
The frequency of co-occurrence of each pair of subjects defines the existence of every link in the networks by authorship category. They are weighted graphs since the weight of each link corresponds to the frequency of co-occurrence of the linked pair of subjects. In the next section, those weighted networks are further analyzed through the construction of their corresponding minimal spanning trees (MST). In so doing, we are able to emphasize the main topological patterns that emerge from each network representation and to discuss their interpretation and relation to gender.
3.1 Bipartite Graphs
A bipartite network consists of two partitions of nodes and , such that edges connect nodes from different partitions, but never those in the same partition. A one-mode projection of such a bipartite network onto is a network consisting of the nodes in ; two nodes and are connected in the one-mode projection, if and only if there exist a node such that and are edges in the corresponding bipartite network (). In the following, we explore six bipartite networks and their corresponding one-mode projections.
3.2 Connecting subjects
Each bipartite network by authorship category consists of the following partitions:
-
•
the set of 29 subjects presented in Table 1 and
-
•
one set of papers () by authorship category () presented in Section 2.1.
In the each network (), two subjects are linked if and only if they co-occur in at least one paper of , having each paper at most five subjects. Therefore, the links in each network are weighted by the number of coincident papers a pair of subjects share in . Consequently, every link in takes value in the set { 0,1,2,…, size()}.
As an example and considering that in (the authorship category comprising all papers with at least one secondary subject) there are just three papers where the subjects Agricultural Economics and Finance co-occur yields . Another example is due to the mutual single co-occurrence of Agricultural Economics and Business in . Among the many examples of missing links there are the cases of and Education and Finance() since these two subject do not co-occur in any paper of .
Having induced the networks () for each authorship category, we are able to have a complete representation of the relationship among the subjects co-occurring in each authorship category defined based on gender. However, it so happens that neither the densely-connected nature nor the existence of disconnected components of these networks helps to find out whether there is a dominant pattern in the structure of subjects. The large number of links make the extraction of the truly relevant connections forming the network a challenging problem. One first step in the direction of extracting relevant information from the networks may be targeted at obtaining the corresponding MST([39];[40];[41];[42]).
3.2.1 From complete networks to minimum spanning trees
In the construction of a MST by the nearest neighbor method, one defines the subjects (in Table 1) as the nodes () of a weighted and connected333The hierarchical clustering process considers just the largest connected component of each network (). Therefore, depending on the authorship category () the resulting MSTs have different sizes, as indicated in the first row of Table 4. network () where the distance between each pair of subjects and corresponds to the inverse of weight of the link () between and .
From the distance matrix , a hierarchical clustering is performed using the nearest neighbor method. Initially clusters corresponding to the subjects are considered. Then, at each step, two clusters and are clumped into a single cluster if
with the distance between clusters being defined by
with and
This process is continued until there is a single cluster. This clustering process is also known as the single link method, being the method by which one obtains the MST of a graph [43].
In a connected graph, the MST is a tree of edges that minimizes the sum of the edge distances. In a network with nodes, the hierarchical clustering process takes steps to be completed, and uses, at each step, a particular distance to clump two clusters into a single one.
Let , be the set of distances used at each step of the clustering, and . It follows that .
The result of the hierarchical clustering process leading to the MST is usually described by means of a dendrogram. During this process, a unique color is assigned to each group of nodes within the dendrogram whose linkage is less than times the value of the threshold distance ). In the dendrogram presented here, is set to .
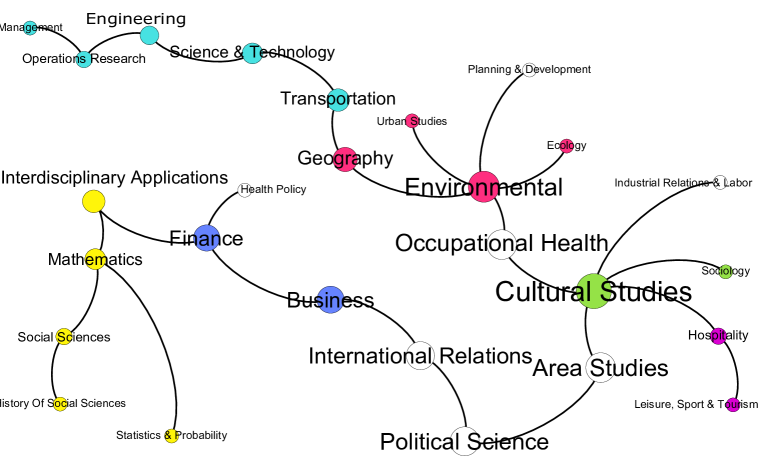
Six clusters can be observed in the dendrogram of (the network of the authorship category comprising all papers with at least one secondary subject) as Figure 5 shows. The colors assigned to these clusters will be hereafter used in the identification of the same partitions of subjects whenever represented in a MST.
The dendrogram in Figure 5 shows that the subjects Hospitality and Leisure, Sports & Tourism are the first to be clumped since their occurrences are perfectly correlated in . On the other hand, the papers on these two subjects remain almost isolated from any other subject matter in the overall set of papers being considered. The next cluster being defined comprises the subjects Business and Finance (colored blue). Being followed by the large cluster including Mathematics, Statistics, Social Sciences and Interdisciplinary Sciences (yellow). Another early defined cluster clumps together Transportation, Operational Research, Engineering and Science & Technology (turquoise). Further analyzing a dendrogram by its corresponding MST allows for observing the extent to which clusters give place to branches on the tree and whether different motifs emerge from the clusters positioning on the trees.
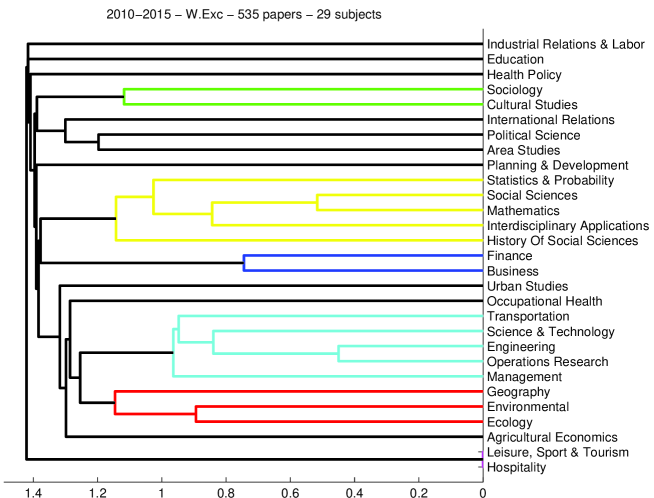
Figure 6 shows the representation of the corresponding MST. It is worth noting that closeness on the MST depends on the connection strength (the weight of the links) in , meaning that when two subjects co-occur in many papers of (being therefore strongly connected) they occupy close positions on this tree.
While the dendrograms provide information on the distances at which the subjects are clumped into clusters, their corresponding minimum spanning trees allow for the identification of at least four important aspects that are not directly stated in the dendrograms.
-
1.
Branches: the way nodes organize themselves in different ramifications of the tree
-
2.
Motifs: the prevalence of star motifs and/or path motifs in the tree
-
3.
Connectivity: highly connected and weakly connected nodes
-
4.
Centrality: the nodes occupying highly central positions and, conversely, those occupying the leafs of the tree
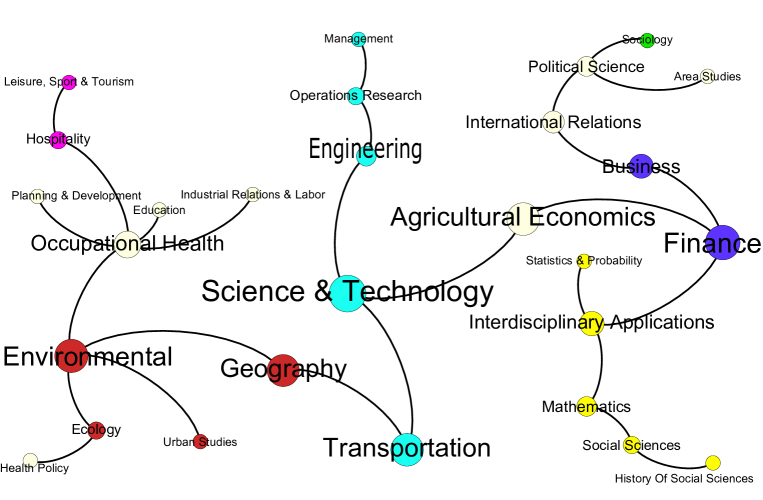
The observation of the MST presented in Figure 6 suggests that besides a ”core” cluster, there are at least three important branches separating ”classical” subjects; ”technological” subjects and ”environment-related” subjects. Figure 6 also shows that there are two highly connected nodes: Environmental Sciences and Cultural Studies.
In what concerns centrality, the subjects Political Sciences and Science & Technology occupy positions of great centrality on the tree. A distinct situation characterizes Education and Industrial Relations & Labor which occupy leaf positions on the MST. These two subjects, together with the cluster that joins Hospitality and Leisure, Sports & Tourism are the last ones to be connected in the hierarchical clustering process, as the dendrogram of Figure 5 shows.
3.2.2 The minimum spanning trees by authorship category
Since we hypothesized that specific characteristics could come out and shape the structures of the networks of subjects and that these characteristics may be associated to some ordering emerging from gender, here we consider the subsets of papers defined by the authorship categories and . In applying the hierarchical clustering process to each subset provides the following MSTs. They are ranked in descending of average percentage of female authors per article (as in Section 2.1).
-
1.
All authors are women (W.Exc-MST)
-
2.
Authors include at least one woman (W.Inc-MST)
-
3.
Authors include both women and men (W&M-MST)
-
4.
Authors include at least one man (M.Inc-MST)
-
5.
All authors are men (M.Exc-MST)
Obtaining the MST of a given network implies that the network is connected. Therefore, the application of the hierarchical clustering process to each network () by authorship category considers just the largest connected component of each network. Thereafter, depending on the authorship category () the resulting MSTs have different sizes, which are indicated in the first row of Table 4.()
Figures 7 and 8 present the minimum spanning trees of the gender exclusive authorship categories (W.Exc-MST and M.Exc-MST), being the nodes colored according to the partitions of subjects as defined in the dendrogram presented in Figure 5.
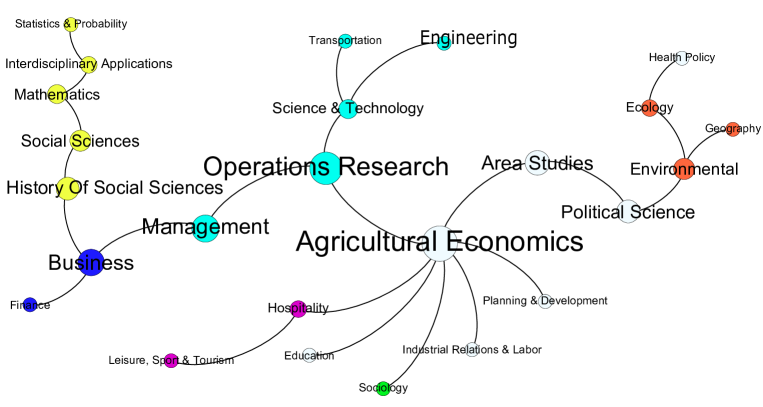
These networks are quite similar in the way nodes organize themselves in different branches (clusters) on the tree. However, there is an important difference concerning the centrality of certain nodes and the positioning of the main branches on the trees.
When centrality matters, Management occupies a central position in the woman exclusive (W.Exc-MST in Figure 7) but looses centrality in the man exclusive one (M.Exc-MST in Figure 8). The positioning of the ”core”, ”classical” and ”technological” branches suffer important changes when compared to their situation in the global MST ( in Figure 6). While the ”core” and the ”classical” branches remain linked in both the female and the man exclusive, the ”technological” and the ”core” branches, that in the global MST were linked through the Agricultural node are far away in the man exclusive MST (M.Exc-MST). The fact that they occupy close positions on the woman exclusive MST (W.Exc-MST) is probably associated to the greater centrality of the subject Management in this tree.
The increase of centrality of the subject Management in the woman exclusive MST together with the presence of the subject Agricultural Economics has an important bearing on that tree (W.Exc-MST), showing that when papers authorship includes just women, the larger distances between subjects in the network tend to be reduced due to an important increase in the relative number of papers having Management as a secondary subject.
3.2.3 Tree motifs
The adoption of a network approach provides well-known notions of graph theory to fully characterize the structure of the networks. Here, and since our analysis relies on the minimum spanning trees, we concentrate on the calculation of just two topological coefficients, both measured at the network level.
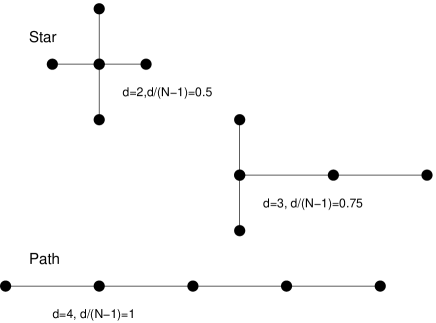
The first one is the number of leafs in the MST, i.e., the number of nodes with degree one. The second coefficient is the MST diameter (), measuring the shortest distance between the two most distant nodes on the tree. The choice of these coefficients allows to characterize tree motifs with different shapes: from a pure star to a pure path motif. Figure 9 shows examples of different motifs occurring on a tree of just five nodes () and the values of each corresponding diameter () and coefficient
It so happens that when the number of nodes of the tree is greater than 2, and depending on the motif that the MST approaches, its diameter ranges in between and (). The closer is to 1, the smaller is the similarity of the MST to a star motif. Moreover, the number of leafs ranges in between exactly the same values but in the opposite direction, the closer is to 1, the smaller is the similarity of the MST to a path motif.
Table 4 shows the values of and computed for the five trees by the authorship category. The first row in Table 4 displays the size of each MST, i.e., the number of nodes in each MST. The last row shows the values obtained for the coefficient , which are limited between (star) and (path).
| Authorship Category | 1 | 2 | 3 | 4 | 5 |
| MST | W.Exc | W.Inc | W&M | M.Inc | M.Exc |
| 25 | 28 | 27 | 29 | 27 | |
| 13 | 12 | 11 | 12 | 17 | |
| 11 | 11 | 12 | 13 | 10 | |
| 0.54 | 0.44 | 0.44 | 0.43 | 0.65 | |
| % female authors | 100 | 51 | 42 | 23 | 0 |
Table 4: Topological coefficients computed from the MST of each authorship category.
Although the five networks have similar sizes, there is a remarkable difference in the values obtained for the man exclusive tree (M.Exc-MST). When women are excluded, the network of subjects displays an much higher diameter (), showing large distances among subjects are enlarged. The also important decrease in the number of leafs () indicates that this network develops a entirely different structure when compared with the other MSTs by authorship category.
The plots in Figure 10 show the number of leafs ( , the diameter ( and the ratio across the different categories of authorship. As, depending on the specific tree motif, the values of and move in opposite directions, in computing the absolute value of the difference relative to helps to emphasize the distinguish structure of the MST that characterizes the man exclusive network (M.Exc-MST).

In the broader set of papers published in WoS indexed journals over the period 2010-2015 in the scientific domain of Economics and having at least one author affiliated to a Portuguese institution, as the percentage of female authorship decreases, the MST obtained from the corresponding network of subjects moves from a star configuration to a path motif. In so doing, the larger distances between subjects are enlarged and the number of poorly connected subjects increases. If, conversely, the network of subjects has a high percentage of female authorship, the corresponding MST approaches a star motif, the number of leafs is enlarged and the corresponding diameter decreases444The woman exclusive authorship (W.Exc-MST) shows a small deviation in the opposite direction. However, the fact that this network was induced from a small number of papers (57) might introduce some bias in its shape..
4 Conclusion
There are many ways to link the elementary units of system in order to induce a network. Choosing the most suitable way depends strongly on the available empirical data and on the research questions that a network analysis aims to address. Regarding available empirical data, most of bibliometric databases have a strong weakness concerning the study of the differences by gender. In what concerns research questions, gender differences in collaborative research and interdisciplinarity in scientific outputs have received little attention when compared with the growing importance that women hold in academia and research.
From the set of papers published in WoS indexed journals over the period 2010-2015 in the scientific domain of Economics and having at least one author affiliated to a Portuguese institution, our results apparently converge to the hypothesis that women prefer to work in teams. However, they also indicate that when papers are exclusively authored by women, the working teams tend to be smaller than any of those that also include men. These results converge to the mixed results reported in the literature, where different units of analysis, measures, methods and samples were adopted ([2];[15]; [17]-[31]).
Regarding interdisciplinarity, our findings seem to contradict the hypothesis that women have more propensity to interdisciplinary research collaboration [2]. Moreover, we found that academic women in Economics compared with their male counterparts reveal preference for the subjects Environmental Sciences, Management and Political Sciences and that, conversely, the subjects Social Sciences, Mathematics and Finance display higher frequencies in papers either inclusively or exclusively authored by men.
Our main contribution relies in the adoption of a network approach allowing to uncover the emergence of a specific pattern when the network of scientific subjects is induced from a set of papers exclusively authored by men. Such a male exclusive authorship condition is found to be the solely responsible for the emergence of that specific shape in the structure of the network.
Moving away from a star motif together with the loss of centrality of the subject Management have an important bearing on the structure of the male exclusive authorship network: when papers authorship includes just men, the larger distances between subjects in the network become even larger and this is mainly due to a decrease in the relative number of papers having Management as a secondary subject. We find enough evidence that gender imbalance in scientific authorships brings a peculiar trait to the networks of subjects. Such a peculiar trait might facilitate future network analyses of research collaboration and interdisciplinarity.
Acknowledgement:
The research reported in this paper was developed under the PLOTINA project ( Promoting gender balance and inclusion in research, innovation and training ), which has received funding from the European Union s Horizon 2020 research and innovation programme, under Grant Agreement No 666008 (www.plotina.eu). The views and opinions expressed in this publication are the sole responsibility of the author(s) and do not necessarily reflect the views of the European Commission. Financial support by FCT (Fundação para a Ciência e a Tecnologia), Portugal is gratefully acknowledged. This article is part of the Strategic Project: UID/ECO/00436/2013. The authors thank Marilei Kroetz for her work in the gender identification process.
References
- [1] Banisch S.; Lima, R.; Araújo T. Agent Based Models and Opinion Dynamics as Markov Chains, Social Networks 2012, 34, 549–561.
- [2] Abramo, G.; Cicero, T.; D’Angelo, C. A. Should the research performance of scientists be distinguished by gender? Journal of Informetrics 2015, 9, 25-38.
- [3] Beaver, D. D. Reflections on scientific collaboration, (and its study): past, present, and future. Scientometrics 2001, 52, 365-377.
- [4] Börner, K.; Dall’Asta, L.; Ke, W.; Vespignani, A. Studying the emerging global brain: Analyzing and visualizing the impact of co-authorship teams. Complexity 2005, 10, 57-67.
- [5] Cainelli, G.; Maggioni, M. A.; Uberti, T. E.; de Felice, A. The strength of strong ties: How co-authorship affect productivity of academic economists? Scientometrics 2015, 102, 673-699.
- [6] Ductor, L. Does Co-authorship Lead to Higher Academic Productivity? Oxford Bulletin of Economics and Statistics 2015, 77, 385-407.
- [7] Hoekman, J.; Frenken, K.; Tijssen, R. J. W. Research collaboration at a distance: Changing spatial patterns of scientific collaboration within Europe. Research Policy 2010, 39, 662-673.
- [8] Stefaniak, B. International co-operation in science and in social sciences as reflected in multinational papers indexed in SCI and SSCI. Scientometrics 2001, 52, 193-210.
- [9] Abramo, G.; D’Angelo, C. A.; Murgia, G. Variation in research collaboration patterns across academic ranks. Scientometrics 2014, 98, 2275-2294.
- [10] Beaver, D. D.; Rosen, R. Studies in scientific collaboration: Part I. The professional origins of scientific co-authorship. Scientometrics 1978, 1, 65-84.
- [11] Tsai, C.C. ; Corley, E.A. ; Bozeman B. Collaboration experiences across scientific disciplines and cohorts. Scientometrics 2016, 1-25.
- [12] Krichel, T.; Bakkalbasi, N. A social network analysis of research collaboration in the economics community. Journal of Information management and Scientometrics 2006, 3, 1-12.
- [13] Pieters, R.; Baumgartner, H. Who talks to whom? Intra- and interdisciplinary communication of economics journals. Journal of Economic Literature 2002, 40, 483-509.
- [14] Barnett, A. H.; Ault, R. W.; Kaserman, D. L. The rising incidence of co-authorship in economics-further evidence. Review of Economics and Statistics 1988, 70, 539-543.
- [15] McDowell, J. M.; Melvin, M. The determinants of co-authorship – an analysis of the economics literature. Review of Economics and Statistics 1983, 65, 155-160.
- [16] Goyal, S.; van der Leij, M. J.; Moraga-Gonzalez, J. L. Economics: An emerging small world. Journal of Political Economy 2006, 114, 403-412.
- [17] Meng, Y. (2016) Collaboration patterns and patenting: Exploring gender distinctions, in Research Policy 45, 56–67.
- [18] Frandsen, T. F.; Jacobsen, R. H.; Wallin, J. A.; Brixen, K.; Ousager, J. Gender differences in scientific performance: A bibliometric matching analysis of Danish health sciences Graduates. Journal of Informetrics 2015, 9, 1007-1017.
- [19] Kyvik, S.; Teigen, M. Child care, research collaboration, and gender differences in scientific productivity. Science Technology & Human Values 1996, 21, 54-71.
- [20] McDowell, J. M.; Smith, J. K. The effect of gender-sorting on propensity to coauthor – implications for academic promotion. Economic Inquiry 1992, 30, 68-82.
- [21] Rorstad, K.; Aksnes, D. W. Publication rate expressed by age, gender and academic position - A large-scale analysis of Norwegian academic staff. Journal of Informetrics 2015, 9, 317-333.
- [22] Abramo, G.; D’Angelo, C. A.; Murgia, G. Gender differences in research collaboration. Journal of Informetrics 2013, 7, 811-822.
- [23] Barbezat, D. A. Gender differences in research patterns among PhD economists. Journal of Economic Education 2006, 37, 359-374.
- [24] Boschini, A.; Sjogren, A. Is team formation gender neutral? Evidence from coauthorship patterns. Journal of Labor Economics 2007, 25, 325-365.
- [25] Bozeman, B.; Gaughan, M. How do men and women differ in research collaborations? An analysis of the collaborative motives and strategies of academic researchers. Research Policy 2011, 40, 1393-1402.
- [26] Cottrell, B.; Parpart, J. L. Academic-community collaboration, gender research, and development: Pitfalls and possibilities. Development in Practice. 2006, 1, 15-26.
- [27] Kosmuski, M. Gender disparity in Polish science by year (1975–2014) and by discipline. Journal of Informetrics. 2015, 9, 658-66.
- [28] Raasch, C.; Lee, V.; Spaeth, S.; Herstatt, C. The rise and fall of interdisciplinary research: The case of open source innovation. Research Policy 2013, 42, 1,138-1151.
- [29] Rhoten, D.; Pfirman, S. Women in interdisciplinary science: Exploring preferences and consequences. Research Policy 2007, 36, 56-75.
- [30] Smykla, E.; Zippel K. Literature review: Gender and international research collaboration. Report prepared with funding from NSF, OISE, 2010, 936-970.
- [31] Uhly, K.M. ;Visser, L.M.; Zippel, K.S. Gendered patterns in international research collaborations in academia. Studies in Higher Education 2015, 8, 1-23.
- [32] Barabási, A.L.; Jeong, H.; Ravasz, R.; Néda, Z.; Vicsek, T.; Schubert, A. On the topology of the scientific collaboration networks. Physica A 2002, 311, 590-614, 4-6.
- [33] Adriaanse, L. S.; Rensleigh, C. Web of Science, Scopus and Google Scholar A content comprehensiveness comparison. Electronic Library 2013, 31, 727-744.
- [34] Harzing, A.-W.; Alakangas, S. Google Scholar, Scopus and the Web of Science: a longitudinal and cross-disciplinary comparison. Scientometrics 2016, 106, 787-804.
- [35] Sugimoto, C. R.; Lariviere, V.; Ni, C.; Gingras, Y.; Cronin, B. Global gender disparities in science. Nature 2013, 504, 211-213.
- [36] Naldi, F.; Luzi, D.; Valente, A.; Parenti, I. V. Scientific and technological performance by gender. Handbook of Quantitative Science and Technology Research: the Use of Publication and Patent Statistics in Studies of S&T Systems 2004, 299-314.
- [37] Araújo T.; Banisch S. Multidimensional Analysis of Linguistic Networks, inTowards a Theoretical Framework for Analyzing Complex Linguistic Networks 2016 (107-131). Springer Berlin Heidelberg.
- [38] https://data.oecd.org/rd/researchers.htm.
- [39] Vilela Mendes, R; Araújo, T. Louçã, F. Reconstructing an economic space from a market metric, Physica A 2003, 323, 635–650.
- [40] Araújo, T. ; Louçã, F. The geometry of crashes—a measure of the dynamics of stock market crises, Quantitative Finance 2007, 7, 63–74.
- [41] Araújo T.; Spelta, A. The topology of cross-border exposures: beyond the minimal spanning tree approach, Physica A 2012, 391, 5572–5583.
- [42] Araújo T.; Ferreira M.E. The Topology of African Exports: emerging patterns on spanning trees. Physica A 2016, in press (http://dx.doi.org/10.1016/j.physa.2016.06.44) .
- [43] Araújo, T.; Vilela Mendes, R. Function and form in networks of interacting agents, Complex Systems 2000, 12, 357-373.