A primordial origin for molecular oxygen in comets: A chemical kinetics study of the formation and survival of O2 ice from clouds to disks
Abstract
Molecular oxygen has been confirmed as the fourth most abundant molecule in cometary material (\ceO2/\ceH2O %) and is thought to have a primordial nature, i.e., coming from the interstellar cloud from which our solar system was formed. However, interstellar \ceO2 gas is notoriously difficult to detect and has only been observed in one potential precursor of a solar-like system. Here, the chemical and physical origin of \ceO2 in comets is investigated using sophisticated astrochemical models. Three origins are considered: i) in dark clouds, ii) during forming protostellar disks, and iii) during luminosity outbursts in disks. The dark cloud models show that reproduction of the observed abundance of \ceO2 and related species in comet 67P/C-G requires a low H/O ratio facilitated by a high total density ( cm-3), and a moderate cosmic ray ionisation rate ( s-1) while a temperature of 20 K, slightly higher than the typical temperatures found in dark clouds, also enhances the production of \ceO2. Disk models show that \ceO2 can only be formed in the gas phase in intermediate disk layers, and cannot explain the strong correlation between \ceO2 and \ceH2O in comet 67P/C-G together with the weak correlation between other volatiles and \ceH2O. However, primordial \ceO2 ice can survive transport into the comet-forming regions of disks. Taken together, these models favour a dark cloud (or "primordial”) origin for \ceO2 in comets, albeit for dark clouds which are warmer and denser than those usually considered as solar system progenitors.
keywords:
ISM: abundances – ISM: molecules – astrochemistry – protoplanetary discs – stars: formation – comets: individual: 67P/C-G1 Introduction
Molecular oxygen, \ceO2, is a dominant component of Earth’s atmosphere (21% by volume). Because it is a byproduct of photosynthesis (and also a reactant in cellular respiration), it is considered as a potential marker for biological activity on terrestrial-like exoplanets (e.g., Snellen et al., 2013). Atomic oxygen is the third most abundant element in the universe (following H and He); however, it is still unknown what fraction of oxygen is contained within the deceptively simple \ceO2 in interstellar and circumstellar material.
Gas-phase \ceO2 has recently been observed in-situ in the coma of comet 67P/Churyumov-Gerasimenko (Bieler et al., 2015, hereinafter comet 67P/C-G) by the ROSINA instrument on board the Rosetta spacecraft (Rosetta Orbiter Spectrometer for Ion and Neutral Analysis, Balsiger et al., 2007). \ceO2 is strongly correlated with \ceH2O and is present at an average level of % relative to \ceH2O, making it the fourth most abundant molecule in the comet, following \ceH2O, \ceCO2, and \ceCO. The authors argue that \ceO2 does not originate from gas-phase chemistry in the coma but from direct sublimation from or within the comet surface. The strong correlation with \ceH2O suggests that the \ceO2 is trapped within the bulk \ceH2O ice matrix of the comet, which provides constraints concerning the chemical origin of the \ceO2 ice. Processing of the cometary surface by solar wind particles and UV radiation has been ruled out by the authors, because the penetration depth (a few m to m) is not sufficient to process material throughout the bulk. This process has been postulated to be responsible for the \ceO2-rich, yet tenuous, atmospheres of several of the icy moons of Saturn and Jupiter (e.g., Hall et al., 1995; Spencer et al., 1995; Teolis et al., 2010). Upon each pass into the inner solar system, comet 67P/C-G loses several meters of surface ice; hence, the surface revealed today is likely pristine. A reanalysis of data from the Neutral Mass Spectrometer on board the Giotto probe which did a fly-by of comet 1P/Halley in 1986, confirmed the presence of \ceO2 at a level similar to that seen in 67P/C-G (Rubin et al., 2015b). This suggests that \ceO2 is not only an abundant molecule in comets, but is also common to both Jupiter-family comets, such as 67P/C-G, and Oort Cloud comets, such as 1P/Halley, which have different dynamical behaviours and histories.
The 67P/C-G observations strongly suggest that \ceO2 was present within the ice mantle on dust grains in the presolar nebula prior to comet formation. This then raises the question whether \ceO2 was abundant in icy dust mantles entering the protoplanetary disk of the young Sun, or whether the conditions in the comet-forming zone of the early solar system were favourable for \ceO2 formation and survival. Upper limits on the abundance of \ceO2 ice in molecular clouds obtained with the Infrared Space Observatory (ISO) and ground-based instruments are rather conservative (\ceO2/\ceH2O , Vandenbussche et al., 1999; Pontopiddan et al., 2003). \ceO2 is a diatomic homonuclear molecule with zero electric dipole moment; hence it does not possess electric dipole-allowed rotational transitions which makes it difficult to detect in cold environments via remote sensing. Therefore, gas-phase \ceO2 has been particularly elusive in interstellar clouds, early attempts to detect gas-phase \ceO2 in molecular clouds with the Submillimeter Wave Astronomy Satellite (SWAS) and Odin resulted in upper limits only, relative to \ceH2 (Goldsmith et al., 2000; Pagani et al., 2003).
More recent and higher sensitivity observations with Herschel allowed a deep search for \ceO2 towards sources considered true solar system progenitors: low-mass protostars. A deep upper limit was determined towards the well-studied protostar, NGC 1333-IRAS 4A, (\ceO2/\ceH2 , Yildiz et al., 2013). Detailed modelling of the chemistry throughout the well-characterised envelope of IRAS 4A demonstrates that the material entering the protoplanetary disk, both gas and ice, is likely poor in molecular oxygen. For a \ceH2O/\ceH2 abundance of , the inferred limit would correspond to a \ceO2/\ceH2O abundance ratio of %. This picture is consistent with laboratory experiments that have shown that \ceO2 ice is efficiently hydrogenated at low temperatures and converted into \ceH2O and \ceH2O2 ices ( K, Ioppolo et al., 2008; Miyauchi et al., 2008). This makes the close association of \ceO2 with \ceH2O in 67P/C-G an even stronger enigma.
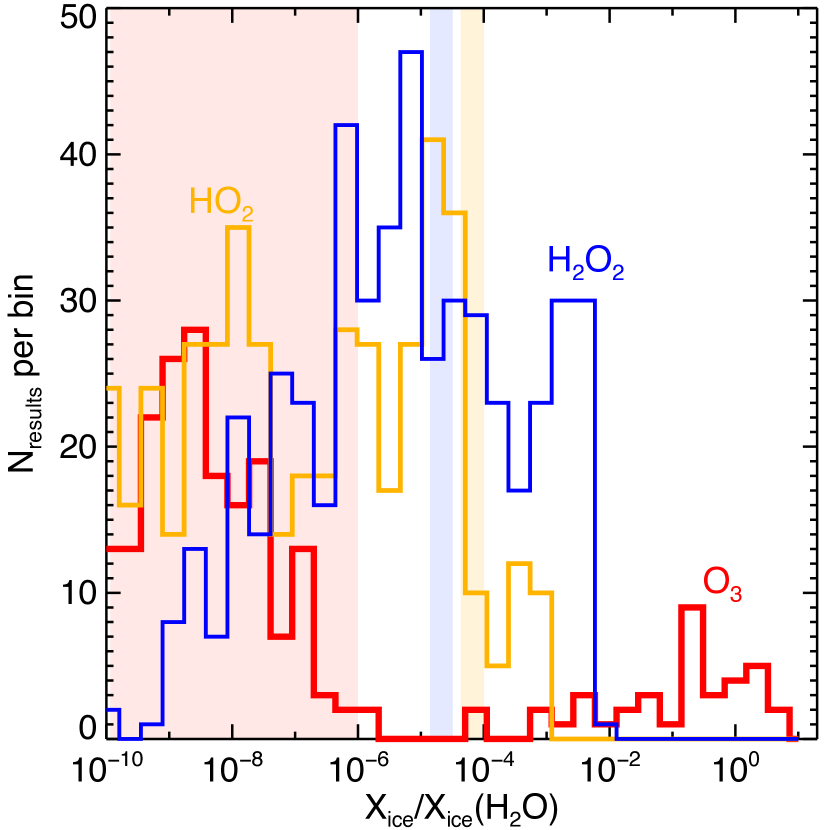
However, Herschel did reveal the presence of gas-phase \ceO2 in two sources: Orion (, Goldsmith et al., 2011; Chen et al., 2014) and Oph A (, Larsson et al., 2007; Liseau et al., 2012). Orion is a region of active star formation and the location of the gas-phase \ceO2 emission coincides with a clump of very warm ( K) and dense gas, a so-called \ceH2 ‘hot spot’, which may have recently been subjected to shocks (e.g., Melnick & Kaufman, 2015). These conditions are not representative of those expected in the molecular cloud from which the Sun formed. On the other hand, Oph A is a dense core in the more quiescent Oph molecular cloud complex, which stands out from other low-mass star-forming regions by exhibiting emission from relatively warm molecular gas ( K, Liseau et al., 2010; Bergman et al., 2011a). Subsequent observations of Oph A have also determined the presence of related gas-phase species, \ceHO2 and \ceH2O2, at an abundance level on the order of that of \ceO2 (Bergman et al., 2011b; Parise et al., 2012). These molecular ratios show reasonable agreement with those seen in 67P/C-G with ROSINA (, , Bieler et al., 2015). The chemically related species, \ceO3 (ozone), was not detected in the comet coma with a very low upper limit, with respect to \ceO2.
In summary, despite \ceO2 being a particularly elusive molecule in interstellar and circumstellar environments, there apparently do exist conditions which are favourable for the formation of \ceO2 and related species at abundance ratios similar to that observed in ices in comet 67P/C-G. By assuming that all the energy deposited into water ice by high energy particles is used to convert \ceH2O into \ceO2, Mousis et al. (2016) claimed that radiolysis of water-containing interstellar ices in molecular clouds is the only mechanism that produces \ceO2 in high abundances. However, laboratory experiments of cold interstellar ice analogs show that \ceO2 can also be efficiently formed through non-energetic surface chemistry before being converted to water (see Minissale et al., 2014) while the production of \ceO2 through water radiolysis should be accompanied by a more efficient production of \ceH2O2, in contradiction with the low abundance of \ceH2O2 observed in 67P/C-G.
Here we investigate the formation and survival of \ceO2 ice using a variety of sophisticated astrochemical models, taking an extended chemical network including the formation and destruction pathways of \ceO2 into account, in order to elucidate the origin of cometary \ceO2, and help explain its strong correlation with water ice and the low abundances of its chemically related species. We explore and discuss several different origins: i) \ceO2 synthesis in ice mantles in dark clouds (“primordial” origin), ii) \ceO2 formation and survival en route from the protostellar envelope into the disk and subsequent delivery into the comet-forming zone, and (iii) in-situ formation of \ceO2 within the protoplanetary disk prior to comet formation. This work differs from that presented in Mousis et al. (2016) because we consider all possible chemical pathways between \ceO2 and other O-bearing species, including \ceH2O, \ceHO2, \ceH2O2, and \ceO3. In Section 2 we describe the interstellar chemistry of molecular oxygen, in Sections 3 to 5 we systematically discuss each scenario, presenting the necessary evidence for or against each hypothesis, and in Section 6 we summarise our main findings.
2 Interstellar chemistry of O2
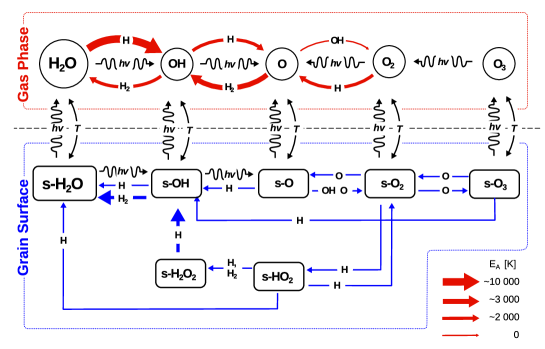
Two main processes have been invoked for the formation of molecular oxygen in the interstellar medium: i) gas-phase formation via neutral-neutral chemistry, and ii) formation via association reactions on/within icy mantles of dust grains. The observations towards both Oph A and 67P/C-G, in conjunction with known chemical pathways studied in the laboratory, present several challenges for astrochemical models. First, the reproduction of the relatively high \ceO2/\ceH2O ice ratio simultaneously with the very low \ceO3/\ceH2O ice ratio, and second, the ratios of \ceHO2/\ceO2 and \ceH2O2/\ceO2 produced in the gas phase, assuming that chemistry on or within the ice mantle is responsible for the observed gas-phase ratios. Figure 1 summarises the chemical reactions involved in the formation and destruction of molecular oxygen which are discussed here.
2.1 Gas-phase chemistry
Gaseous \ceO2 is thought to form primarily via the barrierless neutral-neutral reaction between O and OH in cold and warm gas. Due to its importance, this reaction has been well studied both experimentally and theoretically. The rate coefficient has a negligible temperature dependence, with a recommended value (based on theoretical calculations and experiments) between and cm3 s-1 at 10 K, and an experimentally-constrained value of cm3 s-1 at 140 K decreasing to cm3 s-1 at 300 K (see Hincelin et al., 2011, for a discussion on the rate coefficient). The formation of \ceO2 in cold dark clouds is initiated by the high initial abundance assumed for atomic oxygen, inducing an efficient ion-neutral chemistry that also forms OH. In warm environments ( K), e.g., the inner regions of protostellar envelopes or the inner, warm layers of protoplanetary disks, OH and O are mostly produced through warm neutral-neutral chemistry driven by the photodissociation of water sublimated from interstellar ices. The gas-phase formation of the chemically-related species, \ceO3, is inefficient under interstellar conditions, as it requires three-body association of \ceO2 + \ceO (Atkinson et al., 2004); thus, despite this reaction possessing a negligible reaction barrier, it only proceeds under the high-density conditions found in planetary atmospheres and in the inner midplanes of protoplanetary disks.
2.2 Ice chemistry
Solid \ceO2 in dark clouds is involved in the surface chemistry reaction network leading to the formation of water ice (Tielens & Hagen, 1982; Cuppen et al., 2010; van Dishoeck et al., 2013). \ceO2 is formed through atomic O recombination on ices and efficiently reacts with either atomic O or atomic H to form \ceO3 or \ceHO2, respectively, eventually leading to the formation of water. The hydrogenation of \ceO3 also leads to the formation of \ceO2, in addition to dominating the destruction of \ceO3 ice.
Laboratory experiments of interstellar ice analogues studying water formation suggest that the O + O, O + \ceO2, and H + \ceO2 reactions, involved in the formation and destruction of \ceO2, all have small or negligible reaction barriers. Miyauchi et al. (2008) and Ioppolo et al. (2008) independently studied the efficiency of the \ceO2 + H reaction, with both studies concluding that this reaction is effectively barrierless, contradicting the earlier quantum calculations by Melius & Blint (1979) for the gas-phase reaction which predicted an activation barrier of 1200 K. The reactivity of the O + O and O + \ceO2 reactions is still a matter of debate, and is discussed in section 2.4. The reaction, , is considered unlikely to occur on grain surfaces under dark cloud conditions because of its relatively high activation energy barrier, 2000 K, as experimentally determined for the gas-phase reaction (Atkinson et al., 2004).
Dark clouds, the inner regions of protostellar envelopes, and the comet-forming regions of protoplanetary disks, are all well-shielded from external sources of UV radiation ( mag); however, water ice can be photodissociated by cosmic-ray-induced UV photons produced by the excitation of molecular hydrogen by electrons generated by cosmic-ray ionisation of \ceH2 (Prasad & Tarafdar, 1983). Water ice photodissociation has been extensively studied in the laboratory (Westley et al., 1995; Öberg et al., 2009) and in molecular dynamics (MD) simulations (Andersson et al., 2006; Andersson & van Dishoeck, 2008; Arasa et al., 2015). The MD simulations show that water ice which is photodissociated generates OH and H photoproducts that move through the ice due to their excess energy. Each photodissociation event can lead to various chemical outcomes (e.g., direct desorption into the gas phase or recombination followed by desorption or trapping), the probabilities for which are dependent upon the depth into the ice mantle (and fully tabulated in Arasa et al., 2015). The detection of \ceO2 following the UV irradiation of cold water ice also supports water ice photodissociation into O + \ceH2 or O + H + H photoproducts (Öberg et al., 2009; Heays et al., 2016).
Laboratory experiments show that the bombardment of cold water ices with ionizing energetic particles can result in the formation of \ceO2 and other chemically related species from the destruction of water (see Matich et al., 1993; Sieger et al., 1998; Baragiola et al., 2002; Zheng et al., 2006; Loeffler et al., 2006; Teolis et al., 2010; Hand & Carlson, 2011). The production of \ceO2 and \ceH2O2 through irradiation of water ice by energetic particles depends on the projectile penetration depth. Low-energy ions, for example, only penetrate the few dozen outermost ice layers, where H and \ceH2 can easily escape, favouring an efficient production of \ceO2 relative to \ceH2O2. The yield of O2 production therefore tends to decrease with the energy of the irradiating particles from a few molecule eV-1 for keV protons to for MeV ions (see Teolis et al., 2010). Irradiation of energetic ions during the condensation of water molecules can dramatically enhance the production of \ceO2 up to \ceO2/\ceH2O abundances ratios of % (Teolis et al., 2006).
2.3 Gas-ice balance
O2 formed in the ice mantle under dark cloud conditions ( K) can be returned to the gas-phase via a multitude of non-thermal desorption processes (e.g., Tielens, 2013). Those mechanisms which have been quantified in the laboratory for \ceO2 include photodesorption by cosmic-ray-induced UV photons (Fayolle et al., 2013; Zhen & Linnartz, 2013), and desorption induced by exothermic chemical reactions (i.e., chemical desorption, Minissale & Dulieu, 2014; Minissale et al., 2016). Photodesorption of \ceO2 was found to be triggered by photodissociation, with \ceO2 returned to the gas-phase with yields of molecules per incident photon, for a radiation spectrum appropriate for the cosmic-ray-induced UV field and pure \ceO2 ice (Fayolle et al., 2013). \ceO3 is also detected in the experiments by Zhen & Linnartz (2013) with yields a factor of a few lower than those for \ceO2. \ceO3 is not seen in the experiments by Fayolle et al. (2013) due to the lower FUV fluences in the synchrotron experiments.
The probability of chemical desorption depends strongly on the type of reaction and on the substrate and can vary between 0 and 80%. The chemical desorption efficiency of the O + O reaction was found to be % in experiments of \ceO2 formation via oxygen recombination on bare olivine-type surfaces (Minissale & Dulieu, 2014). However, in experiments with higher oxygen coverage, the efficiency was reduced to an estimated upper limit of % probably due to an efficient dissipation of the energy released by the exothermic reaction into the water ice (Minissale & Dulieu, 2014; Minissale et al., 2016). The standard chemical desorption efficiencies assumed in this work are the theoretical values computed by Minissale et al. (2016) for the submonolayer regime on bare grains. However, they should be regarded as upper limits. The O + O reaction has a high theoretical probability of 68% while reactions \ceO2 + H, \ceHO2 + H, and \ceH2O2 + H show much lower theoretical chemical desorption probabilities of 0.5 - 2 %, in agreement with the experimental upper limits. We explore in Section 3.2 the impact of the chemical desorption efficiencies on the gas phase abundances of \ceO2 and its chemically related species. When data are not available, the chemical desorption probability is fixed to 1.2% (Garrod et al., 2007).
The binding energies of \ceO2 to a variety of surfaces, including dust-grain analogues and water ice, have been measured in the laboratory ( K, Collings et al., 2004; Fuchs et al., 2006; Acharyya et al., 2007; Noble et al., 2012; Collings et al., 2015). This low binding energy makes \ceO2 a particularly volatile species, expected to desorb at temperatures similar to CO. In temperature-programmed desorption (TPD) experiments with \ceO2 layered on top of, and fully mixed with, water ice, a fraction of \ceO2 is found to remain trapped within the ice matrix and released at higher temperatures (Collings et al., 2004). The trapped fraction depends upon the deposition temperature with a greater fraction of volatiles trapped within the water ice when deposited at lower temperatures (Collings et al., 2003).
2.4 Important parameters for the chemistry of O2
The \ceO2 formation and survival in dark clouds and protoplanetary disks
depends on a number of parameters, which are linked in turn to various
physical and chemical conditions:
1) The gas phase abundance ratio between H and O atoms that accrete onto grains governs the competition between hydrogenation reactions leading to \ceH2O2 and \ceH2O and association reactions between O atoms, forming \ceO2 or \ceO3 (Tielens & Hagen, 1982). For dark cloud conditions, the atomic H abundance in the gas phase is a balance between its formation, which occurs via \ceH2 ionisation followed by dissociative electron recombination, and its conversion back into \ceH2 via recombination reactions on grain surfaces. At steady state and assuming a sticking probability of 1, the density of H is therefore given by the ratio between these two processes (Tielens, 2005)
| (1) |
where is the thermal velocity of atomic hydrogen, the cosmic ray ionisation rate, and and the abundance and the cross section of interstellar grains. The absolute number density of atomic H is therefore independent of the total density and increases linearly with the cosmic ray ionisation rate. Since the initial number density of atomic O increases linearly with the total number density for a fixed oxygen abundance, the atomic H/O abundance ratio increases (decreases) linearly with the total density (cosmic-ray ionisation rate).
2) The surface mobility of O atoms governs the reactivity of the O + O and O + \ceO2 reactions. The surface mobility of O atoms occurs mostly through thermal hopping and depends exponentially on the dust temperature , and their diffusion energy . Astrochemical models which treat grain-surface chemistry usually scale the diffusion energy to the binding energy of the considered species , using a fixed value for the diffusion-to-binding energy ratio (e.g., Tielens & Allamandola, 1987). As discussed by several authors (Cuppen & Herbst, 2007; Taquet et al., 2012), and strongly depend upon the ice morphology and composition. The mobility of atomic oxygen on interstellar ice analogues has recently been investigated by several experimental groups (Bergeron et al., 2008; He et al., 2015) who conclude that atomic O has a higher binding energy than the value of 800 K estimated by Tielens & Allamandola (1987). Theoretical calculations and experiments studying the diffusion of molecules (CO or \ceCO2) or heavy atoms (O) on several types of substrates suggest that species diffuse with low diffusion-to-binding energy ratios of the order of % (Jaycock & Parfitt, 1986; Karssemeijer & Cuppen, 2014). However, experiments focusing on \ceH2 formation via H recombination on surfaces suggest a higher diffusion-to-binding energy ratio between 50 and 80% (Katz et al., 1999; Perets et al., 2005; Matar et al., 2008). The diffusion-to-binding energy ratio likely has a distribution of values that depend upon the substrate (bare or ice-coated), the species under consideration (light atom, heavy atom, molecule), the ice morphology (porous, compact, crystalline, or amorphous ice), and the dominant composition of the chemically-active surface layer (\ceH2O, \ceCO2, or \ceCO ).
3) The activation barriers of the O + O and O + \ceO2 reactions directly govern the reactivity of the two reactions. Minissale et al. (2014) derive an upper limit of 150 K for the reaction barrier for O + O and O + \ceO2 in an experimental study on an amorphous silicate surface. However, the presence of an activation barrier for the latter reaction has been invoked by several authors (see Dulieu, 2011). For example, Lamberts et al. (2013) require an activation barrier of 500 K for the O + \ceO2 reaction in order to reproduce the results of laboratory experiments in thick ices with their microscopic Monte-Carlo model. Here we explore the effects of the parameter choices for these three key aspects of the \ceO2 chemistry.
2.5 Astrochemical models
Three state-of-the-art gas-grain astrochemical models have been used in this work to study the formation and survival of molecular oxygen from dark clouds to the Solar System: 1) the multi-phase model by Taquet et al. (2014) to study the formation of \ceO2 in dark clouds; 2) the multi-phase model by Furuya et al. (2015) to study the formation of \ceO2 during the formation of protoplanetary disks; 3) the two-phase model by Walsh et al. (2015) to study the formation of \ceO2 in-situ in protoplanetary disks.
The multi-phase gas-grain Taquet and Furuya models couple the gas phase and ice chemistries with the approach developed by Hasegawa & Herbst (1993) to follow the multi-layer formation of interstellar ices and to determine the gas-ice balance. Several sets of differential equations governing the time-evolution of abundances are considered: one for gas-phase species, one for surface ice-mantle species, and one (or several) for bulk ice-mantle species. The equations governing chemical abundances on the ice surface and in the bulk ice are linked by an additional term that is proportional to the rate of growth or loss of the grain mantle. As a consequence, surface species are continuously trapped in the bulk because of the accretion of new species in dark clouds. Following Vasyunin & Herbst (2013), the chemically-active surface is limited to the top four monolayers. The bulk ice mantle is considered to be chemically inert. The original three-phase model considered in the Taquet model assumes that the inert bulk ice mantle has a uniform molecular composition. In order to accurately follow the ice evolution in warm conditions, the Furuya model considers a depth-dependent molecular composition, through the division of the inert bulk ice mantle into five distinct phases (for details, see Furuya et al., 2016, and references therein).
Radiolysis, i.e. the bombardment of (ionizing) energetic particles depositing energy into the ice, and/or photolysis, i.e. the irradiation of ultraviolet photons breaking bonds, can trigger chemistry within the bulk mantle of cold interstellar ices. We have investigated the impact of the UV photolysis induced by secondary UV-photons on the bulk ice chemistry and the formation and survival of \ceO2 by activating the bulk chemistry and assuming the same ice parameters as for the surface chemistry (same diffusion and binding energies, same chemical reactions). In our model, the formation of \ceO2 from \ceH2O photodissociation is a multi-step process, starting from the production of oxygen atoms from water or OH photodissociation followed by their recombination. We find that \ceO2 cannot be efficiently produced in the bulk through ice photolysis as the photodissocation of the main ice components not only produces oxygen atoms, that recombine together to form \ceO2, but also hydrogen atoms that react with \ceO2 to reform water even if \ceH2O ice photodissociation would go directly to \ceH2 rather than H since there are other molecules like \ceCH4, \ceNH3 or \ceCH3OH that produce hydrogen atoms that are very mobile. Overall, activating the bulk chemistry decreases the abundance of highly reactive species like O atoms or radicals but does not affect the main ice species.
Laboratory experiments show that \ceO2 can be efficiently formed through radiolysis of ices without overproducing \ceH2O2 only if the radiolysis occurs as water is condensing onto a surface (Teolis et al., 2006, see section 2.2). However, in molecular clouds water ice is mostly formed in-situ at the surface of interstellar grains through surface reactions involving hydrogen and oxygen atoms. This happens prior to the formation of the presolar nebula, i.e. the cloud out of which our solar system was formed, and it is possible that the comet-forming zone of the Sun’s protoplanetary disk inherited much of its water ice from the interstellar phase (Visser et al., 2009; Cleeves et al., 2014; Altwegg et al., 2015; Furuya et al., 2016). For the radiolysis mechanism to occur in the presolar nebula, water ice would first need to be completely sublimated and then recondensed prior to comet formation. Luminosity outbursts induced by instabilities in the disk of the solar nebula can potentially provide a scenario for efficient \ceO2 production in the ice matrix through sudden evaporation of water ice followed by fast recondensation. We consider this scenario less likely because the cosmic-ray ionisation rate is thought to be impeded near the disk midplane with respect to interstellar values (e.g., Cleeves et al., 2013). Energetic ionizing particles from the (pre)solar wind are also expected to be significantly attenuated close to the disk midplane by the intervening large column of material ( g cm-2) between the central star and the comet-forming zone beyond AU.
Mousis et al. (2016) explored the \ceO2 formation through radiolysis of water within interstellar ices in the solar nebula to explain the high abundance of \ceO2 observed in comet 67P/C-G. However, they concluded that the galactic cosmic-ray flux is not sufficient to produce the observed ratio of \ceO2/\ceH2O over the lifetime of the presolar nebula.
The gas-phase chemical network used by the Taquet model is the non-deuterated version of that from Taquet et al. (2014), the basis for which is the 2013 version of the KIDA chemical database (Wakelam et al., 2012). It has been further updated to include warm gas-phase chemistry involving water and and ion-neutral reactions involving ozone. The network also includes the surface chemistry of all dominant ice components (\ceH2O, CO, \ceCO2, \ceNH3, \ceCH4, \ceH2CO, \ceCH3OH), as well as those important for water (e.g., \ceO2, \ceO3, and \ceH2O2). Several new surface reactions were added involving \ceO3 and reactive species such as N, O, OH, \ceNH2, and \ceCH3, following the NIST gas-phase chemical database.
The gas-ice chemical network of Garrod & Herbst (2006), based on the OSU 2006 network, is used with the Furuya model. The gas phase and surface networks are more suited to the high density and warm temperatures conditions found in protostellar envelopes. It has therefore been supplemented with high-temperature gas-phase reactions from Harada et al. (2010) and includes the formation of many complex organic molecules. It is consequently more expansive than the network used in the Taquet model.
The gas-phase chemical used in the Walsh model is based on the 2012 release of the UMIST Database for Astrochemistry (UDfA; McElroy et al., 2013), supplemented by direct X-ray ionisation reactions, X-ray-induced ionisation and dissociation processes, and three-body reactions. The grain surface chemical network of Garrod et al. (2008) is used.
Input parameters assumed for the three types of astrochemical models are listed in Table 1. Unless otherwise stated, this Table gives the standard values for the physical parameters: the cosmic ray ionisation rate , the flux of secondary UV photons; the grain surface parameters: the dust-to-gass mass ratio , the grain diameter , the volumic mass of grains , the surface density , the diffusion-to-binding energy ratio , the number of chemically active monolayers , and the sticking coefficient of species heavier than H and \ceH2. The elemental abundances of species correspond to the set EA1 from Wakelam & Herbst (2008).
| Input parameters | Values |
|---|---|
| Standard physical parameters | |
| (s-1) | |
| (sec. UV) (cm-2 s-1) | |
| Grain surface parameters | |
| 0.01 | |
| (m) | 0.2 |
| (g cm-3) | 3 |
| (cm-2) | |
| 0.5 | |
| (MLs) | 4 |
| (heavy species) | 1 |
| Initial abundances | |
| (\ceH2) | 0.5 |
| (\ceHe) | 0.09 |
| (\ceC) | |
| (\ceN) | |
| (\ceO) | |
| (\ceSi) | |
| (\ceS) | |
| (\ceFe) | |
| (\ceNa) | |
| (\ceMg) | |
| (\ceCl) | |
3 Dark cloud origin?
Here we investigate whether the \ceO2 observed in 67P/C-G has a dark cloud origin, using the chemistry of \ceO2 ice and gas described in the previous Section. For this purpose, we use the Taquet astrochemical model presented in section 2.4. The Appendix presents a first parameter study, in which several surface and chemical parameters are varied, in order to reproduce the low abundances of the chemically related species \ceO3, \ceHO2, and \ceH2O2 with respect to \ceO2 seen in comet 67P/C-G. The low abundance of \ceO3 and \ceHO2 relative to \ceO2 can be explained when a small activation barrier of 300 K is introduced for the reactions O + \ceO2 and H + \ceO2, in agreement with the Monte-Carlo modelling of Lamberts et al. (2013). However, the abundance of \ceH2O2 is still overproduced by one order of magnitude, suggesting that other chemical processes might be at work. A second parameter-space study is then conducted to determine the range of physical conditions (e.g., dust temperature, number density, and cosmic-ray ionisation rate) over which \ceO2 ice and gas (and those for chemically-related species, \ceO3, \ceHO2, and \ceH2O2) reach abundances (relative to water ice) similar to that seen in 67P/C-G. Finally, the case of Oph A, where gas-phase \ceO2 has been detected in the gas phase, is revisited with the same chemical model.
3.1 Impact of physical and chemical parameters
The low temperature, in conjunction with the low flux of UV photons found in interstellar dark clouds, promotes the formation of interstellar ices. The ice chemical composition depends on various physical and chemical parameters as discussed in section 2.4. To investigate the formation and survival of \ceO2 under dark cloud conditions, a model grid is run in which the total density of H nuclei, , the gas and dust temperature, (assumed to be equal), the cosmic ray ionisation rate, , and the visual extinction, are varied following the methodology described in Taquet et al. (2012). Values explored in the model grid are listed in Table LABEL:grid_table, resulting in 500 models in total. In these models, the “standard” set of chemical parameters derived in the Appendix are assumed (see Table LABEL:grid_table).
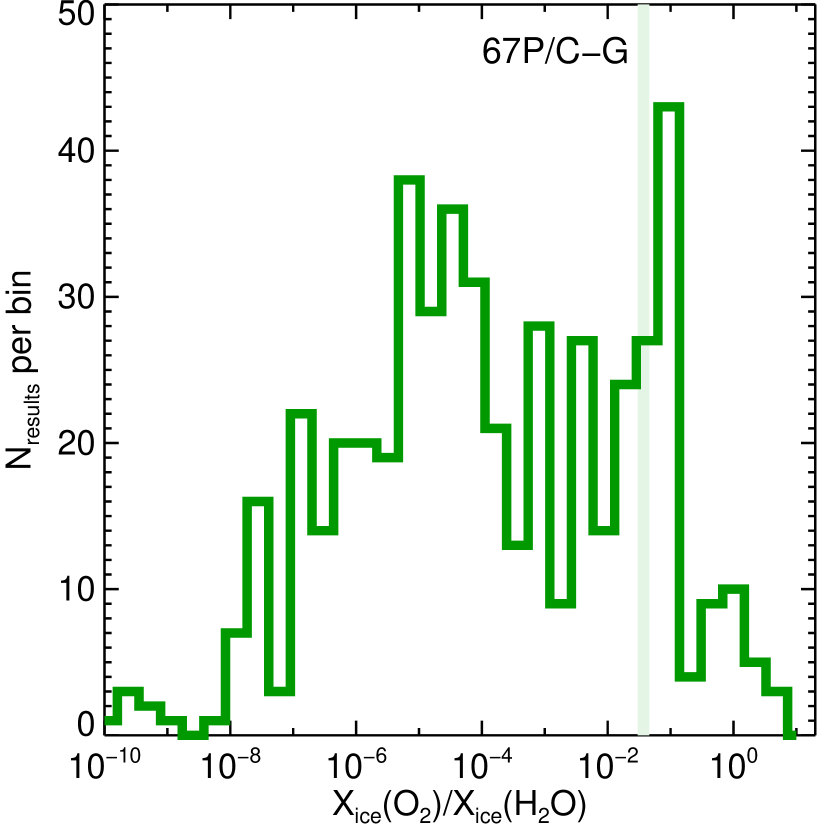
The abundances of all species in the reaction network are evolved from their assumed initial abundances (see Section 2.5) as a function of time only, i.e., assuming constant physical conditions. Figure 2 shows the distribution of abundances of solid \ceO2, and the chemically related species, \ceO3, \ceHO2, and \ceH2O2, relative to water ice, at the free-fall time, , defined as
| (2) |
where is the gravitational constant and is the proton mass. varies across the grid from to yr. Cores can have longer lifetimes, e. g. due to magnetic support, up to 10 . However, assuming a longer timescale does not change our conclusions because interstellar ices form in a timescale similar to . The results show that the formation and survival of solid \ceO2, and other reactive species, in interstellar ices, is strongly dependent upon the assumed physical conditions. The model grid shows a large dispersion of final abundances of solid \ceO2 from to relative to water ice (top panel of Figure 2). Due to its lower reactivity, hydrogen peroxide, \ceH2O2, shows a slightly more narrow final abundance dispersion, with most of the models predicting values between and (1 %) with respect to water ice (see bottom panel of Fig. 2). \ceHO2 is mostly formed in the ice mantle via the hydrogenation of \ceO2, and is converted into \ceH2O2 via a subsequent barrierless hydrogenation reaction, \ceO2 being a precursor of \ceH2O2; hence, its final abundance is governed by that of \ceO2 ice, and therefore follows a similar trend but lower by four orders of magnitude due its high reactivity. Ozone, formed from molecular oxygen via the \ceO2 + O reaction also displays a broad distribution of abundances but most of the models predict abundances lower than relative to water, due to the small O + \ceO2 barrier.
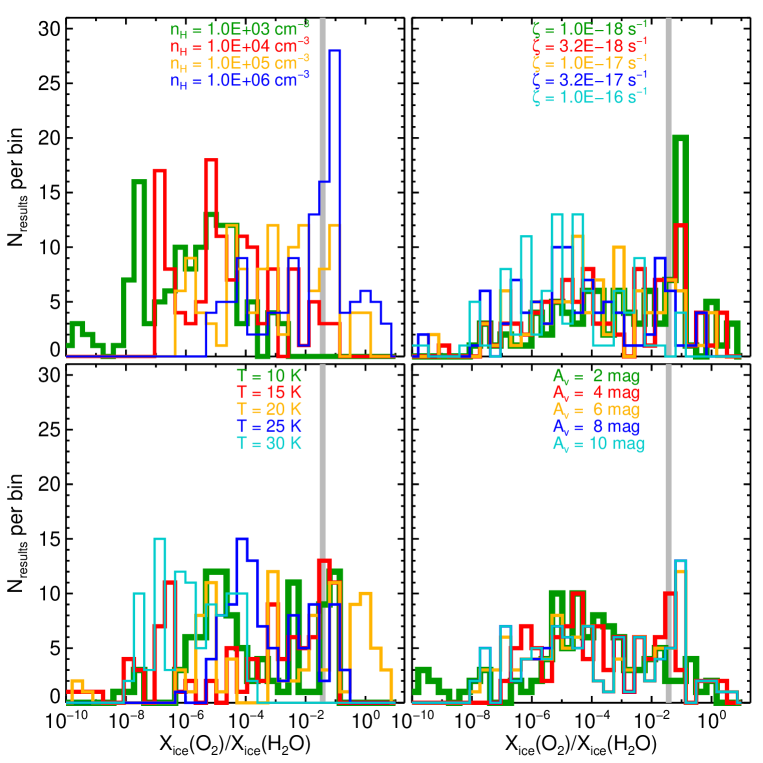
Figure 3 shows the distribution of the final abundance of solid \ceO2 relative to water ice, for the range of assumed values for each physical parameter varied in the model grid. High \ceO2 abundances (% relative to water ice) are obtained only for those models with high densities ( cm-3). As discussed in Section 2.4, higher gas densities result in a lower gas-phase H/O ratio, thereby increasing the rate of the association reaction between O atoms to form \ceO2 ice, and correspondingly decreasing the rate of the hydrogenation reactions, O + H and \ceO2 + H, which compete with \ceO2 ice formation, and destroy \ceO2 ice once formed, respectively.
An intermediate temperature of 20 K is also favoured because it enhances the mobility of oxygen atoms on the grain surfaces whilst at the same time allowing efficient sublimation of atomic H. This additionally enhances the rate of oxygen recombination forming \ceO2, with respect to the competing hydrogenation reactions. Models with lower temperatures of 10 or 15 K can also reproduce the \ceO2/\ceH2O of 4% if a high density of cm-3 is considered. Moreover, because the density of gas-phase H atoms increases linearly with the cosmic-ray ionisation rate, , a low value of also tends to favour the survival of \ceO2 ice. On the other hand, the visual extinction does not have a strong impact on the abundance of solid \ceO2 as the distributions of abundances obtained for the five visual extinction values are very similar. Thus, the final \ceO2 ice abundances depend more strongly upon the assumed gas density, temperature, and cosmic-ray ionisation rate, and high \ceO2 ice abundances occur when the initial atomic H/O ratio is low ().
To illustrate further the crucial impact of the density and the cosmic ray ionisation rate on the chemical composition of ices, Figure 4 shows the evolution of the abundances of \ceO2 and its chemically related species with respect to water ice as a function of the initial atomic H/O abundance ratio induced by a variation of the total density (assuming a constant of s-1) or a variation of the cosmic ray ionisation rate (assuming cm-3) at and K. According to equation (1), the initial atomic H/O abundance ratio follows the expression
| (3) |
assuming the grain parameter values listed in Table 1. For each temperature case, the evolution of the abundance ratios with the initial atomic H/O abundance ratio follows similar trends, suggesting that the initial atomic H/O abundance ratio, and consequently the / ratio, is the dominant parameter for the formation and survival of \ceO2 and its chemically related species in dark clouds. The formation of \ceO2 ice is strongly inhibited (%) for high initial H abundances ([H]/[O]) induced by high cosmic-ray ionisation rates and/or low densities, as it increases the rate of conversion of \ceO2 ice to \ceH2O ice. For low cosmic-ray ionisation rates or high densities inducing initial H/O ratios lower than , the formation of H atoms in the gas phase is no longer dominated by \ceH2 ionisation followed by dissociative recombination but by neutral-neutral reactions involving O atoms. The abundances of \ceO2 and other chemically-related species are consequently no longer influenced by nor and remain constant. The results here demonstrate that a high abundance of \ceO2, at a level similar to that measured in 67P/C-G, seems to require an initial H/O abundance ratio lower than (depending on the temperature) or, according to equation (3)
| (4) |
assuming the initial abundances listed in Table 1.
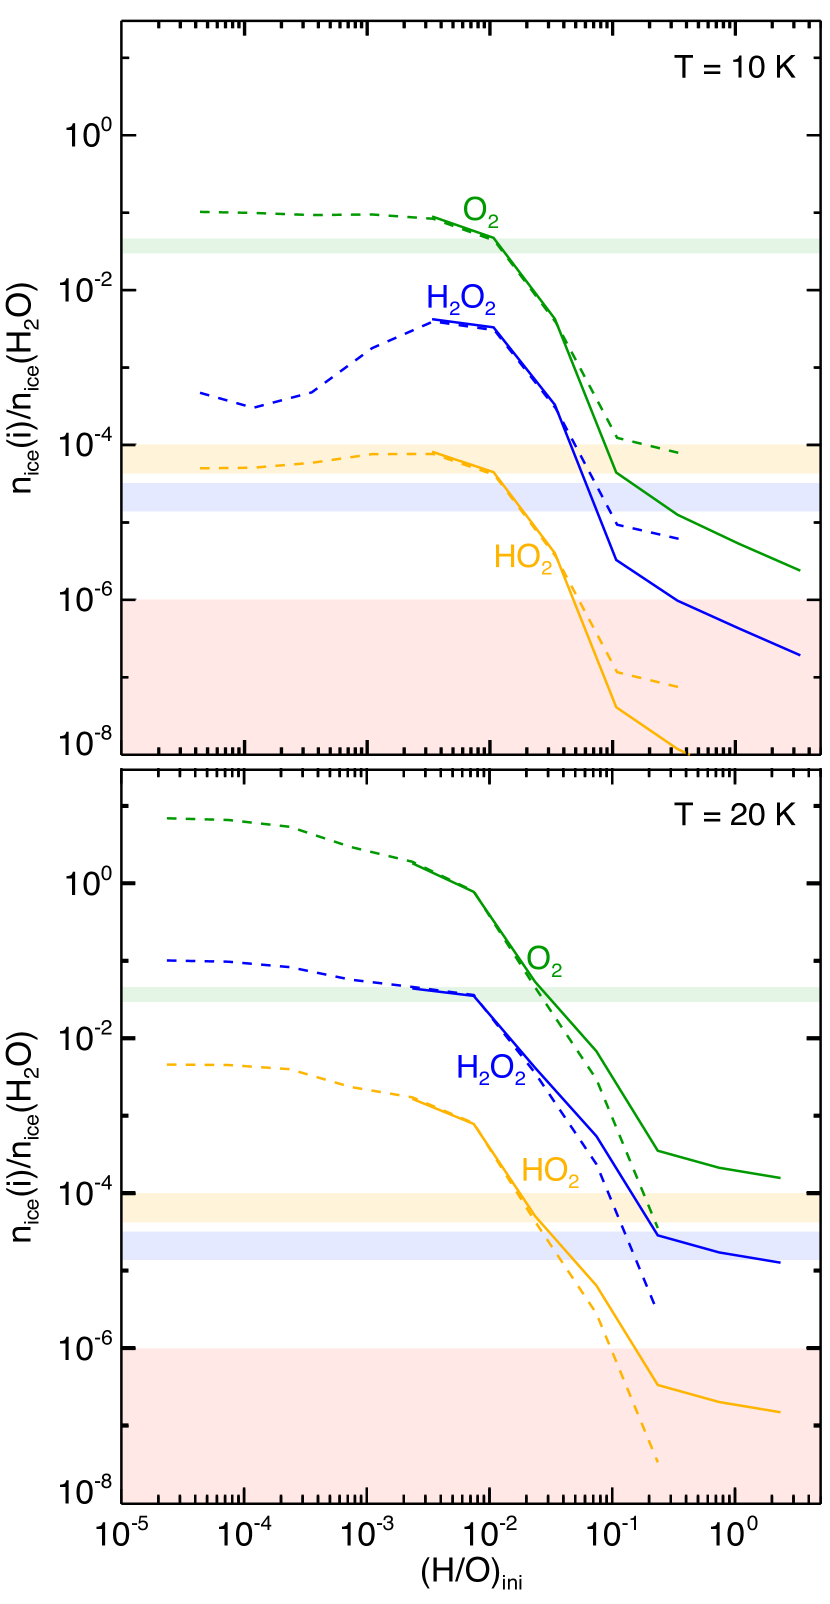
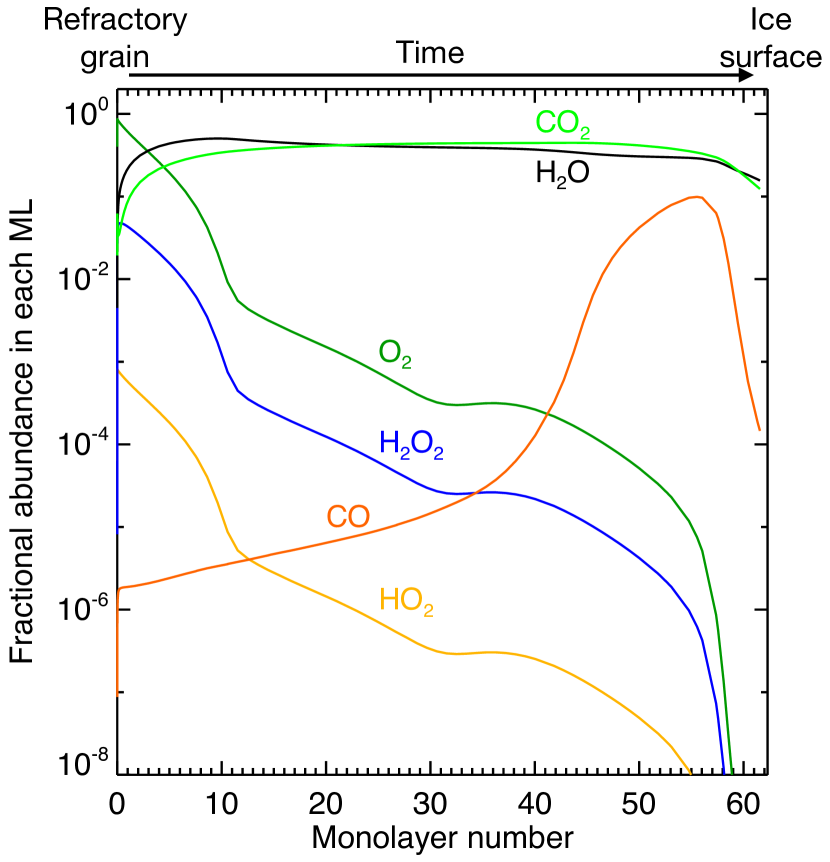
Figure 5 shows the chemical composition of the ice obtained for the model using the physical conditions that best reproduce the observations in comet 67P/C-G ( cm-3, K, s-1), and the chemical parameters derived in the Appendix. The fractional composition in each ice monolayer is plotted as function of monolayer number, i.e. the ice thickness that grows with time. At such a high density ( cm-3), hydrogenation reactions are less efficient due to the lower relative abundance of atomic H, and the freezeout timescales are sufficiently fast that reactive species can be trapped in the ice mantle before conversion into more stable molecules, like \ceH2O. The higher temperature (21 K) also enhances the mobility of heavier species, such \ceO, to increase the relative abundance of ice species such as \ceO2 and \ceCO2. As a consequence, the most abundant species are water and carbon dioxide. \ceO2 ice is mostly present in the innermost layers of the ice mantle and decreases in relative abundance towards the ice surface, reflecting the initial low ratio of H/O in the gas phase, but tends to be well mixed with \ceH2O ice. In contrast, \ceCO is mostly formed in the outer part of the ices, allowing an efficient sublimation, explaining its weak correlation with water in 67P/C-G.
3.2 The Oph A case
The Oph A core, located at a distance of 120 pc, constitutes the best test case for the water surface network and the production of \ceO2 in dark clouds because it is the only interstellar source so far where gas-phase \ceO2, \ceHO2, and \ceH2O2 have been detected (Bergman et al., 2011b; Liseau et al., 2012; Parise et al., 2012). The parameter study presented in the previous Section suggests that the physical conditions of Oph A, a high density ( cm-3), and a relatively warm gas temperature ( K) and dust temperature ( K), derived by Bergman et al. (2011a) are consistent with those which facilitate the formation and survival of \ceO2 ice.
O2, \ceO3, \ceHO2, and \ceH2O2 are mostly, and potentially only, produced via surface chemistry; hence their gas-phase abundances depend on their formation efficiency in interstellar ices and on the probability of desorption upon formation through chemical desorption (which is the dominant non-thermal desorption mechanism for these species in dark cloud conditions). As explained in Section 2.3, the chemical desorption probabilities assumed in this work are the theoretical values computed by Minissale et al. (2016) and Cazaux et al. (2016) for more than 20 reactions involved in the water and methanol chemical networks and vary between 0 and 70%. When data are not available, the chemical desorption probability is fixed to 1.2% (Garrod et al., 2007).
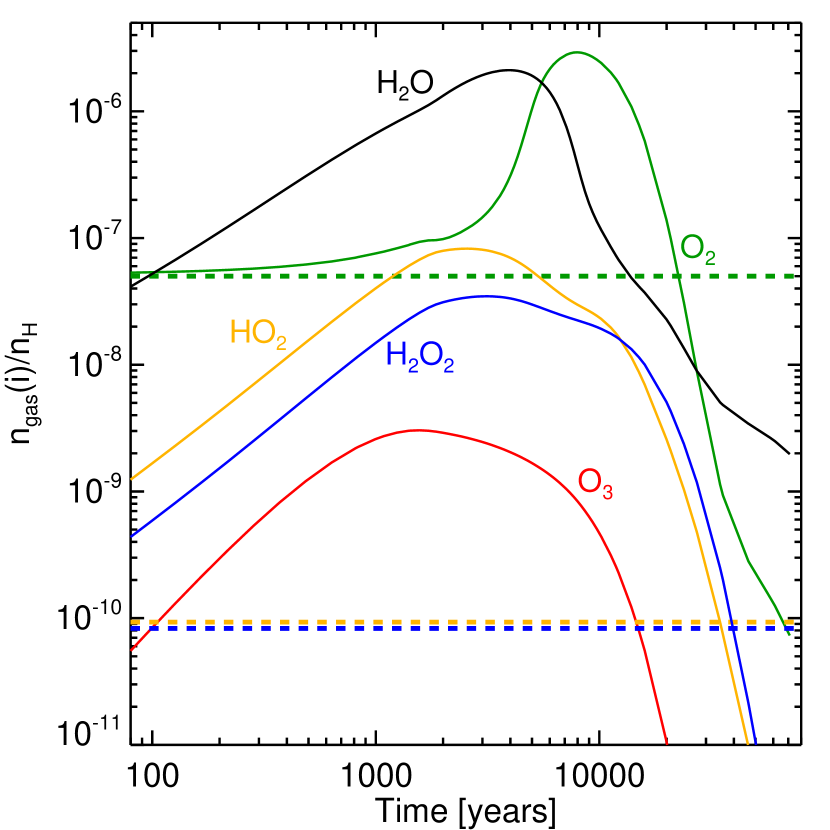
Figure 6 shows the temporal evolution of the gas phase abundances of \ceO2, \ceO3, \ceHO2, and \ceH2O2 when the theoretical chemical desorption probabilities from Minissale et al. (2016), considered as our standard values, are assumed. The high chemical desorption probability of the reaction O + O (68 %) allows for an efficient evaporation of \ceO2 in the gas phase upon formation on ices, inducing maximal abundances of a few obtained at 8000 years. At longer timescales, the \ceO2 production on ices is limited and the gas phase abundance of \ceO2 decreases sharply in a few yr due to its efficient freeze-out induced at the high density cm-3. The surface reactions \ceO2 + H and \ceHO2 + H forming \ceHO2 and \ceH2O2 have a lower chemical desorption probability of 1.4 and 0.5 % respectively. These values are nevertheless high enough to produce gaseous abundances of \ceHO2 and \ceH2O2 larger than . As a consequence, the model fails to simultaneously reproduce the gaseous abundances of \ceO2, \ceHO2, and \ceH2O2 derived in Oph A since the predicted \ceHO2 and \ceH2O2 abundances are higher than the observations by one order of magnitude when the predicted \ceO2 abundance reaches the observed value of at a time of years. Instead, their abundances are fit at a slightly longer time of years.
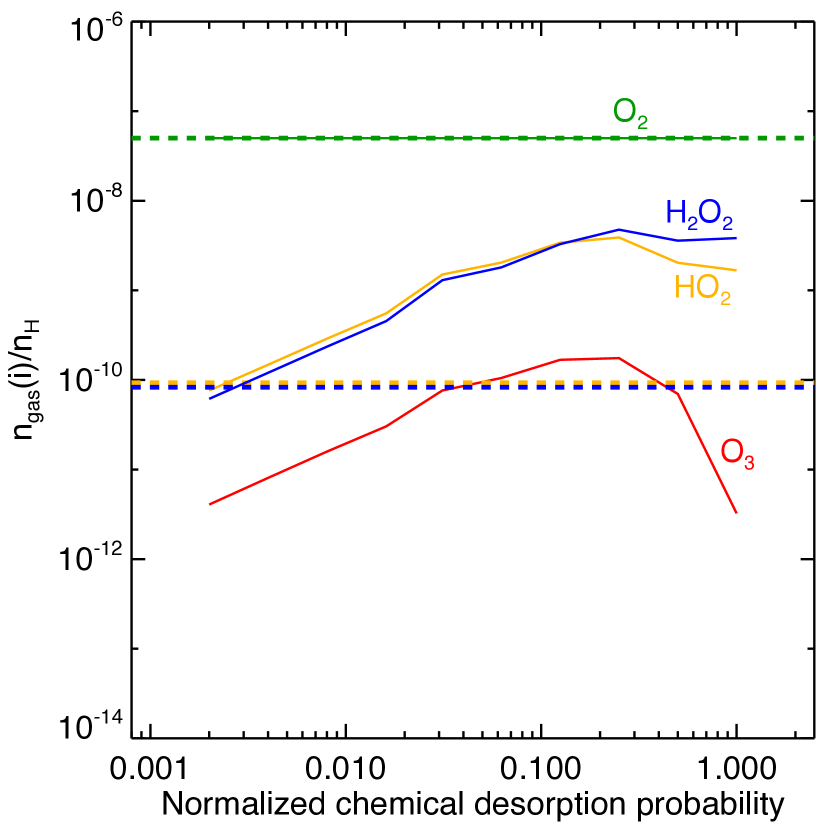
Du & Parise (2012) also performed a comprehensive modelling of the gas-ice chemistry occurring for the physical conditions found in Oph A by focusing on \ceHO2 and \ceH2O2. Their chemical network is similar to that used in this work but they used a two-phase model where the entire bulk ice is assumed to be chemically reactive, and adopted a high chemical desorption probability of 10 % for all surface reactions. Their model therefore predicts a high abundance of gaseous \ceHO2 and \ceH2O2, typically higher than for the first yr of their simulation, and finds good agreement with the observations, with abundances of , at , which is 10 times longer than the free-fall timescale expected at this density. At this timescale, the predicted \ceO2 abundance is one order of magnitude lower than the observed value of , a similar result as our standard model. Figure 7 shows the gas phase abundances of \ceHO2, \ceH2O2, and \ceO3 obtained when the predicted abundance of \ceO2 reaches the abundance observed toward Oph A by decreasing the chemical desorption probability of all reactions with respect to their standard theoretical value. The model using a normalized chemical desorption probability of 1 is the standard model. It can be seen that the \ceO2, \ceHO2, and \ceH2O2 abundances can be simultaneously reproduced when chemical desorption probabilities lower than the standard values by a factor of 500 are used, giving absolute values of 0.001 % for the reactions H + \ceO2 and H + \ceHO2.
4 Protostellar or disk formation origin?
The models presented and discussed in the preceding Section show that \ceO2 (and chemically related species) can be efficiently formed under dark cloud conditions, reaching abundance levels (relative to water ice) similar to that observed in comet 67P/C-G as long as the density is high, the ionisation rate is low, and the temperature is warm.
Here, we discuss the role of chemistry during protostellar collapse and protoplanetary disk formation on the observed abundance of \ceO2 in 67P/C-G. Material en route from the protostellar envelope into the disk is subject to increasing temperatures and UV radiation generated by the central (proto)star. We address the following two questions: (i) can \ceO2 gas and/or ice efficiently form during the formation of protostars and disks if the material composition is initially poor in molecular oxygen? and (ii) can \ceO2 ice co-formed with \ceH2O ice in the prestellar stage be delivered to the comet-forming zone in young protoplanetary disks without significant chemical processing? To address those questions, the chemical evolution from prestellar cores to forming disks is calculated.
4.1 Model description
For the protostellar disk formation model, the axisymmetric semi-analytical two-dimensional model developed by Visser et al. (2009, 2011) and adjusted by Harsono et al. (2013) is adopted. Briefly, the model describes the temporal evolution of the density and velocity fields following inside-out collapse and the formation of an accretion disk described by the -viscosity prescription (Shakura & Sunyaev, 1973; Lynden-Bell et al., 1974; Shu, 1977; Cassen & Moosman, 1981; Terebey et al., 1984). Additional details can be found in the original papers. The vertical structure of the disk is calculated assuming hydrostatic equilibrium. The dust temperature and UV radiation field, which are critical for the chemistry, are calculated at each time step by solving the radiative transfer with RADMC-3D111http://www.ita.uni-heidelberg.de/d̃ullemond/software/radmc-3d/. Outflow cavities are included by hand in a time-dependent manner (see Drozdovskaya et al., 2014, for details). Initially, the core has a power-law density distribution , where is the distance from the center of the core, with an outer boundary of AU and a total mass of 1 . Two values for the initial core rotation rate are investigated: s-1 and s-1, corresponding to cases 3 and 7 in Visser et al. (2009), respectively. The model follows the physical evolution until the end of the main accretion phase when the gas accretion from the envelope onto the star-disk system is almost complete.
Fluid parcels from the envelope to the disk are traced in the physical model, and the Furuya astrochemical model is used to follow the gas-ice chemical evolution calculated along each individual trajectory with the parameters described in Section 2.5.
A molecular cloud formation model is run to determine the composition of the gas and ice in the parent molecular cloud (Furuya et al., 2015). The chemistry is then evolved for an additional yr under prestellar core conditions to compute the abundances at the onset of collapse. The prestellar core density, temperature, and visual extinction are set to cm-3, 10 K, and 10 mag, respectively. At the onset of collapse, most oxygen (%) is contained in icy molecules, e.g., \ceH2O and CO ice. The \ceO2 gas and ice abundances with respect to hydrogen nuclei are only and , respectively, while the \ceH2O gas and ice abundances are and 10-4, respectively. Hence, the models using this set of initial abundances have a negligible \ceO2 ice abundance. Note that the \ceO2 gas abundance in both the molecular cloud formation stage and the prestellar core stage is lower than a few , which is consistent with the upper limits of the observationally derived \ceO2 gas abundance toward nearby cold ( K) clouds (Goldsmith et al., 2000; Pagani et al., 2003; Furuya et al., 2015).
Following on from the preceding Section, we also explore whether \ceO2 ice co-formed with \ceH2O ice in the prestellar stage can be delivered to the comet-forming midplanes of protoplanetary disks without significant alteration. To do this, we also run models with an artificially increased initial \ceO2 ice abundance, set to be 5% of that for \ceH2O ice.
4.2 Results
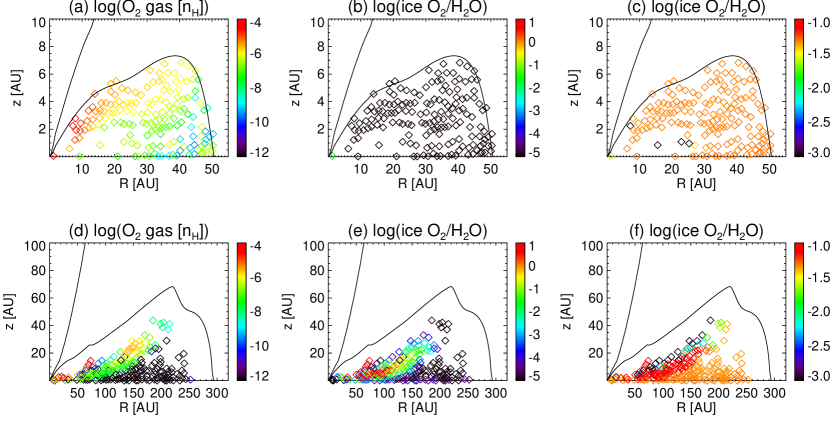
Figure 8 shows the spatial distributions of fluid parcels at the final time of the simulation in models with s-1 (infall dominated, top panels) and s-1 (spread dominated, lower panels). For the case in which the ice mantle is poor in \ceO2 ice at the onset of collapse, it is found that (i) some gaseous \ceO2 can form (up to 10-6) depending on the trajectory paths (left panels), and (ii) \ceO2 ice trapped within \ceH2O ice does not efficiently form en route into the disk (middle panels).
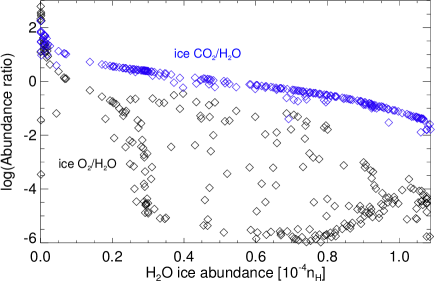
Given that most elemental oxygen is in ices (\ceH2O and \ceCO) at the onset of collapse, gaseous \ceO2 forms through photodissociation/desorption of \ceH2O ice by stellar UV photons in the warm (20 K) protostellar envelope, followed by subsequent gas-phase reactions (e.g., O + OH). The middle panels of Figure 8 show that the majority of parcels in each disk have a low final \ceO2/\ceH2O ice ratio, . However, the upper layers of the larger (i.e, higher case) disk do have several parcels with a \ceO2/\ceH2O ice ratio higher than (see panel (e) in Figure 8). Analysis of the ice composition shows that the \ceO2 ice is associated with \ceCO2 ice rather than with \ceH2O. Upon water ice photodissociation, the warm temperatures encountered through the protostellar envelope mean that \ceCO2 ice (re)formation is more favorable than that for \ceH2O ice. This is due to the weak binding energy of atomic hydrogen: the reaction to form \ceCO2 ice (via, e.g., CO + OH) proceeds faster that that for \ceH2O reformation (e.g., H + OH) as atomic hydrogen escapes back into the gas phase before it can diffuse and react with OH. Figure 9 shows the correlation among the abundances of \ceH2O ice, \ceO2 ice, and \ceCO2 ice in the model with s-1. In regions where \ceO2 ice is relatively abundant (1 % of \ceH2O ice), the \ceCO2 ice abundance is higher than or comparable to the \ceH2O ice abundance. Hence, these results show that it is difficult to form \ceO2 ice which is closely associated with \ceH2O ice during the process of core collapse and disk formation.
For the case that the simulations begin with an appreciable fraction of \ceO2 ice (5% relative to water ice), the \ceO2/\ceH2O ratio throughout both disks is largely preserved. This is indicated by the relatively homogenous distribution of orange points in panels (c) and (f) in Figure 8. Hence, \ceO2 which has a prestellar or molecular cloud origin, is able to survive the chemical processing en route into the comet-forming regions of protoplanetary disks. Trajectories which are an exception to this rule, are those which have been most exposed to stellar radiation; however, these trajectories are predominantly in the upper and closer-in layers of each protoplanetary disk and likely do not contribute to the composition of the comet-building material. This is consistent with the earlier finding by Visser et al. (2011) that most water ice is delivered to protoplanetary disks without alteration or sublimation.
5 O2 formation and trapping in disks induced by luminosity outbursts?
5.1 Motivation
The simulations in the previous Section show that \ceO2 can be produced in the gas phase in the intermediate layers of relatively warm forming disks (see panel (a) in Figure 8), with an abundance a few percent that of water ice (i.e., a fractional abundance of with respect to ). The origin of the gas-phase \ceO2 is driven by photoprocessing of water ice by stellar UV photons en route into the disk, which releases photofragments required for forming \ceO2 (O and OH) into the gas-phase. Relatively high abundances of gas-phase \ceO2 are also predicted in the inner regions of protoplanetary disks around already formed stars (e.g., Walsh et al., 2014, 2015). The origin of gas-phase \ceO2 in these models is similar to that in forming disks, except that the release of photofragments of water ice photodissociation occurs over the lifetime of the disk ( yr) and is driven by the UV photons generated near the disk midplane by the interaction of cosmic rays with \ceH2. \ceO2 persists in the gas-phase near the disk midplane because its volatility is such that it cannot freezeout at the midplane temperatures within a few 10’s of AU (typically K).
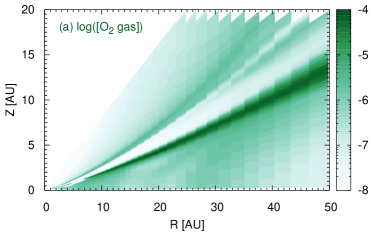
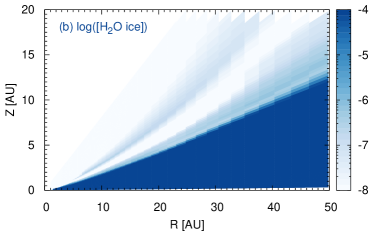
Figure 10 shows the fractional abundance of \ceO2 gas (left) and \ceH2O ice (right) as a function of disk radius and height for a protoplanetary disk around a T Tauri star (data from Walsh et al., 2014). Similar abundances are seen for disks around both cooler (i.e., M dwarf) and hotter stars (i.e., Herbig Ae) stars, except that the water snowline is shifted to smaller and larger radii, respectively (see Walsh et al., 2015). The results show that \ceO2 gas can reach an abundance a few percent of that of water ice in the comet-formation zone ( AU).
The main issue with this scenario is whether a mechanism exists whereby gas-phase \ceO2 formed near the disk midplane, in either forming disks or more evolved disks, can become entrapped within, and thus associated with, the water-rich ice mantle, as seen in comet 67P/C-G. Observational and theoretical studies suggest that the luminosity evolution of low-mass stars is highly variable, with frequent and strong eruptive bursts, followed by long periods of relative quiescence (e.g., Herbig, 1977; Hartmann & Kenyon, 1985; Vorobyov & Basu, 2005). Such luminosity outbursts could have a strong impact on the morphology and the chemical composition of ices near the protoplanetary disk midplane. The sudden temperature variations induced by short luminosity outbursts could gradually recycle the content of ices into the gas phase and modify their chemical structure via rapid and efficient freeze-out. If the luminosity outburst is sufficiently strong, warm gas-phase formation of molecular oxygen could be triggered by the evaporation of water ice, if the peak temperature during the outburst is higher than K. \ceO2 might then be recondensed together with water post outburst, if the cooling timescale is shorter than the freeze-out timescale i.e., , and also if the temperature reached after post outburst is lower than the condensation temperature of \ceO2 ( K).
An increase in temperature from to K during an outburst, corresponds roughly to an increase in luminosity by a factor of assuming that the temperature in the disk and the central luminosity are linked through Stefan-Boltzmann’s law. The recent hydrodynamical model by Vorobyov & Basu (2015) shows that a dozen of such strong luminosity outbursts, with typical durations of yr, may occur during the disk lifetime. The exact number depends on the physical properties of the collapsing core and the disk.
5.2 Model description
The scenario of formation and recondensation of \ceO2 induced by a series of outburst events in disks is investigated by a series of outbursts occurring every yr for a total timescale of yr. The astrochemical model and chemical network used are described in Section 2.5, while the assumed physical conditions are for a single point, motivated by protoplanetary disk models. Initial ice abundances are the median values derived by Öberg et al. (2011) from interstellar ice observations towards low-mass protostars. Thus it is assumed that the ice mantles are initially poor in \ceO2. The pre-outburst and post-outburst temperature is set to 20 K, corresponding approximately to the freeze-out temperature of \ceO2. Protoplanetary disk models suggest that the corresponding midplane density at this point is cm-3 (e.g., Furuya et al., 2013; Walsh et al., 2014); however, the exact relation between the dust temperature and gas density near protoplanetary disk midplanes depends on numerous factors including disk surface density (or mass), stellar spectral type, and the dust properties.
Gas phase formation of \ceO2 is triggered by the photodissociation of water into H and OH and consequently, is highly dependent on the assumed cosmic-ray ionisation rate, , which is thought to be impeded near the disk midplane with respect to interstellar values (e.g., Cleeves et al., 2013). The impact of on the formation of \ceO2 is investigated by considering two values which cover the possible range, and s-1.
The freeze-out timescale of a neutral species onto grains is given by
| (5) |
where is the dust-to-gass mass ratio, the volumic mass of grains, the mean grain diameter, and the weight of species . Grain growth is expected to occur near protoplanetary disk midplanes. Vasyunin et al. (2011) predict an average size of 1 m with a dust-to-gass mass ratio of 0.01 in the midplane but the average size sharply decreases with altitude. Therefore, two grain sizes are considered and 1 m. For a fixed dust-to-gas mass ratio, , a larger grain size will increase the freezeout timescale, , relative to the cooling timescale, , due to the reduction in total available dust-grain surface area. On the other hand, an increase in , perhaps due to settling and/or radial drift, will increase the total available grain surface area and will reduce the freezeout timescale.
Six models are run to investigate the impact of various parameters on the formation and the recondensation of \ceO2 during outbursts which last a timescale, .
-
1.
Standard model with m, s-1, yr, K.
-
2.
Same as 1 but with m.
-
3.
Same as 1 but with s-1.
-
4.
Same as 1 but with yr.
-
5.
Same as 1 but with K.
-
6.
Same as 1 but with an initial \ceO2 abundance of 5 % relative to water.
Model 6 is included to test the hypothesis that primordial \ceO2, formed during the molecular cloud stage, survives both transport into the the forming protoplanetary disk and luminosity outbursts in the disk midplane. For the standard set of parameters (i.e., model 1), the freezeout timescale following a burst is yr (see Equation 5). This is likely longer than the cooling timescale (from 100 to 20 K), expected to be shorter than the duration of the outburst ( yr; Vorobyov & Basu, 2015).
5.3 Results
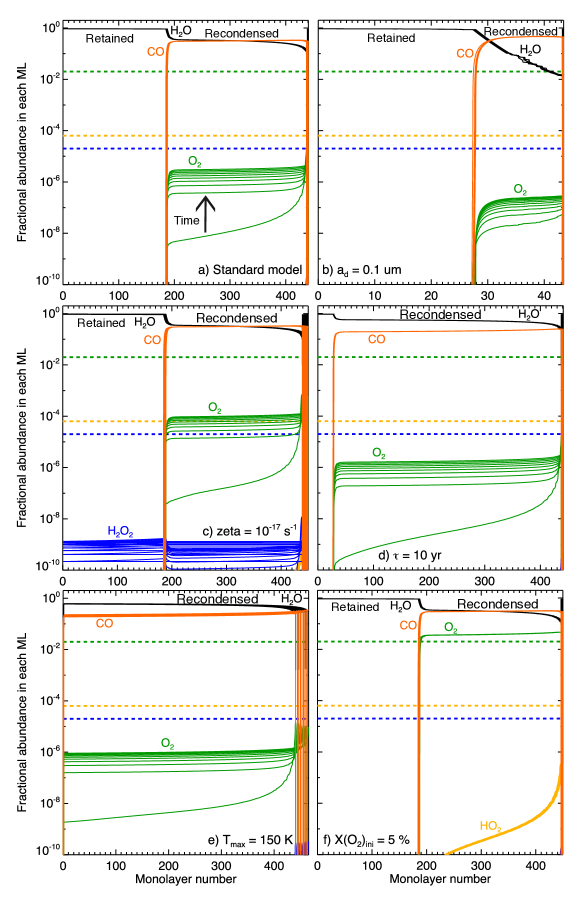
Figure 11 shows the fractional composition of ices in each monolayer as a function of monolayer, for the six models described above. Each line represents the abundance of each species prior to the next outburst (i.e., following each period of cooling and quiescence). In general, regardless of the assumed physical parameters, the volatile component of the ice mantle increases with time. The ice profile is composed of two main parts: i) a volatile-free deeper ice mantle mostly composed of water ice and other non-volatile species, such as \ceCH3OH, that primarily remain on grains during the outbursts because the temperature reached during the outburst is only slightly higher than their evaporation temperature, and ii) an upper ice mantle composed of water ice, but also of volatile species, such as CO, \ceO2, and \ceN2, that freezeout during the post-outburst cooling. The deeper and volatile-free ice mantle increases in mass/depth with the duration of the outburst (compare panels a) and d) in Figure 11) and with decreasing grain size that increases the surface area of dust (compare panels a) and b) in Figure 11).
The fraction of \ceO2 trapped in the ice mantle increases with the outburst duration, the grain size, and the cosmic-ray ionisation rate, , all parameters which favour the formation of gaseous \ceO2 from water during the outburst. Increasing the grain size decreases the total grain cross-sectional area and therefore the accretion rate of gas-phase species onto the ice mantle, allowing water and other species to spend more time in the gas phase for reaction. A higher increases the production of OH from the photodissociation of water vapour, necessary to form \ceO2. Allowing the peak temperature during outburst to reach values higher than the evaporation temperature of water ice ( K, panel e) in Figure 11), results in full sublimation of the ice mantle prior to recondensation. However, the enhanced abundance of water released into the gas phase does not significantly enhance the abundance of \ceO2 formed, and subsequently trapped. in the ice mantle. The luminosity outburst period and duration considered here are potentially too short and also too infrequent to reproduce the high amount of \ceO2 observed in 67P/C-G. Maximum \ceO2 abundances of a few % only are predicted.
Results for the calculation with 5% of \ceO2 (relative to water ice) already present in the ice, show that \ceO2 can survive and be efficiently trapped within the water-rich ice mantle following a series of luminosity outbursts. Hence, \ceO2 may become associated with water ice in the disk midplane via release and recondensation driven by outbursts. However, other volatile species such as CO and \ceN2 are also trapped within the water ice, which is in contradiction with the observations towards 67P/C-G. CO and \ceN2 are shown to be depleted in 67P/C-G relative to interstellar values, and the molecules are not strongly correlated with water in the comet coma, converse to the case for \ceO2 (Rubin et al., 2015a; Bieler et al., 2015). Note also that interstellar ices produced after luminosity outbursts are likely amorphous in structure (Kouchi et al., 1994).
6 Summary
In this work, sophisticated astrochemical models are used to investigate the chemical and physical origin of molecular oxygen in comet 67P/C-G as observed with Rosetta/ROSINA. The observations show that molecular oxygen is not only strongly associated with water, but is also the fourth most abundant molecule in the coma, at 4% of the water abundance (Bieler et al., 2015).
We tested the formation and survival of \ceO2 (and related species) in models covering a range of dark cloud physical conditions (temperature, density, and cosmic-ray ionisation rate). We found that the efficiency of the formation of molecular oxygen increases for higher densities ( cm-3), moderate temperatures ( K), and moderate ionisation rates ( s-1). These conditions lower the ratio of H/O in the gas phase, thereby impeding the conversion of \ceO2 ice into \ceH2O ice. These parameters are found to be in good agreement with the physical conditions for the dark cloud Oph A, one of the two interstellar regions where \ceO2 has been detected. The high \ceO2 abundances do not require photolysis of bulk ice as the main process but are the result of surface reactions building up the ice layers.
We next tested whether molecular oxygen can be efficiently formed in the ice mantle during protostellar disk formation. For models in which the initial ice composition is assumed to be poor in \ceO2, \ceO2 can produced only through gas phase chemistry induced by processing of the water-rich ice mantle by stellar UV radiation in the intermediate-layers of the protoplanetary disk, with abundance levels similar to that in 67P/C-G but ices in the disk midplane remain poor in \ceO2. For models in which the ice mantles were originally abundant in molecular oxygen (% relative to water), for both disk models, we find that the oxygen is delivered to the comet-forming zone without sublimation nor alteration. Hence, if molecular oxygen has a primordial origin as suggested by the dark cloud models, then it can survive transport into the protoplanetary disk.
Given that gas-phase \ceO2 can form near protoplanetary disk midplanes, and reach abundances relative to water ice similar to that in 67P/C-G, we finally tested whether luminosity outbursts which increase the local temperature to K, aid the formation and entrapment of gas-phase \ceO2 into the water-rich ice mantle. Although laboratory experiments show that \ceO2 can be efficiently formed within water ices during the ice recondensation through radiolysis (Teolis et al., 2006), we consider this less likely because the cosmic-ray ionisation rate and energetic particles from the (pre)solar wind are expected to be significantly attenuated near the disk midplane. It is found that the maximum amount of \ceO2 formed during luminosity outbursts and then trapped within the ice mantle during the cooling depends on several parameters, such as grain size, ionisation rate, or the outburst duration, but never exceeds %. Assuming an initial \ceO2 abundance of % relative to water ice results in an efficient trapping of \ceO2 within the water-ice mantle due to the fast cooling after the outburst. However, in that case also other volatile species, such as CO and \ceN2, become trapped, which is in contradiction with observations towards 67P/C-G.
In summary, the models presented here favour the scenario that molecular oxygen in 67P/C-G has a primordial origin (i.e., formed in the molecular cloud) and has survived transport through the protostellar envelope and into the comet-forming regions of protoplanetary disks. The “primordial” origin of \ceO2 is in good agreement with the conclusions of Mousis et al. (2016). However, while Mousis et al. (2016) invoked radiolysis to efficiently convert water ice to \ceO2, we find that the entrapment and strong association with water ice combined with low abundance of species like \ceH2O2, \ceHO2, or\ceO3 can alternatively be explained by an efficient \ceO2 formation at the surface of interstellar ices through oxygen atom recombination in relatively warmer ( K) and denser ( cm-3) conditions than usually expected in dark clouds. The weak correlation of CO and \ceN2 with water seen in 67P/C-G is explained by a later formation of these species in dark clouds with respect to \ceO2 and water. This picture would therefore be consistent with the physical and chemical properties of our Solar System, such as the presence of short-lived radio isotopes in meteorites or the orbits of Solar System planets, suggesting that our Solar System was born in a dense cluster of stars (see Adams, 2010).
Acknowledgements
The authors thank T. Lamberts, E. Bergin, and the ROSINA team, especially K. Altwegg, M. Rubin, and A. Bieler, for fruitful discussions and comments on the manuscript and M. Persson for making Figure 1. Astrochemistry in Leiden is supported by the European Union A-ERC grant 291141 CHEMPLAN, by the Netherlands Research School for Astronomy (NOVA), by a Royal Netherlands Academy of Arts and Sciences (KNAW) professor prize. K.F. is supported by the Research Fellowship from the Japan Society for the Promotion of Science (JSPS). C. W. acknowledges support from the Netherlands Organization for Scientific Research (NWO, program 639.041.335).
References
- Acharyya et al. (2007) Acharyya, K., Fuchs, G. W., Fraser, H. J., van Dishoeck, E. F., & Linnartz, H. 2007, A&A, 466, 1005
- Adams (2010) Adams, F. C. 2010, ARA&A, 48, 47
- Altwegg et al. (2015) Altwegg, K., Balsiger, H., Bar-Nun, A. et al. 2015, Science, 347, 27
- Atkinson et al. (2004) Atkinson, R., Baulch, D. L., Cox, R. A. et al. 2004, Atmospheric Chemistry and Physics, 4, 1461
- Andersson et al. (2006) Andersson, S., Al-Halabi, A., Kroes, G.J., & van Dishoeck, E. F. 2006, J. Chem. Phys., 124, 4715
- Andersson & van Dishoeck (2008) Andersson, S. & van Dishoeck, E. F. 2008, A&A, 491, 907
- Arasa et al. (2015) Arasa, C., Koning, J., Kroes, G.-J., Walsh, C., & van Dishoeck, E. F. 2015, A&A, 575, A121
- Balsiger et al. (2007) Balsiger, H., Altwegg, K., Boschler, P., et al. 2007, Space Sci. Rev., 128, 745
- Baragiola et al. (2002) Baragiola, R. A., Atteberry, C. L., Dukes, C. A. et al. 2002, Nuclear Instruments and Methods in Physics Research B, B, 720
- Bergeron et al. (2008) Bergeron, H., Rougeau, N., Sidis, V., et al. 2008, J. Phys. Chem. A, 112, 11921
- Bergman et al. (2011a) Bergman, P., Parise, B., Liseau, R., et al. 2011a, A&A, 527, A39
- Bergman et al. (2011b) Bergman, P., Parise, B., Liseau, R., et al. 2011b, A&A, 531, L8
- Bieler et al. (2015) Bieler, A., Altwegg, K., Balsinger, H., et al. 2015, Nature, 526, 678
- Cassen & Moosman (1981) Cassen, P., & Moosman, A. 1981, Icarus, 48, 353
- Cazaux et al. (2016) Cazaux, S., Minissale, M., Dulieu, F. and Hocuk, S. 2016, A&A, 585, A55
- Chen et al. (2014) Chen, J-H., Goldsmith, P. F., Viti, S. et al. 2014, ApJ, 793, 111
- Cleeves et al. (2013) Cleeves, L. I., Adams, F. C., & Bergin, E. A. 2013, ApJ, 772, 5
- Cleeves et al. (2014) Cleeves, L. I., Bergin, E. A., Alexander, C. M. O. et al. 2014, Science, 345, 1590
- Collings et al. (2003) Collings, M. P., Dever, J. W., Fraser, H. J., McCoustra, M. R. S., & Williams, D. A. 2003, ApJ, 583, 1058
- Collings et al. (2004) Collings, M. P., Anderson, M. A., Chen, R., et al. 2004, MNRAS, 354, 1133
- Collings et al. (2015) Collings, M. P., Frankland, V. L., Lasne, J., et al. 2015, MNRAS, 449, 1826
- Congiu et al. (2014) Congiu, E., Minissale, M., Baouche, S., et al. 2014, in Faraday Discussions, 168, 151
- Cuppen & Herbst (2007) Cuppen, H. M. and Herbst, E. 2007, ApJ, 668, 294
- Cuppen et al. (2010) Cuppen, H. M., Ioppolo, S., Romanzin, C., & Linnartz, H. 2010a, Phys. Chem. Chem. Phys. (Incorporating Faraday Transactions), 12, 12077
- Drozdovskaya et al. (2014) Drozdovskaya, M. N., Walsh, C., Visser, R., Harsono, D., & van Dishoeck, E. F. 2014, MNRAS, 445, 913
- Du & Parise (2012) Du, F. and Parise, B. 2012, A&A, 538, A91
- Dulieu (2011) Dulieu, F. 2011, IAU Symposium, 280, 405
- Eistrup et al (2016) Eistrup, C., Walsh, C, & van Dishoeck, E. F. 2016, A&A, in preparation
- Fayolle et al. (2013) Fayolle, E. C., Bertin, M., Romanzin, C., et al. 2013, A&A, 556, A122
- Fuchs et al. (2006) Fuchs, G., Acharyya, K., Bisschop, S. E., et al. 2006, Faraday Disc., 133, 331
- Furuya et al. (2013) Furuya, K., Aikawa, Y., Nomura, H., Hersant, F., & Wakelam, V. 2013, ApJ, 779, 11
- Furuya et al. (2015) Furuya, K., Aikawa, Y, Hincelin, U., Hassel, G., Bergin, E. A., Vasyunin, A. I., & Herbst, E., 2015, 584, A124
- Furuya et al. (2016) Furuya, K., Drozdovskaya, M., Visser, R. et al. 2016, submitted to A&A
- Garrod & Herbst (2006) Garrod, R. T., & Herbst, E. 2006, A&A, 457, 927
- Garrod et al. (2007) Garrod, R. T., Wakelam, V., & Herbst, E. 2007, 467, 1103
- Garrod et al. (2008) Garrod, R. T., Weaver, S. L. W. and Herbst, E. 2008, ApJ, 682, 283-302
- Goldsmith et al. (2000) Goldsmith, P. F., Melnick, G. J., Bergin, E. A., et al. 2000, ApJ, 539, L123
- Goldsmith et al. (2011) Goldsmith, P. F., Liseau, R., Bell, T. A., et al. 2011, ApJ, 737, 96
- Hall et al. (1995) Hall, D. T., Strobel. D. F., Feldman, P. D., McGrath, M. A., & Weaver, H. A. 1995, Nature, 373, 677
- Hand & Carlson (2011) Hand, K. P. and Carlson, R. W. 2011, Icarus, 215, 226
- Harada et al. (2010) Harada, N., Herbst, R., & Wakelam, V. 2010, ApJ, 721, 1570
- Harsono et al. (2013) Harsono D., Visser R., Bruderer S., van Dishoeck E. F., & Kristensen L. E., 2013, A&A, 555, A45
- Hasegawa & Herbst (1993) Hasegawa, T. I. and Herbst, E. 1993, MNRAS, 263, 589-606
- He et al. (2015) He, J., Shi, J., Hopkins, T., et al. 2015, ApJ, 801, 120
- Heays et al. (2016) Heays, A. N., Bosman, A. D., & van Dishoeck, E. F. 2016, ApJS, submitted
- Herbig (1977) Herbig, G. H. 1977, ApJ, 217, 693
- Hincelin et al. (2011) Hincelin, U., Wakelam, V., Hersant, F. et al. 2011, A&A, 530, A61
- Ioppolo et al. (2008) Ioppolo, S., Cuppen, H. M., Romanzin, C., van Dishoeck, E. F., & Linnartz, H. 2008, ApJ, 686, 1474
- Ioppolo et al. (2010) Ioppolo, S., Cuppen, H. M., Romanzin, C., van Dishoeck, E. F. and Linnartz, H., 2010, Physical Chemistry Chemical Physics (Incorporating Faraday Transactions), 12, 12065
- Jaycock & Parfitt (1986) Jaycock, M. J. & Parfitt, G. D. 1986, Chemistry of Interfaces (Wiley and Sons, New York)
- Karssemeijer & Cuppen (2014) Karssemeijer, L. J. and Cuppen, H. M. 2014, A&A, 569, A107
- Katz et al. (1999) Katz, N., Furman, I., Biham, O., Pirronello, V., & Vidali, G. 1999, ApJ, 522, 305
- Hartmann & Kenyon (1985) Hartmann, L. & Kenyon, S. J. 1985, ApJ, 299, 462
- Kouchi et al. (1994) Kouchi, A., Yamamoto, T., Kozasa, T., Kuroda, T., & Greenberg, J. M. 1994, A&A, 290, 1009
- Lamberts et al. (2013) Lamberts, T., Cuppen, H. M., Ioppolo, S. and Linnartz, H. 2013, Phys. Chem. Chem. Phys., 15, 8287
- Larsson et al. (2007) Larsson, B., Liseau, L., Pagani, L., et al. 2007, A&A, 466, 999
- Liseau et al. (2010) Liseau, R., Larsson, B., Bergman, P., et al. 2010, A&A, 510, A98
- Liseau et al. (2012) Liseau, R., Goldsmith, P. F., Larsson, B., et al. 2012, A&A, 541, A73
- Loeffler et al. (2006) Loeffler, M. J., Raut, U., Vidal, R. A., Baragiola, R. A., and Carlson, R. W. 2006, Icarus, 180, 265
- Lynden-Bell et al. (1974) Lynden-Bell, D. & Pringle, J. E. 1974, MNRAS, 168, 603
- Matar et al. (2008) Matar, E., Congiu, E., Dulieu, F., Momeni, A., & Lemaire, J. L. 2008, A&A, 492, L17
- Matich et al. (1993) Matich, A. J., Bakker, M. G., Lennon, D. et al. 1993, The Journal of Physical Chemistry, 97, 10539-10553
- McElroy et al. (2013) McElroy, D., Walsh, C., Markwick, A. J., Cordiner, M. A., Smith, K. and Millar, T. J. 2013, A&A, 550, A36
- Melius & Blint (1979) Melius, C. F., and Blint, R. J. 1979, Chem. Phys. Lett., 64, 183
- Melnick & Kaufman (2015) Melnick, G. J. & Kaufman, M. J. 2015, ApJ, 806, 227
- Minissale et al. (2014) Minissale, M., Congiu, E. and Dulieu, F. 2014, J. Chem. Phys., 140, 074705
- Minissale & Dulieu (2014) Minissale, M. & Dulieu, F. 2014, J. Chem. Phys., 141, 014304
- Minissale et al. (2016) Minissale, M., Dulieu, F., Cazaux, S., & Hocuk, S. 2016, A&A, 585, A24
- Mousis et al. (2016) Mousis, O., Ronnet, T., Brugger, B. et al. 2016, accepted in ApJL
- Miyauchi et al. (2008) Miyauchi, N., Hidaka, H., Chigai, T., Nagaoka, A., Watanabe, N., & Kouchi, A. 2008, Chem. Phys. Lett., 456, 27
- Noble et al. (2012) Noble, J., Congui, E., Dulieu, F., & Fraser, H. J. 2012, MNRAS, 421, 768
- Öberg et al. (2009) Öberg, K. I., Linnartz, H., Visser, R., & van Dishoeck, E. F. 2009, ApJ, 693, 1209
- Öberg et al. (2011) Öberg, K. I., Boogert, A. C. A., Pontopiddan, K. M., et al. 2011, ApJ, 740, 109
- Pagani et al. (2003) Pagani, L., Olofsson, A. O. H., Bergmann, P., et al. 2003, A&A, 402, L77
- Parise et al. (2012) Parise, B., Bergman, P., & Du, F. 2012, A&A, 541, L11
- Perets et al. (2005) Perets, H. B., Biham, O., Manicó, G., et al. 2005, ApJ, 627, 850
- Pontopiddan et al. (2003) Pontoppidan, K. M., Fraser, H. J., Dartois, E. et al. 2003, A&A, 408, 981-1007
- Prasad & Tarafdar (1983) Prasad, S. S. & Tarafdar, S. P. 1983, ApJ, 267, 603
- Rimola et al. (2014) Rimola, A., Taquet, V., Ugliengo, P. 2014, A&A, 572, A70
- Rubin et al. (2015a) Rubin, M., Altwegg, K., Balsiger, H., et al. 2015a, Science, 348, 232
- Rubin et al. (2015b) Rubin, M., Altwegg, K., van Dishoeck, E. F. & Schwehm, G. 2015b, ApJ, 815, L11
- Shakura & Sunyaev (1973) Shakura, N. I., & Sunyaev, R. A. 1973, A&A, 24, 337
- Shu (1977) Shu F. H., 1977, ApJ, 214, 488
- Sieger et al. (1998) Sieger, M. T., Simpson, W. C. and Orlando, T. M. 1998, Nature, 394, 554-556
- Slanger & Black (1982) Slanger, T. G. & Black, G. 1982, J. Chem. Phys., 77, 2432
- Snellen et al. (2013) Snellen, I. A. G., de Kok, R. J., le Poole, R., Brogi, M., & Birkby, J. 2013, ApJ, 764, 182
- Spencer et al. (1995) Spencer, J. R., Calvin, W. M., & Person, M. J. 1995, Journal for Geophysical Research, 100, 19049
- Taquet et al. (2012) Taquet, V., Ceccarelli, C., & Kahane, C. 2012, A&A, 538, A42
- Taquet et al. (2013) Taquet, V., Peters, P., Kahane, C. et al. 2013, A&A, 550, A127
- Taquet et al. (2014) Taquet, V., Charnley, S. B., Sipilä, O. 2014, ApJ, 791, 1
- Teolis et al. (2006) Teolis, B. D., Loeffler, M. J., Raut, U., Famá, M. and Baragiola, R. A. 2005, ApJ, 644, L141
- Teolis et al. (2010) Teolis, B. D., Jones, G. H., Miles, P. F., et al. 2010, Science, 330, 1813
- Terebey et al. (1984) Terebey, S., Shu, F. H., & Cassen, P. 1984, ApJ, 286, 529
- Tielens & Hagen (1982) Tielens, A. G. G. M., & Hagen, W., A&A, 114, 245
- Tielens & Allamandola (1987) Tielens, A. G. G. M., & Allamandola, L. J. 1987, Interstellar Processes, eds. D. J. Hollenbach, & H. A. Thronson, 397
- Tielens (2005) Tielens, A. G. G. M. 2005, The Physics and Chemistry of the Interstellar Medium (Cambridge University Press)
- Tielens (2013) Tielens, A. G. G. M. 2013, Rev. Mod. Phys., 85, 1021
- Vandenbussche et al. (1999) Vandenbussche, B., Ehrenfreund, P., Boogert, A. C. A., et al. 1999, A&A, 346, L57
- van Harrevelt & van Hemert (2008) van Harrevelt, R & van Hemert, M. C. 2008, J. Phys. Chem. A, 112, 3002
- van Dishoeck et al. (2013) van Dishoeck, E. F., Herbst, E., & Neufeld, D. A. 2013, Chem. Rev., 113, 9043
- Vasyunin et al. (2011) Vasyunin, A. I., Wiebe, D. S., Birnstiel, T. et al. 2011, ApJ, 727, 76
- Vasyunin & Herbst (2013) Vasyunin, A. I. and Herbst, E. 2013, ApJ, 762, 86
- Visser et al. (2009) Visser, R., van Dishoeck, E. F., Doty, S. D., & Dullemond, C. P. 2009, A&A, 495, 881
- Visser et al. (2011) Visser, R., Doty, S. D., & van Dishoeck, E. F. 2011, A&A, 534, A132
- Vorobyov & Basu (2005) Vorobyov, E. I. & Basu, S. 2005, 633, L137
- Vorobyov & Basu (2015) Vorobyov, E. I. & Basu, S. 2015, ApJ, 805, 115
- Wakelam & Herbst (2008) Wakelam, V. and Herbst, E. 2008 ApJ, 680, 371-383
- Wakelam et al. (2012) Wakelam, V., Herbst, E., Loison, J-.C., et al. 2012, ApJS, 199, 21
- Walch & Duchovic (1991) Walch, S. and Duchovic, R. 1991, J. Chem. Phys., 94, 7068–7075
- Walsh et al. (2014) Walsh, C., Millar, T. J., Nomura, H., et al. 2014, A&A, 563, 33
- Walsh et al. (2015) Walsh, C., Nomura, H., & van Dishoeck, E. F. 2015, A&A, 582, A88
- Westley et al. (1995) Westley, M. S., Baragiola, R. A., Johnson, R. E., & Baratta, G. A. 1995, Nature, 373, 405
- Yildiz et al. (2013) Yildiz, U. A., Acharyya, K., Goldsmith, P. F., et al. 2013, A&A, 558, A58
- Zhen & Linnartz (2013) Zhen, J. & Linnartz, H. 2014, MNRAS, 437, 3190
- Zheng et al. (2006) Zheng, W., Jewitt, D. and Kaiser, R. I. 2006, ApJ, 639, 534-548
Appendix A Impact of chemical parameters on the composition of interstellar ices
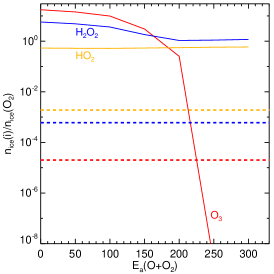
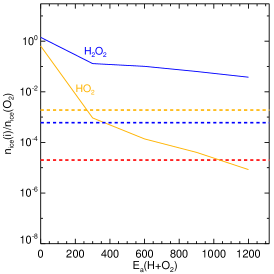
A set of models is run, in order to investigate the impact of various surface and chemical parameters on the chemical composition of interstellar ices and to assess whether the abundances of \ceO2, \ceO3, \ceHO2, and \ceH2O2 observed in comet 67P/C-G can be reproduced simultaneously. In each model, the “standard” values of the input parameters, listed in Table LABEL:grid_table, are assumed and only one of the parameters is varied in turn. In particular, the physical conditions assumed here are conditions that favour a high production of \ceO2, i.e. a high density cm-3 and a warm temperature K, according to the discussion in Section 2.4.
The impact of two surface parameters, the diffusion-to-binding energy ratio, , and the binding energy for \ceO on the formation and survival of \ceO2 ice and the chemically related species is investigated first. Following the discussion in Section 2.4, models in which the diffusion-to-binding energy ratio ranges between 0.3 and 0.8 and for which the binding energy of atomic oxygen ranges between 800 and 1700 K have been run. Figure 12 shows the abundances of \ceO2, \ceO3, \ceHO2, and \ceH2O2 in the solid phase (relative to water ice), at a time of yr for the different values of the input chemical parameters. The abundance of \ceO2 (and that for chemically related species) tends to decrease as is increased, both in the gas phase and in the ice mantle. The formation rate of \ceO2 is governed by the mobility of O atoms. Due to their relatively high binding energy ( K for the standard model), O atoms can diffuse efficiently only if . Higher values strongly inhibit the mobility, leading to a low abundance of \ceO2, \ceO3, \ceHO2, and \ceH2O2 (see left panel in Figure 12). Decreasing the binding energy of O atoms from 1700 to 800 K increases their mobility but also increases the rate of evaporation at 20 K. This then limits the conversion from O to \ceO2 and \ceO3, leading to a negligible dependence of the final abundances upon the assumed binding energy for atomic oxygen (see right panel in Fig. 12). The high abundance of \ceO2 seen in 67P/C-G can be reproduced for dense and warm conditions and assuming the standard values for the diffusion-to-binding energy ratio and the binding energy of atomic O. However, the abundances of \ceO3, \ceHO2, \ceH2O2 are overproduced by more than two orders of magnitude when standard values for the activation barriers of surface reactions are assumed.
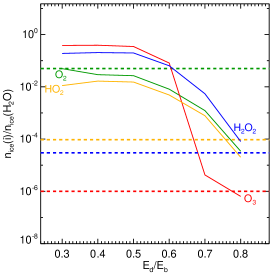
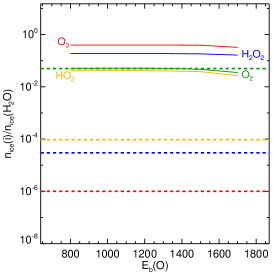
The impact of the activation barriers of the reactions O + \ceO2, H + \ceO2, and H + \ceH2O2 on the abundances of \ceO3, \ceHO2, and \ceH2O2 in ices is explored next. Figure 13 shows how the abundances of \ceO3, \ceHO2, and \ceH2O2 in the gas phase (top row) and in the solid phase (bottom row) relative to \ceO2 vary with the activation barriers of these three reactions. As described in Section 2.4, surface reactions involving \ceO2 have small or negligible reaction barriers but the activation barrier of the reaction O + \ceO2 remains uncertain. Due to the relatively high masses of O and \ceO2, the activation barrier can be only overcome thermally. At a dust temperature of 21 K, the reaction probability exponentially decreases from 1 ( K) to ( K). As a consequence, a small activation barrier of 250-300 K favours the formation and survival of \ceO2, \ceHO2, and \ceH2O2 with respect to \ceO3 and allows us to reproduce the low \ceO3/\ceO2 abundance ratio seen in comet 67P/C-G. This result is in good agreement with the results of Lamberts et al. (2013) who needed to introduce an activation barrier of 500 K in their microscopic Monte-Carlo model to explain the slow formation of ozone observed in laboratory experiments of Ioppolo et al. (2010). The O + \ceO2 reaction still takes place and induces the evaporation of \ceO3 into the gas phase via chemical desorption, explaining the high abundance of \ceO3 in the gas phase. However, this occurs at a slower rate than the reactions destroying \ceO3 ice through barrierless surface reactions.
In the model results, a high abundance of \ceO2 ice is consistently accompanied by similar abundances of \ceHO2 and \ceH2O2 ice, because the H + \ceO2 reaction is assumed to be barrierless, following the laboratory experiments of Miyauchi et al. (2008) and Ioppolo et al. (2008, 2010). However, quantum chemistry calculations by Walch & Duchovic (1991) show that the reaction in the gas phase has an activation barrier whose exact value depends on the incoming angle of the molecule. Lamberts et al. (2013) introduced a small activation barrier of 200-400 K for this reaction in their Monte-Carlo model to reproduce the chemical composition observed in cold ices produced in the laboratory experiments by Ioppolo et al. (2010). The activation barrier of the reaction H + \ceO2 was therefore varied between 0 K (our standard value) and 1200 K, the energy computed for gas phase conditions by Melius & Blint (1979). The transmission probability through quantum tunelling was computed assuming a rectangular barrier with a standard width of 1 . As shown in the middle panel of Fig. 13, the abundance of \ceHO2 ice decreases sharply with the activation barrier of the reaction H + \ceO2, even for moderate values because its rate of formation becomes much lower than its rate of destruction while the decrease of the abundance of solid \ceH2O2 is more limited. A small activation barrier of 300 K, similar to the values found by Lamberts et al. (2013), is therefore sufficient to reproduce the low abundance of \ceHO2 relative to \ceO2 observed in comet 67P/C-G.
The standard activation barrier of the H + \ceH2O2 reaction of 2500 K and the associated transmission probability computed with the Eckart model, follow the quantum chemical calculations for gas phase conditions presented in Taquet et al. (2013). As for other reactions showing high activation barriers, the exact value of their barrier is highly uncertain and could be lowered in interstellar ices, due to the van der Waals interactions between the neighbouring water molecules and the reactants, as shown for instance by Rimola et al. (2014) for the case of the CO + H and \ceH2CO + H reactions. Lamberts et al. (2013) decreased the activation barrier for the H + \ceH2O2 to 800 - 1200 K in their Monte-Carlo model to reproduce the \ceH2O2 abundance in laboratory cold ices. The right panel of Fig. 13 present the evolution of the \ceO3, \ceHO2, and \ceO3 abundances relative to \ceO2 for different values of the activation barrier of the reaction H + \ceH2O2, and assuming an activation barrier of 300 K for the reactions O + \ceO2 and H + \ceO2. The model tends to overpredict the abundance of \ceH2O2 relative to the abundance observed in 67P, unless the reaction H + \ceH2O2 is assumed to be effectively barrierless.