Silicate Composition of the Interstellar Medium
Abstract
The composition of silicate dust in the diffuse interstellar medium and in protoplanetary disks around young stars informs our understanding of the processing and evolution of the dust grains leading up to planet formation. Analysis of the well-known 9.7m feature indicates that small amorphous silicate grains represent a significant fraction of interstellar dust and are also major components of protoplanetary disks. However, this feature is typically modelled assuming amorphous silicate dust of olivine and pyroxene stoichiometries. Here, we analyze interstellar dust with models of silicate dust that include non-stoichiometric amorphous silicate grains. Modelling the optical depth along lines of sight toward the extinguished objects Cyg OB2 No. 12 and Ophiuchi, we find evidence for interstellar amorphous silicate dust with stoichiometry intermediate between olivine and pyroxene, which we simply refer to as “polivene.” Finally, we compare these results to models of silicate emission from the Trapezium and protoplanetary disks in Taurus.
Subject headings:
(ISM:) dust, extinction — infrared: stars — protoplanetary disks — stars: pre-main sequence — stars: variables: T Tauri, Herbig Ae/Be1. Introduction
Studies of the dust in the interstellar medium (ISM) and in protoplanetary disks informs studies of the evolution of protoplanetary disks toward planetary systems. The dust in the ISM becomes the raw material of protoplanetary disk solids, which undergo processing during accretion disk evolution. In this way, the dust composition of the ISM and protoplanetary disks probe key phases leading up to planet formation. T Tauri star (TTS) disks show spectral features of dust in emission at infrared wavelengths observable by the Infrared Spectrograph (IRS; Houck et al. 2004) onboard the Spitzer Space Telescope (Werner et al. 2004). Some studies (e.g. Przygodda et al. 2003; Kessler-Silacci et al. 2005, 2006; Watson et al. 2009) have characterized disks’ dust content using spectral diagnostics such as spectral indices, which are measurements of flux ratios between wavelengths chosen to focus on the “continuum” between strong silicate features. Studies such as that by Sargent et al. (2006, 2009a) characterize the dust in these disks through modelling disk emission in IRS spectra using theoretical and laboratory measured dust grain optical properties. With this approach, it is very important to ensure that the dust opacities used in the model are not only precise, but also representative of the actual dust in protoplanetary disk environments.
Silicate dust is of great interest to astronomers due to its prevalence in many different astrophysical environments, including the ISM, protoplanetary disks around young stars (e.g., TTSs, Herbig Ae/Be stars), evolved stars (e.g., asymptotic giant branch stars, red supergiant stars), massive stars (e.g., supergiant B[e] stars), and even the immediate environs of active galactic nuclei (ULIRGS and quasars). The broad 10m and 20m resonances of silicate dust cause increased extinction in the ISM near these wavelengths. In protoplanetary disks, the silicate dust in the relatively warmer outer layer of the disk gives rise to spectral emission features. While the silicate dust in the ISM is almost entirely in amorphous forms (see Mathis 1990, Li & Draine 2001, Kemper et al. 2004, 2005), the spectra of protoplanetary disks and Herbig AeBe stars also show evidence of more sharp, narrow emission features (henceforth “fine structure”), indicating crystalline silicate dust in addition to amorphous silicates (see Bouwman et al. 2001, Forrest et al. 2004, van Boekel et al. 2004, Sargent et al. 2006, 2009a, Sicilia-Aguilar et al. 2007, Watson et al. 2009). The smooth infrared spectral features near 10m and 20m indicate the presence of amorphous silicate dust, typically modelled as silicate grains of olivine and pyroxene stoichiometries. In their modelling, Sargent et al. (2006, 2009a) include three crystalline silicate dust components as well as amorphous silicates of both pyroxene and olivine stoichiometry. In these models, each dust component must be carefully selected, since silicate dust grains can come in a wide variety of size and shape distributions.
While amorphous silicate dust grains in astrophysical contexts are typically modelled assuming a pyroxene or olivine stoichiometry, presolar dust grains embedded in primitive meteorites suggest that this dust is often non-stoichiometric. Models of the nature and composition of dust in the ISM can be informed by presolar grains found in meteorites and interplanetary dust particles. Analysis of the oxygen isotopic compositions of these presolar grains shows that they were formed in supernovae, red giant branch stars, and asymptotic giant branch stars (Choi et al. 1998, Nittler et al. 1997, Nittler et al. 1998). The presolar grains traversed the ISM, eventually becoming a part of the forming solar system, where some were preserved in meteorites. Studies have found presolar silicate grains with stoichiometry intermediate between olivine and pyroxene (Bose 2011, Bose et al. 2012, Floss & Stadermann 2009, Stadermann et al. 2009, Vollmer et al. 2009). Models using interstellar and protoplanetary dust should consider amorphous grains of intermediate stoichiometry between olivine and pyroxene, given the meteoritic evidence for non-stoichiometric amorphous silicates from presolar grains.
Studies using the spectra of the dusty emission surrounding the Trapezium, as well as the extinction profile toward objects like Cyg OB2 No. 12 and Oph, inform our understanding of the composition of interstellar dust. Work by Gillett & Stein (1969) and Gillett & Forrest (1973) showed the Trapezium spectrum at near-infrared wavelengths was consistent with emission from silicate dust grains. Draine & Lee (1984) based their derivation of “astronomical silicate” optical properties in part on the 8-13m Trapezium spectrum. Cyg OB2 No. 12, a very luminous B5 hypergiant star at roughly 1.7 kpc distance (Torres-Dodgen et al. 1991, Humphreys 1978), is also a heavily extinguished ( = 10.2) object. In combination, these qualities make Cyg OB2 No. 12 excellent for studying extinction caused by dust in the diffuse ISM (Whittet 2015). Consequently, several studies have used the extinction toward Cyg OB2 No. 12 at infrared wavelengths to infer details of the composition of dust in the diffuse ISM (Rieke 1974, Gillett et al. 1975, Roche & Aitken 1984, Sandford et al. 1995, Whittet et al. 1997, Bowey et al. 1998, 2004). Similarly, the line of sight toward Oph, a well-studied bright O9.5 star with 1 (Cardelli et al. 1989), is considered representative of diffuse interstellar cloud material (Savage & Sembach 1996). In this study, we also use Cyg OB2 No. 12 and Oph as probes of the dust in the interstellar medium. We use stellar atmosphere models and extinction measurements to estimate the optical depth along sight lines toward these objects, then model this optical depth using a suite of various silicate dust opacities to investigate the amorphous dust composition of the diffuse ISM. We also present and compare spectral modelling of the silicate emission from the Trapezium and several pristine spectra of protoplanetary disks. The results of these models are compared and their implications for dust composition are discussed.
2. Observations and Data Reduction
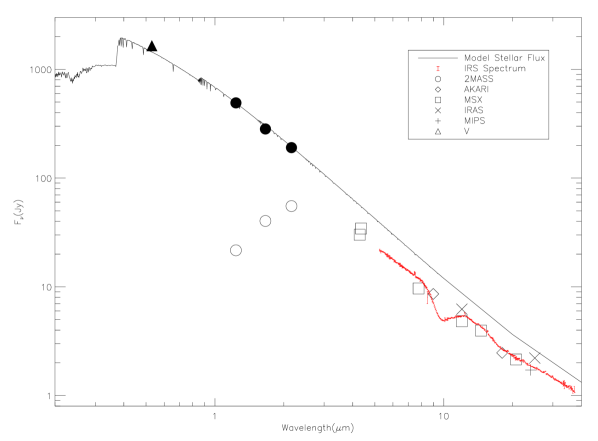
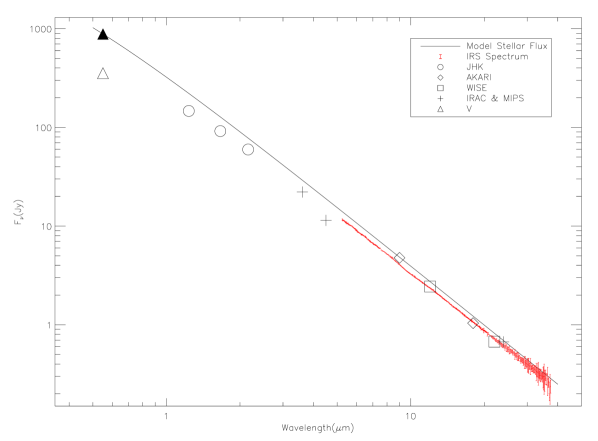
Cyg OB2 No. 12 was observed using the Infrared Spectrograph (IRS) on the Spitzer Space Telescope on 2008 August 6 (PI: David Ardila, AOR 27570176). It was observed using the Short-Low (SL) module in all orders (5.2-14m) as well as the second order of Long-Low (LL) module (14-21.3m). The observations were performed in Spitzer’s staring mode following a Pointing Calibration and Reference Sensor (PCRS) peak-up observation, which is described in detail by Houck et al. (2004). Earlier observations taken on 2004 October 10 (PI: Neal Evans, AOR 9834496) included the first order of LL (19.5-38m), and we include these data as part of the spectral energy distribution (SED) in Figure 1. The SED presented in Figure 1 also includes photometry from 2MASS, IRAC, MIPS, WISE, and V-band photometry from Caballero-Nieves et al. (2014). Oph was observed with the IRS with the SL and LL modules on September 10 2008 (PI: David Ardila, AOR 27582976) using Spitzer’s staring mode following a (PCRS) peak-up observation. The SED of Oph in Figure 2 presents the infrared spectrum as well as V-band photometry from Herbig (1968) and near-infrared photometry from Whittet & van Breda (1980).
Observations of the Trapezium presented by Forrest et al. (1975) at 8-13m are combined with a spectrum at 16-38m from Forrest et al. (1976). The 16-38m spectrum corrects for some emission from the Kleinman-Low nebula as described in Forrest et al. (1976). This combination of Trapezium spectra was presented by Sargent et al. (2009a) and used to test modelling of silicate emission from protoplanetary disks. We refer the reader to the original papers for observational details.
Observations and data reduction methods for the spectra of five protoplanetary disk spectra of deemed amorphous silicate exemplars in Sargent et al. (2009a) are described in detail in Furlan et al. (2006).
The spectra for Cyg OB2 No. 12 and Oph were downloaded from the Cornell Atlas of Spitzer IRS Sources (CASSIS v7; Lebouteiller et al. 2011), using the recommended optimal extraction. We note the IRS spectrum of Cyg OB2 No. 12 exhibits Pfund and Humphreys emission lines, likely from a stellar wind. Figure 1 shows the final reduced spectrum for Cyg OB2 No. 12, for which the uncertainties are typically one percent or less in the crucial 10m region. Infrared photometry shows good agreement with the IRS spectrum. Good agreement is found between this spectrum and that of Cyg OB2 No. 12 from the Spitzer Atlas of Stellar Spectra (SASS; Ardila et al. 2010). For the spectrum of Oph, The first order of the SL module was scaled by a factor of 1.03 to match the flux density of adjacent modules. The spectrum exhibits relatively smaller signal-to-noise than that for Cyg OB2 No. 12, especially at longer wavelengths. Figure 2 shows the final reduced spectrum for Oph.
3. Modelling
3.1. Underlying Flux of Extinguished Stars
We model the flux from the supergiant star Cyg OB2 No. 12 using a model atmosphere from Castelli et al. (1997). We used a model atmosphere with an effective temperature of 13,000 K, turbulent velocity of 2 km , and log(g) of 2.5 as used by Bowey et al. (2004). Using the Kurucz model for the assumed intrinsic colors of Cyg OB2 No. 12 and taking the ratio of from the = 3.1 curve from Mathis (1990), we compared the observed J- color to the intrinsic color to derive an extinction correction for the J band. From the extinction at J we inferred extinction corrections at H and using the Mathis extinction curve for = 3.1. Through this method we estimate = 3.3. This extinction estimate corresponds to = 11.1, also using the Mathis = 3.1 extinction curve. This is close to previous estimates, considering the uncertainty in the infrared extinction estimate and its uncertain relation to extinction at visible wavelengths. The Kurucz model atmosphere flux was fit to the extinction-corrected 2MASS flux, as shown in Figure 1. We included a free-free emission component to this model with proportional to as in Bowey et al. (2004), and tested our model’s dependence on this by varying the strength of this free-free emission from 0-20 of the total flux at 8m. The free-free component becomes increasingly important at longer wavelengths since the star’s spectrum is close to Rayleigh-Jeans (proportional to ) at longer wavelengths. The strength of free-free emission did not significantly impact the resulting comparison between model fits with and without including silicates of intermediate composition in this model. Photosphere emission from Oph was approximated as a simple blackbody. A Planck function with an effective temperature of 34,300 K (Howarth & Smith 2001) was fit to the photometry in the V-band after correcting for one magnitude of visible extinction. This extinction correction was estimated by comparing the observed B-V color from Moffett & Barnes (1979) to intrinsic color of a typical O9.5 V star (Pecaut & Mamajek 2013). The SED for Oph is shown in Figure 2.
| Name | Abbrev. | Description |
|---|---|---|
| Small Amorphous Polivene | SmPoli | Optical constants for amorphous silicate of Mg1.5SiO3.5 composition from Jäger et al. (2003), assuming CDE2 (Fabian et al. 2001) |
| Large Amorphous Polivene | LgPoli | Optical constants for amorphous silicate of Mg1.5SiO3.5 composition from Jäger et al. (2003), using the Bruggeman EMT and Mie theory (Bohren & Huffman 1983) with a vacuum volume fraction of f = 0.6 for porous spherical grains of radius 5m |
| Small Amorphous Olivine | SmOl | Optical constants for amorphous olivine MgFeSiO4 from Dorschner et al. (1995), assuming CDE2 (Fabian et al. 2001) |
| Large Amorphous Olivine | LgOl | Optical constants for amorphous olivine MgFeSiO4 from Dorschner et al. (1995), using the Bruggeman EMT and Mie theory (Bohren & Huffman 1983) with a volume fraction of vacuum of f = 0.6 for porous spherical grains of radius 5m |
| Small Amorphous Pyroxene | SmPy | Optical constants for amorphous pyroxene of cosmic composition from Jaeger et al. (1994), assuming CDE2 (Fabian et al. 2001) |
| Large Amorphous Pyroxene | LgPy | Optical constants for amorphous pyroxene of cosmic composition from Jaeger et al. (1994), using the Bruggeman EMT and Mie theory (Bohren & Huffman 1983) with a vacuum volume fraction of f = 0.6 for porous spherical grains of radius 5m. |
| Enstatite | enst | Opacities for clinoenstatite Mg0.9Fe0.1SiO3 from Chihara et al. (2002) . |
| Forsterite | forst | Optical constants for three crystallographic axes of forsterite, Mg2SiO4, from Sogawa et al. (2006), assuming tCDE (Sargent et al. 2009a) |
| Silica | silica | Opacity for annealed silica by Fabian et al. (2000) |
3.2. Extinction and Opacity Model
The ISM dust extinction optical depth is modelled as:
| (1) |
where is the optical depth at a given wavelength, and and are the observed and assumed stellar flux at that wavelength, respectively. The “stellar” flux includes the Kurucz model atmosphere flux and any free-free emission assumed. Given this estimate of optical depth, our model finds the best fit to this derived optical depth as the sum of various amorphous and crystalline silicate dust opacities. Our model minimizes to find the best fit to the spectrum using the opacities of various silicate dust grains as components. The model components include opacities for amorphous silicate grains of olivine, pyroxene, and intermediate (“polivene”) stoichiometry as well as three crystalline silicate opacities (forsterite, enstatite, and silica). As described in detail in Sargent et al. (2006, 2009a), opacities for small grains are calculated assuming grain shapes with a modified continuous distribution of ellipsoid shapes (CDE2, Fabian et al. 2001). Opacities for large amorphous grains are calculated using Bruggeman Effective Medium Theory and Mie Theory (Bohren & Huffman 1983), using a vacuum volume fraction of f = 0.6 for porous spherical grains of radius 5m. We add a “continuum” opacity to the model to represent sources of opacity that have little wavelength dependence over the modelled wavelength range. The optical depth as a function of wavelength is modelled using the following equation:
| (2) |
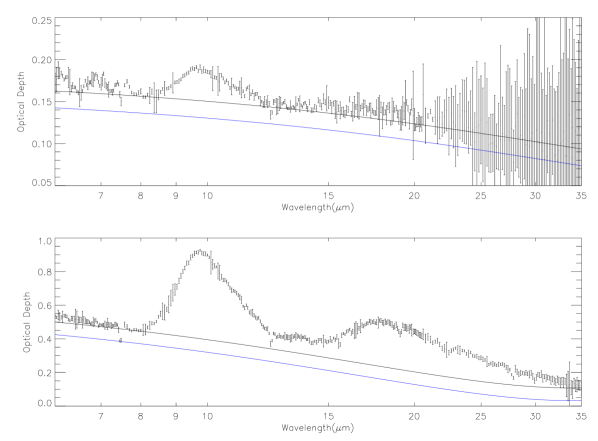
where is the optical depth at a given wavelength, C is a constant used as a first order approximation of a “continuum” opacity, and each is the opacity of a given dust species, which is scaled by a weighting factor . An additional quadratic continuum was estimated by fitting the lowest optical depth values surrounding the silicate features, as seen in Figure 3. As discussed in Poteet et al. (2015), fitting a local continuum can artificially reduce the optical depth contributions from non-continuum sources to zero. To avoid setting the resulting optical depth to zero, but maintain the general shape of the continuum, we slightly reduce the strength of the continuum optical depth (see Figure 3). The free parameters in this model are the weighting factors and strength of the constant “continuum” opacity. As shown in Min et al. 2007 and Bouwman et al. 2001, fits to just the 10m feature can be degenerate between properties such as grain shape, size, and iron content. We therefore choose to simultaneously model the 10m and 20m silicate features by fitting a wavelength range of 8-30m. We also include a model of only the data from 8-12m in order to focus on the 10m feature, avoiding the nearby Pfund and Humphreys emission features.
3.3. Polivene
The silicate dust components of our model are listed in Table 1. Work by Sargent et al. (2006, 2009b, 2009a) determined the silicate dust types that best fit the features of protoplanetary disks in star-forming regions like the Taurus-Auriga Molecular Cloud. Since this dust is formed from dust in the ISM, we use the same opacities in our model. In this work, we also include amorphous silicate dust with intermediate stoichiometry (Mg1.5SiO3.5) to improve fits to infrared spectral features. This dust is neither olivine nor pyroxene, but of intermediate stoichiometry. Though we emphasize that the name does not refer to any (stoichiometric) mineral, we choose to refer to it by the simple shorthand “polivene.” Jäger et al. (2003) uses amorphous silicates with intermediate stoichiometry to best represent the dust emissivity of the AGB star TY Dra. Non-stoichiometric grains are found in presolar silicates (see Nguyen et al. 2007, Nguyen et al. 2010, Vollmer et al. 2009, and Zhao et al. 2013). Characterizing sub-micron presolar grains using Auger spectroscopy, Stadermann et al. (2009) found distinct populations of silicate grains with olivine-like and pyroxene-like stoichiometries, with some grains spanning the gap between the two. Studies by Floss & Stadermann (2009) and Bose et al. (2012) find a statistically significant fraction of presolar amorphous silicate grains with intermediate stoichiometry, indicating a distinct population of these intermediate grains. We therefore consider these non-stoichiometric amorphous silicates in our models.
Using the optical constants for amorphous silicate of Mg1.5SiO3.5 composition from Jäger et al. (2003), we calculate opacities for sub-micron grains of polivene composition assuming a CDE2 (Fabian et al. 2001) shape distribution. Like the other large amorphous grains in our model, large polivene grain opacities are derived using Bruggeman EMT and Mie theory (Bohren & Huffman 1983) with a vacuum volume fraction of f = 0.6 for porous spherical grains of radius 5m. The opacity as a function of wavelength for small polivene grains is characterized by the prominent feature peaking at 9.7m. Compared to both the opacity of small amorphous olivine and pyroxene in our model, the submicron polivene opacity has a more sharply peaked 9.7m feature (see Figure 4). All three forms of small amorphous silicate opacities in our model have a strong 10m feature that falls off more steeply toward shorter wavelengths, while toward longer wavelengths the peak drops off more gradually. Our model opacities of small olivine and small pyroxene peak at 10.0m and 9.4m, respectively, while the opacity of small polivene peaks between these two at 9.6m. The 10m peak of the small polivene opacity profile for submicron grains is in some ways a combination of that of small amorphous olivine and pyroxene, but its narrowness cannot be reproduced by a linear combination of the opacity profiles of small amorphous olivines and pyroxenes.
The optical constants for the “polivene” used in our model are measured from material produced via a sol-gel technique, formed by an aqueous reaction (Jäger et al. 2003). These reactions occur at lower temperatures than the regions around AGB stars and red supergiant (RSG) stars where major dust production is thought to occur, as pointed out by Sargent et al. (2009a). However, the sol-gel method used in earthbound laboratories could potentially create the dust most similar to that in the ISM, created in different environments, such as AGB star outflows. Recently, Koch et al. (2016, in prep) and Sargent et al. (in prep) have also found that non-stoichiometric amorphous silicate opacities improve fits to infrared spectral features of protoplanetary disk spectra in the Orion Nebula Cluster (ONC) and L1641, as well as AGB wind spectra, respectively.
3.4. Two-Temperature Silicate Emission Model
The spectrum of the Trapezium was modelled assuming that its flux is a combination of thermal emission components from silicate dust grains and simple blackbodies. The model used is described in detail by Sargent et al. (2009a). This model uses two temperatures which represent a warm component (with warm temperature “Tw”) and cooler component (with cool temperature “Tc”) and models the emission as the sum of emission from two blackbodies of these respective temperatures, added to emission from optically thin dust in the warm (at temperature Tw) and cool (Tc) regions:
where is the blackbody intensity per frequency given by the Planck function at wavelength , is the solid angle of the corresponding blackbody, and each is a mass weight of a component with opacity given by at wavelength . The simple blackbodies are included to represent optically thick continuum emission sources such as those from very large sized grains and amorphous carbon.
We also use this model to fit the spectra of protoplanetary disks. In fact, it is the same two-temperature silicate emission model used in Sargent et al. (2009a) previously used to model protoplanetary disks. For these disks, the model’s warm and cool temperature components represent the inner and outer disk, respectively. In this way, the model makes a rough distinction between emission from optically thin dust in the inner and outer regions of the disk.
4. Results
4.1. Interstellar Polivene
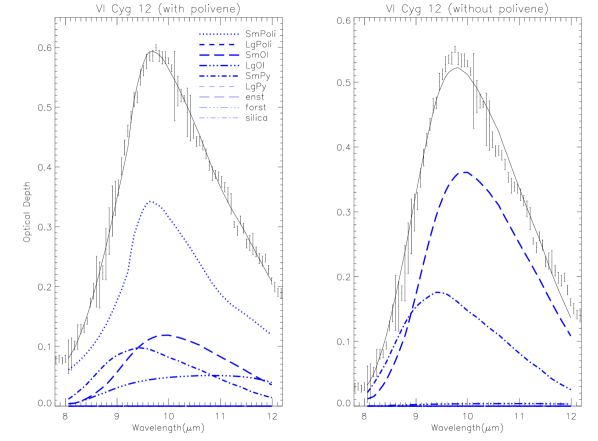
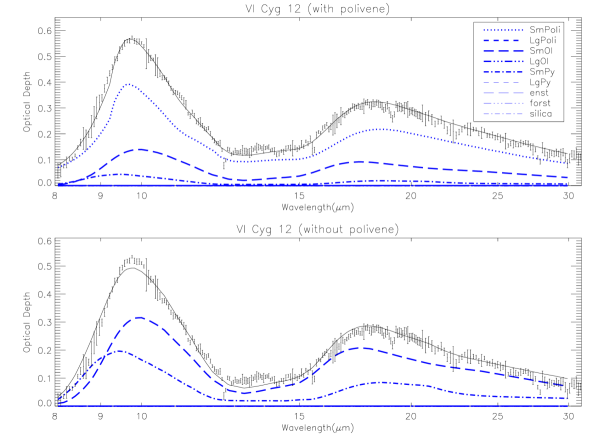
The modelling of optical depth along lines of sight toward Cyg OB2 No. 12 and Oph using the infrared opacities of a suite of silicate dust opacities reveals evidence for interstellar polivene. The optical depth modelling in both cases is improved by the inclusion of polivene. The models used in each figure are identical, except for the inclusion of amorphous polivene grains in the top models, which improves the model fit.
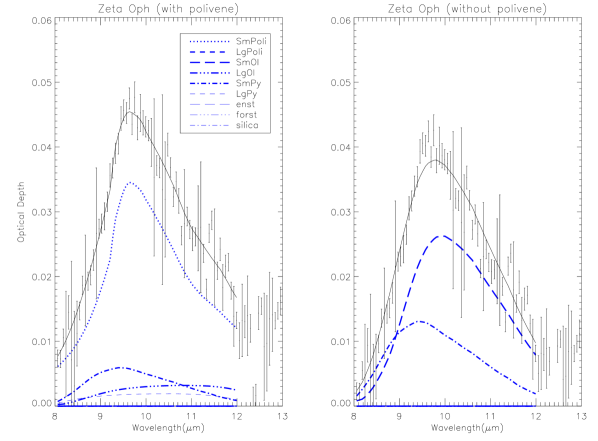
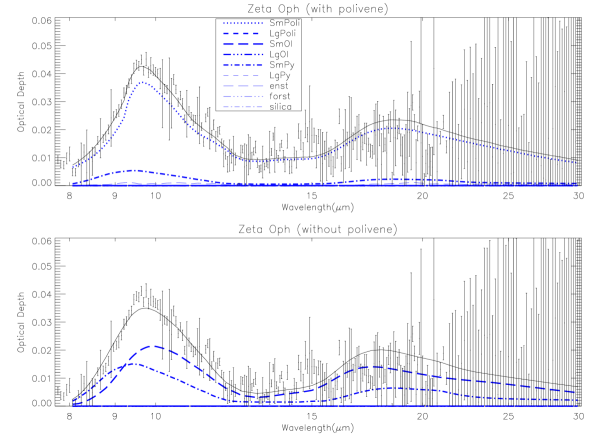
In both Cyg OB2 No. 12 and Oph, when polivene is included as a component in the modelling, the contribution to the optical depth is dominated by small amorphous polivene. Including polivene improves the model fit for Cyg OB2 No. 12 (see Figure 5) from a reduced value of 5.3 (without polivene) to a reduced of 2.8 (with polivene). When just focusing between 8-12m, these respective reduced values are 5.6 and 1.8 (see Figure 4). An improvement is also seen in Oph’s model fit improvement from a reduced value of 3.1 (without polivene) to a reduced of 1.7 (with polivene) when fitting from 8-12m to focus on the 9.7m feature (see Figure 6). Modelling Oph over a larger wavelength range of 8-30m yields an improvement in reduced from 3.6 to 2.8 after polivene is included (see Figure 7). For both objects, the optical depth near 10m is characterized by a steep increase between 9m and 9.5m, and a more gradual decline beyond the peak at 9.7m. This general shape is reproduced well by the opacity of polivene, leading to a significant improvement in the model fit.
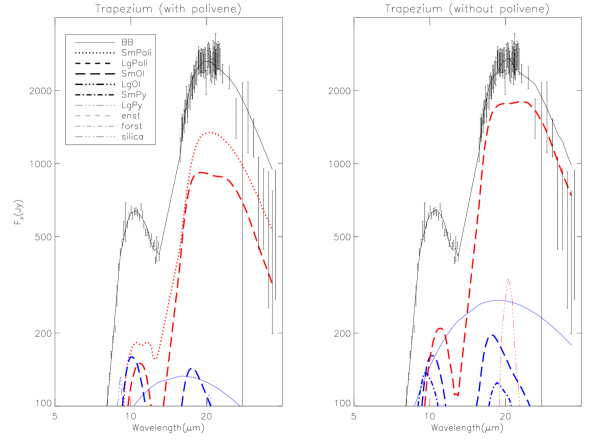
The two-temperature silicate emission model was used to analyze the spectrum of the Trapezium. Figure 8 shows the best fit to the Trapezium spectrum, for both the case where polivene is included and when it is not. The per degree of freedom is improved in our model when polivene is included, but only from a value of 1.60 to 1.48, which is not considered particularly significant. When allowing polivene, the model’s cool dust component is dominated by emission from small-sized polivene grains. Best fit model parameters are listed in Table 3.
4.2. Polivene in Protoplanetary Disks
With the strong evidence for polivene in the ISM, and since dust in the ISM makes up the seed material for protoplanetary disks, it is important to include polivene in studies of protoplanetary disks. Given the evidence for polivene in the ISM, we investigate the disks in the Taurus-Auriga molecular cloud, a well-studied region of star formation. The dust in the protoplanetary disks of Taurus has been characterized by several studies (e.g. Furlan et al. 2006, 2009, 2011; Watson et al. 2009; Sargent et al. 2006, 2009a). Sargent et al. (2009a) identifies several “amorphous silicate exemplars” in Taurus, which are protoplanetary disks whose infrared spectra show only the very smooth and broad features indicative of amorphous silicate dust. Our two-temperature model characterizes the dust in five of these amorphous silicate exemplars. As shown in Table 2, fits to the infrared spectrum of these amorphous exemplars are not significantly improved by adding polivene opacities as a component in the model. Most of these fits were only improved so slightly that the per degree of freedom decreased by 0.01-0.05. The exception to this was LkCa 15, as the fit improved in reduced by 0.31. However, this is mostly due to the poor general fit to the spectrum in both cases at longer wavelengths, for which the model also adds a sizable forsterite component that has been deemed an artifact (see Sargent et al. 2009a). In addition, the model results had very small, if any, polivene masses in their very slightly improved best fits. Taurus protoplanetary disk spectra show no strong evidence for non-stoichiometric amorphous dust emission.
| Name | Without Polivene | With Polivene |
|---|---|---|
| CoKu Tau 4 | 2.42 | 2.37 |
| DM Tau | 4.82 | 4.81 |
| FM Tau | 2.43 | 2.40 |
| GM Aur | 5.04 | 5.03 |
| LkCa15 | 7.78 | 7.47 |
5. Discussion
Modelling the dust composition of the ISM and protoplanetary disks using opacities for amorphous dust of intermediate stoichiometry between that of olivine and pyroxene (“polivene”) gives new insight into dust formation and processing in astrophysical contexts. Using opacities of various silicate dust species, we have modelled the optical depth of the intervening ISM material along lines of sight toward Cyg OB2 No. 12 and Oph. With this model, we find strong evidence for a population of interstellar polivene. This suggests an efficient mechanism for producing sub-micron sized polivene dust grains, presumably from red giant branch stars (RGB) and asymptotic giant branch (AGB) stars. More work is needed to determine if polivene is ubiquitous in the ISM or if it is found only in certain regions. Evidence for polivene in the ISM is consistent with meteoritic evidence of non-stoichiometric amorphous compositions found in pre-solar grains. In the formation of the solar system, these presolar grains were protected inside meteorites and remained relatively unprocessed throughout the last 4.567 Gyr. These non-stoichiometric amorphous grains found in primitive meteorites represent interstellar dust that populated a molecular cloud from which the solar system formed. Our model’s result of interstellar dust toward Cyg OB2 No. 12 and Oph supports the hypothesis based on meteoritic evidence that non-stoichiometric amorphous silicate dust is present in the diffuse ISM.
The best fits to the modelled optical depth toward Cyg OB2 No. 12 and Oph exhibit general agreement that the dust in the ISM responsible for the broad absorption features is mostly amorphous, small silicate grains. The best fits include only amorphous dust as components. The strength of the large amorphous grain components in our model are much weaker than the dominating features from smaller (submicron) grains. The small amorphous silicates used in our modelling have equal Fe and Mg content, with the exception of polivene, which includes no Fe. The ISM toward Oph is also found to consist of small amorphous silicates with Fe/Mg ratios 1 by Poteet et al. (2015), who use amorphous silicates of olivine and pyroxene stoichiometry with varying Fe/Mg ratios in their modelling and find a lack of the most Fe-rich silicates in their best fits. However, as noted by Sargent et al. (2009a) and Poteet et al. (2015), there exists significant degeneracy between Fe-rich and Fe-poor silicates in these models. This degeneracy inhibits the ability these models to draw conclusions about the Fe content of interstellar silicate dust. When polivene is not included in our models, small amorphous grains of olivine stoichiometry dominate the composition of the ISM toward Oph, rather than pyroxene-like grains. However, we note that Sargent et al. (2009a) shows significant degeneracy between amorphous grains of olivine and pyroxene compositions. Poteet et al. (2015) models the IRS spectrum of Oph and also finds that amorphous grains of principally olivine-like composition provide the best model fit to the spectrum. Just as in our best fit of the ISM toward Oph without including polivene, the model fit in Poteet et al. (2015) has a slightly broader peak near 9.7m that is shifted to a slightly longer wavelength than that of the data. The addition of amorphous silicate grains of intermediate stoichiometry adds a component to these interstellar dust models that improves fits to the prominent 9.7m feature.
Protoplanetary disks, which form inside molecular clouds of gas and dust, represent another stage of dust processing in the journey toward planet formation. If polivene is present in the diffuse ISM, then we expect that the molecular clouds from which protoplanetary disks form also harbor polivene. However, our modelling of amorphous silicate exemplar disks in Taurus lack any significant evidence of polivene. One possible explanation for this discrepancy would be significant non-uniformity of polivene populations in the ISM. This explanation would mean that the Taurus-Auriga molecular cloud formed from interstellar material that was much less rich in polivene than along a sightline toward Cyg OB2 No. 12 and Oph. Additional studies would be required to determine possible polivene presence along lines of sight other than toward Cyg OB2 No. 12 and Oph. Evidence of this significant non-uniformity would suggest dust production methods that lead to regions of high and low concentrations of polivene in the interstellar medium.
| Object Name | Polivene in model? | SmPoli | LgPoli | SmOl | LgOl | SmPy | LgPy | enst | forst | silica | /d.o.f. |
|---|---|---|---|---|---|---|---|---|---|---|---|
| Cyg OB2 No. 12 | Yes | 74.4 | 0 | 20.3 | 0 | 5.3 | 0 | 0 | 0 | 0 | 2.8 |
| Cyg OB2 No. 12 | No | - | - | 66 | 0 | 34 | 0 | 0 | 0 | 0 | 5.3 |
| Oph | Yes | 90.7 | 0 | 0 | 0 | 9.3 | 0 | 0 | 0 | 0 | 2.8 |
| Oph | No | - | - | 63.2 | 0 | 36.8 | 0 | 0 | 0 | 0 | 3.6 |
| Trapezium | Yes | 0-66 | 0 | 63-34 | 0 | 18-0 | 0 | 0 | 0 | 20-0 | 1.5 |
| Trapezium | No | - | - | 51-95 | 0 | 41-0 | 0 | 0 | 0 | 8-5 | 1.6 |
Note. — Best model fit parameters for sightlines toward Cyg OB2 No. 12, Oph, and the Trapezium. Each dust parameter (see Table 1 for abbreviations and details) is listed as a mass percentage, excluding continuum emission. The values listed here are for the model fits spanning a wavelength range from 8-30m. In the case of the Trapezium, the two values listed for each dust type correspond to the mass percentages of the modelled warm and cool regions, respectively.
Our results for disks in Taurus also differ from recent results regarding protoplanetary dust in the disks of the ONC and L1641. Work by Koch et al. (2016, in prep) finds that including polivene in models of disk emission significantly improves fits to the infrared spectra of protoplanetary disks in the ONC and L1641. Koch et al. finds 57 of 76 disks showed evidence for polivene in the ONC, and 53 of 72 in L1641. This would be further demonstration of potential non-uniformity in polivene distribution. Dust grain processing could also account for the evidence of polivene in Orion disks and lack of polivene emission in the disks of the Taurus-Auriga molecular cloud complex. Hertzsprung-Russell diagrams show that T-Tauri stars in Taurus are significantly older than those in Orion (Kenyon & Hartmann 1995, Hillenbrand 1997, Luhman et al. 2009, Da Rio et al. 2010). Comparison to models (e.g. Siess et al. 2000) indicates a median age difference of 1 Myr. Since the lifetimes of Class II objects are likely underestimated (Bell et al. 2013), this median age difference may be even larger. If the polivene grains present in the ISM undergo processing to produce amorphous grains of olivine and pyroxene stoichiometry, that processing could explain the lack of polivene in the older, more processed Taurus disks. According to this hypothesis, protoplanetary disks in the youngest nearby regions such as NGC 1333, Serpens, and the core of Ophiuchus should be more likely to exhibit evidence for polivene than the disks in older, more processed regions like Scorpius-Centaurus, Chamaeleon, or the off-core region of Ophiuchus.
Future studies could test these hypotheses, filling in our understanding of key phases of dust evolution. The Spitzer mission obtained spectra for circa 2000 nearby protoplanetary disks. Further analysis of the dust composition within these disks and how the compositions correspond to age, locale, etc. could test our understanding of dust processing and non-uniformity. Studying details of dust composition in these key phases informs our understanding of dust grains’ long journey, from the production mechanisms in AGB and RGB winds, travelling through the diffuse ISM, gathering into molecular clouds and collapsing into the protoplanetary disks where they are processed and coalesce to finally form planets.
6. Conclusions
We analyzed the composition of interstellar dust along lines of sight toward Cyg OB2 No. 12 and Oph. First, the optical depth toward these objects was estimated using the infrared spectrum, photometry and stellar atmosphere models. Modelling the optical depth toward Cyg OB2 No. 12 and Oph at infrared wavelengths as a sum of silicate opacities and a continuum, we find that the optical depth of extinguishing material toward the object Cyg OB2 No. 12 and Oph exhibit strong features indicative of amorphous silicate dust with intermediate stoichiometry between olivine and pyroxene. We conclude that a significant “polivene” dust population exists in the diffuse interstellar medium toward Cyg OB2 No. 12 and Oph.
The infrared spectrum of the Trapezium was modelled as a combination of a cool and a warm component of thermal emission from simple blackbodies and silicate dust species. The best model fit to the Trapezium spectrum is only slightly improved by the inclusion of polivene. We conclude that our model shows the Trapezium spectrum to be consistent with an interstellar polivene dust population.
The dust compositions of five protoplanetary disks in Taurus whose infrared spectra are dominated by amorphous silicates were investigated. We studied these spectra by modelling the disk emission as a warm inner region and a cooler outer region. In each region a simple blackbody contribution was added to the emission from each of the nine dust species, and the model found a best fit to the infrared spectrum using these components. Our study found no significant evidence for polivene dust grains in the emission features of these disks of Taurus. We conclude that the dust in Taurus must have either coalesced from a region of the ISM that was significantly less rich in polivene than along the sight lines toward Cyg OB2 No. 12 and Oph, or that it has been largely processed away in the somewhat older Taurus disks.
References
- Ardila et al. (2010) Ardila, D. R., Van Dyk, S. D., Makowiecki, W., et al. 2010, ApJS, 191, 301
- Bell et al. (2013) Bell, C. P. M., Naylor, T., Mayne, N. J., Jeffries, R. D., & Littlefair, S. P. 2013, MNRAS, 434, 806
- Bohren & Huffman (1983) Bohren, C. F., & Huffman, D. R. 1983, Absorption and Scattering of Light by Small Particles (New York: Wiley)
- Bose (2011) Bose, M. 2011, PhD thesis, Washington University in St. Louis
- Bose et al. (2012) Bose, M., Floss, C., Stadermann, F. J., Stroud, R. M., & Speck, A. K. 2012, Geochim. Cosmochim. Acta, 93, 77
- Bouwman et al. (2001) Bouwman, J., Meeus, G., de Koter, A., et al. 2001, A&A, 375, 950
- Bowey et al. (1998) Bowey, J. E., Adamson, A. J., & Whittet, D. C. B. 1998, MNRAS, 298, 131
- Bowey et al. (2004) Bowey, J. E., Rawlings, M. G., & Adamson, A. J. 2004, MNRAS, 348, L13
- Caballero-Nieves et al. (2014) Caballero-Nieves, S. M., Nelan, E. P., Gies, D. R., et al. 2014, AJ, 147, 40
- Cardelli et al. (1989) Cardelli, J. A., Clayton, G. C., & Mathis, J. S. 1989, ApJ, 345, 245
- Castelli et al. (1997) Castelli, F., Gratton, R. G., & Kurucz, R. L. 1997, A&A, 318, 841
- Chihara et al. (2002) Chihara, H., Koike, C., Tsuchiyama, A., Tachibana, S., & Sakamoto, D. 2002, A&A, 391, 267
- Choi et al. (1998) Choi, B.-G., Huss, G. R., Wasserburg, G. J., & Gallino, R. 1998, Science, 282, 1284
- Da Rio et al. (2010) Da Rio, N., Robberto, M., Soderblom, D. R., et al. 2010, ApJ, 722, 1092
- Dorschner et al. (1995) Dorschner, J., Begemann, B., Henning, T., Jaeger, C., & Mutschke, H. 1995, A&A, 300, 503
- Draine & Lee (1984) Draine, B. T., & Lee, H. M. 1984, ApJ, 285, 89
- Fabian et al. (2001) Fabian, D., Henning, T., Jäger, C., et al. 2001, A&A, 378, 228
- Fabian et al. (2000) Fabian, D., Jäger, C., Henning, T., Dorschner, J., & Mutschke, H. 2000, A&A, 364, 282
- Floss & Stadermann (2009) Floss, C., & Stadermann, F. 2009, Geochim. Cosmochim. Acta, 73, 2415
- Forrest et al. (1975) Forrest, W. J., Gillett, F. C., & Stein, W. A. 1975, ApJ, 195, 423
- Forrest et al. (1976) Forrest, W. J., Houck, J. R., & Reed, R. A. 1976, ApJ, 208, L133
- Forrest et al. (2004) Forrest, W. J., Sargent, B., Furlan, E., et al. 2004, ApJS, 154, 443
- Furlan et al. (2006) Furlan, E., Hartmann, L., Calvet, N., et al. 2006, ApJS, 165, 568
- Furlan et al. (2009) Furlan, E., Watson, D. M., McClure, M. K., et al. 2009, ApJ, 703, 1964
- Furlan et al. (2011) Furlan, E., Luhman, K. L., Espaillat, C., et al. 2011, ApJS, 195, 3
- Gillett & Forrest (1973) Gillett, F. C., & Forrest, W. J. 1973, ApJ, 179, 483
- Gillett et al. (1975) Gillett, F. C., Jones, T. W., Merrill, K. M., & Stein, W. A. 1975, A&A, 45, 77
- Gillett & Stein (1969) Gillett, F. C., & Stein, W. A. 1969, ApJ, 155, L97
- Herbig (1968) Herbig, G. H. 1968, ZAp, 68, 243
- Hillenbrand (1997) Hillenbrand, L. A. 1997, AJ, 113, 1733
- Houck et al. (2004) Houck, J. R., Roellig, T. L., Van Cleve, J., et al. 2004, in Society of Photo-Optical Instrumentation Engineers (SPIE) Conference Series, Vol. 5487, Optical, Infrared, and Millimeter Space Telescopes, ed. J. C. Mather, 62–76
- Howarth & Smith (2001) Howarth, I. D., & Smith, K. C. 2001, MNRAS, 327, 353
- Humphreys (1978) Humphreys, R. M. 1978, ApJS, 38, 309
- Jaeger et al. (1994) Jaeger, C., Mutschke, H., Begemann, B., Dorschner, J., & Henning, T. 1994, A&A, 292, 641
- Jäger et al. (2003) Jäger, C., Dorschner, J., Mutschke, H., Posch, T., & Henning, T. 2003, A&A, 408, 193
- Kemper et al. (2004) Kemper, F., Vriend, W. J., & Tielens, A. G. G. M. 2004, ApJ, 609, 826
- Kemper et al. (2005) —. 2005, ApJ, 633, 534
- Kenyon & Hartmann (1995) Kenyon, S. J., & Hartmann, L. 1995, ApJS, 101, 117
- Kessler-Silacci et al. (2006) Kessler-Silacci, J., Augereau, J.-C., Dullemond, C. P., et al. 2006, ApJ, 639, 275
- Kessler-Silacci et al. (2005) Kessler-Silacci, J. E., Hillenbrand, L. A., Blake, G. A., & Meyer, M. R. 2005, ApJ, 622, 404
- Lebouteiller et al. (2011) Lebouteiller, V., Barry, D. J., Spoon, H. W. W., et al. 2011, ApJS, 196, 8
- Li & Draine (2001) Li, A., & Draine, B. T. 2001, ApJ, 554, 778
- Luhman et al. (2009) Luhman, K. L., Mamajek, E. E., Allen, P. R., & Cruz, K. L. 2009, ApJ, 703, 399
- Mathis (1990) Mathis, J. S. 1990, ARA&A, 28, 37
- Min et al. (2007) Min, M., Waters, L. B. F. M., de Koter, A., et al. 2007, A&A, 462, 667
- Moffett & Barnes (1979) Moffett, T. J., & Barnes, III, T. G. 1979, PASP, 91, 180
- Nguyen et al. (2010) Nguyen, A. N., Nittler, L. R., Stadermann, F. J., Stroud, R. M., & Alexander, C. M. O. 2010, ApJ, 719, 166
- Nguyen et al. (2007) Nguyen, A. N., Stadermann, F. J., Zinner, E., et al. 2007, ApJ, 656, 1223
- Nittler et al. (1998) Nittler, L. R., Alexander, C. M. O., Wang, J., & Gao, X. 1998, Nature, 393, 222
- Nittler et al. (1997) Nittler, L. R., Alexander, O., Gao, X., Walker, R. M., & Zinner, E. 1997, ApJ, 483, 475
- Pecaut & Mamajek (2013) Pecaut, M. J., & Mamajek, E. E. 2013, ApJS, 208, 9
- Poteet et al. (2015) Poteet, C. A., Whittet, D. C. B., & Draine, B. T. 2015, ApJ, 801, 110
- Przygodda et al. (2003) Przygodda, F., van Boekel, R., Àbrahàm, P., et al. 2003, A&A, 412, L43
- Rieke (1974) Rieke, G. H. 1974, ApJ, 193, L81
- Roche & Aitken (1984) Roche, P. F., & Aitken, D. K. 1984, MNRAS, 208, 481
- Sandford et al. (1995) Sandford, S. A., Pendleton, Y. J., & Allamandola, L. J. 1995, ApJ, 440, 697
- Sargent et al. (2006) Sargent, B., Forrest, W. J., D’Alessio, P., et al. 2006, ApJ, 645, 395
- Sargent et al. (2009a) Sargent, B. A., Forrest, W. J., Tayrien, C., et al. 2009a, ApJS, 182, 477
- Sargent et al. (2009b) —. 2009b, ApJ, 690, 1193
- Savage & Sembach (1996) Savage, B. D., & Sembach, K. R. 1996, ARA&A, 34, 279
- Sicilia-Aguilar et al. (2007) Sicilia-Aguilar, A., Hartmann, L. W., Watson, D., et al. 2007, ApJ, 659, 1637
- Siess et al. (2000) Siess, L., Dufour, E., & Forestini, M. 2000, A&A, 358, 593
- Sogawa et al. (2006) Sogawa, H., Koike, C., Chihara, H., et al. 2006, A&A, 451, 357
- Stadermann et al. (2009) Stadermann, F. J., Floss, C., Bose, M., & Lea, A. S. 2009, Meteoritics and Planetary Science, 44, 1033
- Torres-Dodgen et al. (1991) Torres-Dodgen, A. V., Carroll, M., & Tapia, M. 1991, MNRAS, 249, 1
- van Boekel et al. (2004) van Boekel, R., Min, M., Leinert, C., et al. 2004, Nature, 432, 479
- Vollmer et al. (2009) Vollmer, C., Hoppe, P., Stadermann, F. J., Floss, C., & Brenker, F. E. 2009, Geochim. Cosmochim. Acta, 73, 7127
- Watson et al. (2009) Watson, D. M., Leisenring, J. M., Furlan, E., et al. 2009, ApJS, 180, 84
- Werner et al. (2004) Werner, M. W., Roellig, T. L., Low, F. J., et al. 2004, ApJS, 154, 1
- Whittet (2015) Whittet, D. C. B. 2015, ApJ, 811, 110
- Whittet & van Breda (1980) Whittet, D. C. B., & van Breda, I. G. 1980, MNRAS, 192, 467
- Whittet et al. (1997) Whittet, D. C. B., Boogert, A. C. A., Gerakines, P. A., et al. 1997, ApJ, 490, 729
- Zhao et al. (2013) Zhao, X., Floss, C., Lin, Y., & Bose, M. 2013, ApJ, 769, 49