Evidence for magnetic field compression in shocks within the jet of V404 Cyg
Abstract
We present optical and near-IR linear polarimetry of V404 Cyg during its 2015 outburst and in quiescence. We obtained time resolved -band polarimetry when the source was in outburst, near-IR polarimetry when the source was near quiescence and multiple wave-band optical polarimetry later in quiescence. The optical to near-IR linear polarization spectrum can be described by interstellar dust and an intrinsic variable component. The intrinsic optical polarization, detected during the rise of one of the brightest flares of the outburst, is variable, peaking at 4.5 per cent and decaying to 3.5 per cent. We present several arguments that favour a synchrotron jet origin to this variable polarization, with the optical emission originating close to the jet base. The polarization flare occurs during the initial rise of a major radio flare event that peaks later, and is consistent with a classically evolving synchrotron flare from an ejection event. We conclude that the optical polarization flare represents a jet launching event; the birth of a major ejection. For this event we measure a rather stable polarization position angle of -9∘ E of N, implying that the magnetic field near the base of the jet is approximately perpendicular to the jet axis. This may be due to the compression of magnetic field lines in shocks in the accelerated plasma, resulting in a partially ordered transverse field that have now been seen during the 2015 outburst. We also find that this ejection occurred at a similar stage in the repetitive cycles of flares.
keywords:
binaries: close – stars: fundamental parameters – stars: individual: V404 Cyg – stars: neutron – X-rays: binaries1 INTRODUCTION
Polarimetry can provide a unique probe of X-ray binaries, since (1) we can obtain information on the geometrical property of the binary system from the light scattered by circumstellar matter (stellar wind and/or an accretion disc) at a scale not accessible to present imaging techniques or (2) information on jets (e.g., geometry, magnetic field, electron energy) from the synchrotron emission. A significant fraction of the optical emission in low-mass X-ray binaries (LMXBs) is produced by the accretion disc surrounding the compact object. The accretion disc is heated by X-rays originating near the central source and hydrogen is completely ionized in the entire disc (van Paradijs & McClintock, 1994; Charles & Coe, 2006; Spruit, 2014).
Therefore, optical linear polarization at the few per cent level caused by Thomson scattering of the emitted radiation with the free electrons in the disc is expected at these wavelengths (Brown, McLean, & Emslie, 1978; Dolan, 1984; Cheng et al., 1988; Schultz, 2000). The polarization due to the scattering of intrinsically unpolarized thermal emission can be modulated on the orbital period, which places constraints on the physical and geometrical properties of the system (Dolan & Tapia, 1989; Gliozzi et al., 1998).
In LMXBs, there is also one emission mechanism that intrinsically produces polarized light – synchrotron emission from particles in a sufficiently well-ordered magnetic field in a collimated outflow. Optically thin synchrotron emission is intrinsically polarized. If the local magnetic field in the emitting region is uniform (ordered), a net linear polarization is observed. If the field is tangled, the differing angles of the polarized light suppress the observed, average polarization. In the case of a perfectly ordered field the maximum polarization strength is 70–80 percent, (Rybicki & Lightman, 1979; Bjornsson & Blumenthal, 1982) and is dependent only on the degree of ordering of the field and the energy distribution of the electron population. The polarimetric measurements of the optically thin synchrotron emission provide a powerful tool to probe the nature of magnetic field structure.
V404 Cyg (=GS 2023+338), was discovered with the all-sky monitor aboard Ginga on 1989 May 22 (Makino et al., 1989). Previously, V404 Cyg had at least two outbursts, in 1938 and 1956, which were only observed at optical wavelengths because of the lack of X-ray space instruments at that time. This lack of X-ray knowledge meant that V404 Cyg was mis-classified as a classical (albeit recurrent) nova.
V404 Cyg is known to contain a K0 III-V secondary star orbiting a 10black hole (Shahbaz et al., 1994, 1996) with an orbital period of 6.5 d (Casares, Charles, & Naylor, 1992) and is located at a precise distance of 2.4 kpc, obtained using radio parallax measurements (Miller-Jones et al., 2009). During outburst V404 Cyg varies in X-ray flux by a factor of 500 on timescales of seconds (Kitamoto et al., 1989) and a factor of 2–10 on timescales of 30 min to a few hours in quiescence (Wagner et al., 1994; Kong et al., 2002; Hynes et al., 2004).
Recently, on 2015 June 15 (MJD 57188), V404 Cyg went into its fourth outburst. It was first detected by the X-ray satellite Swift (BAT and XRT; Barthelmy et al., 2015) and then with MAXI, and INTEGRAL (Negoro et al., 2015; Kuulkers et al., 2015). The outburst, triggered by a viscous-thermal instability close to the inner edge of the truncated accretion disc (Bernardini et al., 2016). The early ATEL alerts triggered follow-up observations at all wavelengths, from radio (Mooley et al., 2015) to hard X-rays and the source reached up to 50 Crab in hard X-rays (Rodriguez et al., 2015), with extreme flaring activity at all wavelengths (e.g. Mooley et al., 2015; Garner et al., 2015; Ferrigno et al., 2015; Motta et al., 2015a, b; Natalucci et al., 2015; Tetarenko et al., 2015; Tsubono et al., 2015; Kimura et al., 2016; Gandhi et al., 2016; Martí, Luque-Escamilla, & García-Hernández, 2016). In this paper we present the results of our optical and near-IR polarimetry of V404 Cyg during its 2015 outburst and in quiescence after the outburst.
| ut Date | Band | (%) | (∘) |
|---|---|---|---|
| 2016 May 26 | 7.690.61 | 5.1 2.1 | |
| 2016 May 26 | 7.410.32 | 7.2 1.1 | |
| 2016 May 26 | 6.000.16 | 6.3 0.7 | |
| 2016 May 26 | 5.360.14 | 6.9 0.6 | |
| 2015 July 27 | 3.330.05 | -7.5 4.3 | |
| 2015 July 27 | 2.220.04 | -9.9 3.8 | |
| 2015 July 27 | 1.330.08 | 0.2 12 |
2 OBSERVATIONS AND DATA REDUCTION
2.1 TNG optical observations
Time-resolved optical polarimetry of V404 Cyg was obtained with the 3.5 m Telescopio Nazionale Galileo (TNG) at the Observatorio del Roque de los Muchachos, La Palma, Spain, during the night of ut 2015 June 23. The polarimeter PAOLO (Polarimetric Add-On for the LRS Optics; Covino et al., 2014) was used, which consists of a double Wollaston prism mounted in the filter wheel, producing four simultaneous polarization states of the field of view. The optical setup of the polarimeter is described in Oliva (1997). The images are separated by the prism producing four simultaneous image slices on the CCD that correspond to four different position angles with respect to the telescope axis (0∘, 45∘, 90∘ and 135∘). Measurements of the flux in these four images allows one to measure the degree of linear polarization of a source. Since the instrument is mounted on the Nasmyth focus of the TNG, the instrumental polarization of the order of 2–3 per cent varies with parallactic angle (Giro et al., 2003). Therefore, in order to determine the instrumental polarization model we observed the zero polarized standard star HD 154892 over a wide range of parallactic angles. The filter was used for all the observations and given the brightness of V404 Cyg, we used an exposure time of 2 s and obtained time-resolved polarimetry for 1.92 hr (ut 2015-06-24 02:53 to 04:48; MJD 57197.1211 to 57197.2003). Bias images were taken as well as dome flat-field images. The conditions were good with a median seeing of 0.9 arcsec.
2.2 NOT optical observations
Broad-band optical polarimetry of V404 Cyg was obtained with the 2.5 m Nordic Optical Telescope (NOT) at the Observatorio del Roque de los Muchachos, La Palma, Spain, during ut 2016 May 26 (MJD 57534.2). Linear polarimetry was performed using a half wave plate in the FAPOL unit and a calcite plate mounted in the aperture wheel. The calcite plate provides the simultaneous measurement of the ordinary and the extraordinary components of two orthogonally polarized beams. Images were taken at half wave plate rotation angle 0∘, 22.5∘, 45∘, and 67.5∘ and the linear polarization () and the position angle () were determined. We also observed a non-polarized star and polarized star to determine the instrumental and position angle offset, respectively. We obtained images in the , , and bandpasses using exposure times of 300 sec, 120 sec, 120 sec and 300 sec, respectively. Bias images and dome flat-fields were taken. The conditions were good with a seeing of 0.7 arcsec.
2.3 Optical data reduction
The data reduction for the TNG and NOT data was performed using the ultracam software (Dhillon et al., 2007). The flat-field images were first de-biased using the bias image and then combined to create a master flat-field. The science images were also de-biased and then flat-fielded in the standard way. Aperture photometry was then performed on the science targets, comparison stars and standard stars using a fixed aperture. For the quiescent data, the good seeing allows us to mask the line-of-sight contaminating star 1.4 arcsec north of V404 Cyg (Udalski & Kaluzny, 1991) before performing the aperture photometry. The results were checked with daohphot profile fitting, where the line-of-sight star was removed before performing aperture photometry, and the results were found to be the same. Optimal subtraction (Naylor, 1998), which is well suited for crowded fields was also peformed and the results were found to be the same as using aperture photometry with a mask. The normalized Stokes parameters and are then determined as well as the fractional linear polarization and position angle . The errors in the counts are dominated by photon shot noise while the theoretical errors in were estimated by propagation of errors. In addition, we calculated the errors in () using a Monte Carlo method, which returned values similar to those estimated from error propagation. Given the large values for (30) no correction for statistical polarization bias was performed (Wardle & Kronberg, 1974); the bias has the effect of increasing the estimated if the errors on and are large (usually due to low signal-to-noise data), because is a positive quantity whereas and can be positive or negative.
For the TNG data the Stokes and parameters of the target and other stars were determined and corrected for the instrumental polarization as described in Covino et al. (2014). The modelling of the instrumental polarization was done using the unpolarized standard stars over a wide range of parallactic angles and with PAOLO it has been shown that it can be done to better than 0.2 per cent. The procedure to derive an instrumental model implies a correction for the position angle of the instrument. After applying the instrumental model we determine the instrument-corrected and light curves and hence and . For the NOT data, the instrumental polarization was determined from the zero polarized standard star and was found to be negligible, less than 0.1 per cent.
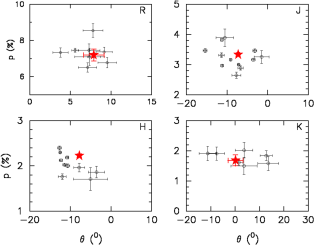
In Table 1 we give the optical polarization results obtained for V404 Cyg during quiescence. In Fig. 1 we show the -band as a function of for V404 Cyg and other stars in the field-of-view. Both and for V404 Cyg are similar to the values measured from the field stars, which cluster around a common value. The mean optical VRIz position angle of V404 Cyg is 6.4∘.
2.4 WHT Near-IR
We observed V404 Cyg with the Long-slit Intermediate Resolution Infrared Spectrograph (LIRIS) in imaging polarimetry mode on the 4.2-m William Herschel Telescope (WHT) at the Observatorio del Roque de los Muchachos, La Palma, Spain. The data were taken on 2015 July 27 ut 22:01 to 22:40. Exposures were made in a five-point dither pattern, separately in the , and filters. The Wollaston prism splits the incoming light into four simultaneous images, one at each of the four polarization angles; 0∘, 45∘, 90∘ and 135∘. We made use of the achromatic half-wave plate which cancels the relative transmission factors of the ordinary and extraordinary rays for each Wollaston and saves observing time since camera rotation significantly increases overheads. In principle this removes the need to observe a polarized standard star as the position angle offset should be zero. The conditions were good with a median seeing of 0.6 arcsec.
The data reduction was performed using the lirisdr package developed by the LIRIS team in the iraf111iraf is distributed by the National Optical Astronomy Observatory, which is operated by the Association of Universities for Research in Astronomy, Inc., under cooperative agreement with the National Science Foundation. http://iraf.noao.edu/ environment (for details see Alves et al., 2011). Aperture photometry was then performed on the resulting combined images using a fixed aperture (2 times the average seeing) and the normalized Stokes parameters and , and and were determined using the equations that apply to half-wave plate data. Errors on and were computed using a Monte Carlo routine that propagates the errors associated with the raw counts at each polarization angle. The instrumental polarization is not significant and is known to be very small for LIRIS; 0.1 per cent (Alves et al., 2011). Given the large values for (50) no correction for for statistical polarization bias was performed (Wardle & Kronberg, 1974).
In Table 1 we give the near-IR polarization results obtained for V404 Cyg and in Fig. 1 we plot the near-IR as a function of for V404 Cyg and other stars in the field-of-view. Both and for V404 Cyg are similar to the values measured from the field stars, which cluster around a common value. The mean near-IR position angle of V404 Cyg is -6∘.
3 RESULTS
3.1 Polarization spectral energy distribution
During the 2015 outburst of V404 Cyg there were a number of linear polarization measurements taken at different times which have very similar -band polarization values; 8 per cent on Jun 17 (Itoh et al., 2015), 7.5 on Jun 18 (Blay et al., 2015) and 7.70.1 per cent on Jun 18 and Jun 19 (Panopoulou, Reig, & Blinov, 2015), 7.8 per cent on Jun 20 (Tanaka et al., 2016). All latter measurements have almost identical values, suggesting that it is most likely the constant level of the interstellar polarization. We also find that the -band polarization level we measure in quiescence (Table 1) is very similar to these values, which further suggests that this polarization level of 7–8 per cent is not due to some intrinsic origin present only during outburst. V404 Cyg has a dust extinction of –4.4 (Shahbaz et al., 2003; Hynes et al., 2009) so interstellar optical polarization is expected. A linear relation between the maximum optical polarization caused by interstellar dust (Serkowski, Mathewson, & Ford, 1975) implies a polarization level of per cent for V404 Cyg, which is consistent with the observed 7–8 per cent.
In one case, variable optical polarization was reported in V404 Cyg during its outburst (Lipunov et al., 2016) which implies that part of the optical polarization is due to an intrinsic, variable component, most likely from synchrotron radiation from a jet (see Section 4). An intrinsic component arising from the accretion disc is also likely to be present, but this is expected to be very low, at the 1 per cent level . Therefore, given the high extinction, the polarization of V404 Cyg determined when the source is in quiescence, represents the dust component along the light-of-sight.
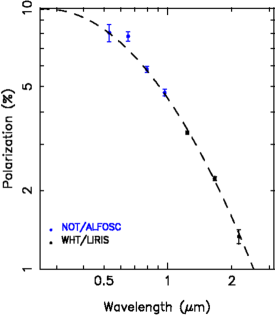
To determine the dust component we fit the optical and near-IR polarization measurements with the interstellar dust model. The wavelength dependence of the interstellar polarization (due to aligned dust grains) can be described empirically using the Serkowski law (Serkowski, 1974);
| (1) |
where is the percentage polarization at wavelength , is the maximum polarization which occurs at wavelength . The curve width parameter has been found to be closely related to , with the most recent determination from observations of 105 stars being K=0.01 + 1.66 (Whittet et al., 1992). We fit the optical and near-IR linear polarization data with the empirical formula of Serkowski and find = 0.30 m and = 9.650.36 per cent (see Fig. 2). The optical ( ) and near-IR ( ) position angle is expected to be constant, although there seems to be an offset of between them, which is most likely due to a non-zero near-IR position angle offset (see Section 2.4). The constant position angle with a steep decrease in polarization towards longer wavelengths supports the interstellar origin of the polarization observations taken during quiescence, and near quiescence for the near-IR data. Since the near-IR data fit the interstellar law so well, we find no clear evidence for an additional intrinsic source of polarization in the near-IR data which were taken near the end of the outburst.
3.2 Time resolved polarization light curve of V404 Cyg
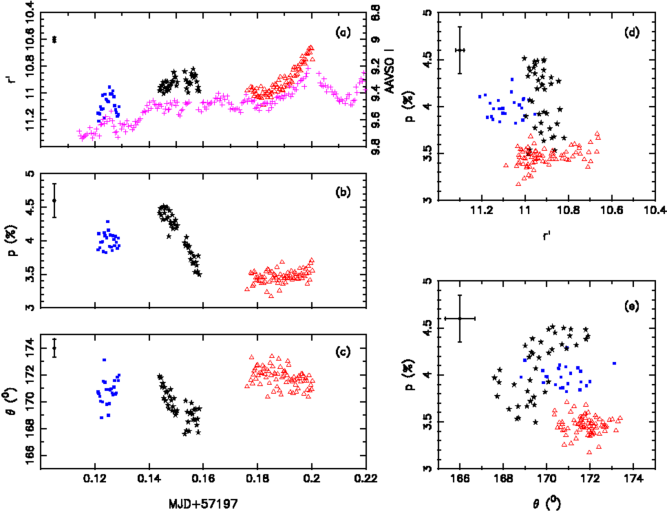
To determine the intrinsic and values of V404 Cyg during outburst, we subtract the and values obtained from the NOT -band data (the and central wavelengths are very similar) from the -band and time resolved values of V404 Cyg taken during outburst. Fig. 3 shows the -band, and light curves intrinsic to V404 Cyg. As one can see the polarization is variable, with a mean of 3.7 per cent and a variation of from 3.2 to 4.5 per cent, whereas the mean position angle is 171∘ with a variation from 167∘ to 173∘. There appears to be a rise, then fall in the level of polarization while the optical flux is relatively steady, followed by a more constant, lower polarization level while the optical flux is rising.
4 DISCUSSION
4.1 Origin of the variable polarization
In order to constrain the origin of the polarization flare, we compare its properties to what is expected from possible sources of polarization. The polarization flare seen in Fig. 3b decayed fairly smoothly from 4.5 to 3.5 per cent in approximately 20 minutes, and the mean level of polarization before and after the flare differed. Interstellar dust between V404 Cyg and the Earth has already been subtracted, so the remaining variable polarization must originate within the binary system. Variable (i.e. moving) screens of dust or lighter matter local to the system, perhaps produced by the outburst itself, are unlikely to be the cause of the variable polarization. A fast, neutral accretion disc wind is produced during the outburst (Muñoz-Darias et al., 2016), but any optical extinction caused by the wind would reduce the flux and redden the optical colour, as well as possibly change the fractional polarization. During the 20-minute polarization flare, the optical flux and colour do not change (Fig. 3a and Fig. 4), so extinction changes can be ruled out.
Thompson scattering of thermal, unpolarized photons from the accretion disc could produce variable polarization, but the timescale of variability is expected to be on the orbital period and stronger at bluer wavelengths (e.g. Brown, McLean, & Emslie, 1978; Cheng et al., 1988). This has been observed in some X-ray binaries, with a modulation of polarization seen on the orbital period in systems in outburst (Michalsky, Swedlund, & Stokes, 1975; Gliozzi et al., 1998) and quiescence (Dolan & Tapia, 1989). The orbital period of V404 Cyg is 6.5 days; much longer than the timescales of variability we observe, and longer timescale polarization studies during the outburst (Lipunov et al., 2016; Tanaka et al., 2016) have not detected a modulation. It is therefore unlikely that scattering of unpolarized light causes the variable polarization.
The bright optical flaring seen throughout the outburst of V404 Cyg probably has both thermal (from the accretion disc) and non-thermal (synchrotron jet) components (see Gandhi et al., 2016, and references therein). Synchrotron jet emission at optical–near-IR wavelengths in X-ray binaries is associated with emission close to the base of the jet, and is found to be highly variable from hour down to sub-second timescales (e.g. Hynes et al., 2003; Casella et al., 2010; Gandhi et al., 2011; Kalamkar et al., 2016) and polarized, usually at a level of a few per cent (Dubus & Chaty, 2006; Russell & Fender, 2008; Shahbaz et al., 2008; Chaty, Dubus, & Raichoor, 2011; Russell & Shahbaz, 2014; Baglio et al., 2014). Jet synchrotron emission is therefore a viable candidate for the variable polarization.
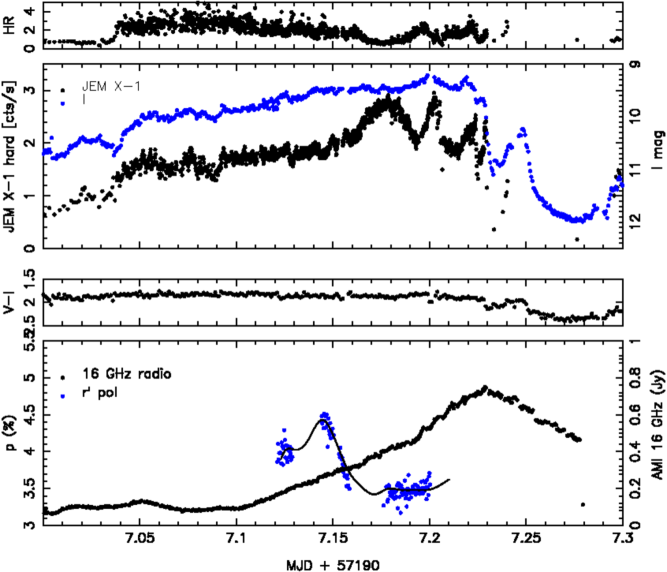
Rodriguez et al. (2015) identify and label various flare events during the outburst of V404 Cyg. Flare XIII reached a flux level of 40 Crab, with a peak flux lasting 1.5 h that was preceded by a 3 h long, 3 Crab plateau observed only above 13 keV. With the exception of two flare events, IV and XIII, most of the optical flares show a fast rise (1 h) similar to the flares observed in X-rays. Flare events IV and XIII have slower rise times (about 10 and 4 h, respectively), and are both coincident with hard plateaus that precede the X-ray peaks. An optical and X-ray plateau is observed before a very bright flare. Fig. 4 shows the INTEGRAL JEM-X (5–10 keV) and AAVSO -band light curves of V404 Cyg around the time of our TNG polarimetry (MJD 57197.12 to 57197.20). As one can see, a huge X-ray flare (labelled flare XIII in Rodriguez et al., 2015) was observed with JEM-X from MJD 57197.15 to 57197.20, reaching 40 Crab in flux and during which the hardness ratio decreases. The top two panels of Fig. 4 show that the X-ray flux and its hardness ratio (black dots) were highly variable, especially soon after the polarization flare. A bright, prominent radio (16 GHz) flare was observed with the Arcminute Microkelvin Imager Large Array (AMI-LA), peaking just a few hours after the optical polarization flare (AMI-LA data are from Fender et al. in preparation). Note that the AMI-LA does not give polarisation information. Concurrently, the optical flux (bottom panel; data from AAVSO) brightens to a peak flare a few hours after the polarization flare, and then fades rapidly, with two smooth dips in the light curve and a change in the colour following the flare. The timing of the polarization flare does not correspond to any specific feature in either the X-ray or optical light curves; it occurs during the plateau / slow rise of the optical and X-ray fluxes before the brightest flares. The polarization flare does however occur during the initial stages of the rise of the radio flux.
If the optical synchrotron emission originates near the jet base, and the bright flare at radio wavelengths is predominantly from emission downstream at larger scales further down the jet, then they may be associated with the propagation of one single ejection event. This is supported by 5 GHz radio data from the e-Multi-Element Radio Linked Interferometer Network (eMERLIN; from Fender et al. in preparation; data not shown here) which also show a peak in the light curve. The 16 GHz and 5 GHz flares peak at 2.0 h and 3.8 h respectively, after the -band polarization flare. We first observe the jet base in polarization at optical wavelengths, and then the radio flares, which arise from emission along the jet downstream. The three flares describe a classically evolving synchrotron flare from an ejection. This strongly suggests that a jet launching event occured at the time of the polarization flare, and implies that we have discovered the signature of a major ejection being launched, from optical polarization.
The 16 GHz radio flare peaks at a flux density of Jy. The optical magnitude at the time of the polarization flare is , which corresponds to a de-reddened (assuming ) flux density of 3.8 Jy. The synchrotron emission may contribute a fraction of the flux, and since optically thin synchrotron emission can be up to per cent polarized, the flux density of the synchrotron could be as low as 0.25 Jy. If the optical synchrotron flux density is 0.25 – 3.8 Jy then the spectral index from 16 GHz to -band (at Hz) at the flare peak is (where ), consistent with being a flat spectrum. This is similar to what was found for the near-IR and radio flares of GRS 1915+105, in which oscillations in -band (2.2 m) and 15 GHz radio (2.0 cm) had similar timescales, morphologies and flux densities (Fender & Pooley, 1998; Mirabel et al., 1998). Continuously launched, hard state jets typically have flat or slightly inverted spectra, that are produced by the overlapping synchrotron spectra of many individual plasma ejections. Here, it appears we are witnessing an individual ejection evolving from optical to radio wavelengths, over a frequency range spanning 4.5 orders of magnitude.
Miller-Jones et al. (in prep.) present Very Long Baseline Array data from the 2015 outburst of V404 Cyg, showing evidence that the resolved radio jet orientation changes over time. A preliminary analysis suggests that the position angle of the jet varied between -16∘ and +10∘ E of N. For optically thin synchrotron emission, the polarization position angle is parallel to the electric vector and perpendicular to the magnetic field vector. We measure a rather stable polarization position angle of -9 ∘ E of N from the optical data. This implies that the electric field vector near the base of the jet in V404 Cyg is on average approximately parallel to the jet axis, implying that the magnetic field is orthogonal to the jet axis. This may be due to the compression of magnetic field lines in shocks in the flow, resulting in a partially ordered transverse field.
4.2 Comparison to other polarimetry measurements
Lipunov et al. (2016) also observed variable linear polarization in V404 Cyg during its 2015 outburst. Even though they could not determine the absolute value for the polarization, they report changes of 4–6 per cent over timescales of 1 h during two different epochs.
During several nights within the outburst, Tanaka et al. (2016) obtained -band polarimetry of V404 Cyg and several bright stars. They found that the -band and of V404 Cyg and the surrounding field stars showed similar levels and direction, respectively. They also determined the to -band polarization and position angle spectrum and concluded that the decrease in polarization towards the infrared with constant positon angle, suggests that the polarization is interstellar in origin. Our broad-band polarimetry also suggests an interstellar dust component dominates the overall polarization spectral energy distribution (see Section 3.1). However, the fact that we observe a variable component (as did Lipunov et al., 2016), suggests that there is an additional source for the variable polarization, and we argue above that this is most likely due to synchrotron emission from a jet.
Tanaka et al. (2016) also obtained simultaneous - and -band light curves on MJD 57193 and 57194 that showed very similar structures; a long plateau of slowly rising flux, followed by a rapid decline in flux. However, on MJD 51793 a -band near-IR flare was observed peaking around MJD 57193.5, 2 h before the shoulder of the subsequent rapid decline in flux, with no corresponding enhancement in the -band. The observed red colour and short duration of the near-IR flare suggest synchrotron emission from a jet. Indeed, the -band peak flux density of the flare reached the same level as the giant radio and sub-mm flares observed by RATAN-600 and SMA (Sub Millimeter Array) on MJD 57198.933 and MJD 57195.55, respectively (Trushkin, Nizhelskij, & Tsybulev, 2015; Tetarenko et al., 2015). As shown in Tanaka et al. (2016), the radio flux observed during the giant radio and sub-mm flares extrapolates to the -band peak flux density by assuming a flat spectral index. This is similar to the flat spectrum found between our optical polarization flare and the following radio flare.
During this near-IR flare reported by Tanaka et al. (2016), at first glance the -band polarization and position angle does not show any significant temporal variation, indicating that the near-IR emission is not strongly polarized. However, the errors on the polarization are large, and the -band polarization does in fact change from per cent to per cent during the near-IR flare, which is slightly larger than the change in polarization that we detected (with much higher significance) from the TNG data (from 4.5 to 3.5 per cent; see Fig. 3b). The reason why the near-IR polarization change is not significant is because the errors are large enough that these fluctuations are consistent with the scatter in polarization at other times. Therefore one cannot uncover small amplitude flares in the polarization. We therefore cannot rule out a small polarization flare of amplitude per cent being present during the near-IR flux flare observed by Tanaka et al. (2016) which, if present, would be in line with our results. However, the low level of -band polarization suggests that either the synchrotron emission is optically thin and the magnetic field is predominantly tangled, or that the jet synchrotron emission is in the optically thick regime and the magnetic field is highly ordered. Since no corresponding -band flare is observed, the optically thick synchrotron emission perhaps does not extend up to the -band. The fact that we observe a polarized flare in the -band, while the optical flux remained steady, suggests that the majority of the optical flux does not originate in the polarized jet component, and that the jet component itself is polarized by a stronger amount than observed. It could therefore be that the jet synchrotron emission is in the optically thin regime and that the spectral break from optically thick to thin lies between and -band (at a frequency of Hz; this is also implied in Fig. 5 of Tanaka et al., 2016). This frequency for the jet spectral break is consistent with that found from data taken during the hard state decay of the 1989 outburst of V404 Cyg ( Hz; Russell et al., 2013).
4.3 Repetitive cycles of jet production
Kimura et al. (2016) show that there are significant periods of repetitive optical variations during the 2015 outburst of V404 Cyg. For example, the optical light curves taken on MJD 57197 (see Fig. 4), 57193 and 57194 (Tanaka et al., 2016) show very similar structures; a long plateau before a rapid decline in flux. However, on MJD 51793 a -band flare was observed peaking around MJD 57193.5, 2 h before the shoulder of the subsequent rapid decline in flux, with no corresponding enhancement in the -band. The near-IR flare suggests at least two processes are responsible for the optical–near-IR emission. A similar conclusion was reached by Gandhi et al. (2016), who discovered remarkable, high amplitude sub-second optical flaring on one date; 26 June. These rapid flares had a red spectrum and were interpreted as originating from optically thin synchrotron emission from the compact jet; the same as Tanaka et al. (2016) concluded for the origin of the near-IR flare. The polarization flare seen with TNG, and the near-IR flare reported by Tanaka et al. (2016) both occured during the rise of a bright optical and 3 Crab X-ray plateau that precedes a very bright flare (see Fig. 4).
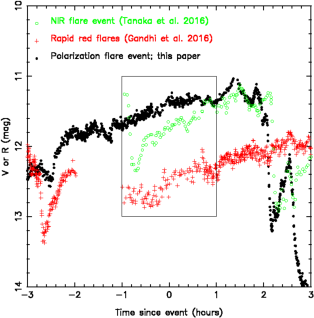
In Fig. 5 we show the AAVSO and Tanaka et al. (2016) optical light curves centred on three events: the optical polarization flare reported here (black pluses; zero is MJD 57197.142), the near-IR flux flare seen by Tanaka et al. (2016) (green crosses; MJD 57193.543) and the time of the rapid red flares seen by Gandhi et al. (2016) (red crosses; MJD 57199.215). It is clear that all three events occurred during a steady, slow rise of the flux (i.e., the plateau) before some of the brightest flares of the outburst. In the case of the polarization flare and the near-IR flare, the two happened almost exactly 2 hours before a rapid drop in the optical flux, in fact the shape of the rise and drop are very similar on the two dates. Since all three events are associated with core jet activity, we conclude that ejections are produced at this specific stage of the flaring cycles of V404 Cyg during its 2015 outburst. In addition, some of the brightest radio and mm flares, which trace the large scale jet emission, occurred simultaneously with the brightest optical and X-ray flares, (Rodriguez et al., 2015; Muñoz-Darias et al., 2016), further implying that single ejection events are being produced during the flare rises. This is certainly the case for the optical polarization flare (Fig. 4).
One possible interpretation follows. The 3-Crab X-ray plateau during which the polarization flare is detected, could be associated with many smaller ejections (a more continuous jet), and would therefore be associated with more shocks in the jet ejecta close to the core. Evidence of the launching of many small ejections comes from the rapid optically thin flares detected also during a plateau stage by Gandhi et al. (2016). The polarization flare (and possibly the near-IR flare seen by Tanaka et al., 2016) could signify compression of the magnetic field due to many small shocks in the jet during this plateau. This naturally explains the polarization position angle observed, which is consistent with a shock compressed magnetic field perpendicular to the jet axis, like the high polarization observed in downstream shocks in AGN jets, and the high radio polarization in X-ray binaries from discrete ejecta/shocks (e.g. Hannikainen et al., 2000; Fender et al., 2002; Brocksopp et al., 2007; Curran et al., 2014). In this interpretation, the polarization flare signifies the birth of a major ejection event caused by an intermittent outflow and resulting in a prominent radio flare. This is not dissimilar to what has been seen in the past in GRS 1915+105 (see for example Fig. 4 of Klein-Wolt et al., 2002).
5 CONCLUSIONS
We find:
-
•
that the optical to near-IR linear polarization spectrum can be described by interstellar dust and an intrinsic variable component
-
•
that the intrinsic optical polarization, detected during the rise of one of the brightest flares of the outburst, is variable, peaking at 4.5 per cent and decaying to 3.5 per cent
-
•
that we favour a synchrotron jet origin to this variable polarization, with the optical emission originating close to the jet base
-
•
that the 16GHz and 5GHz flares peak at 2 h and 4 h respectively, after the -band polarization flare, which is consistent with a classically evolving synchrotron flare from an ejection.
We conclude that we have witnessed a plasma ejection evolving over 4.5 orders of magnitude in frequency, from optical to radio, and that the optical polarization flare represents a jet launching event; the birth of a major ejection. For this event we measure a rather stable polarization position angle of -9 ∘ E of N from the optical data. This implies that the electric field vector near the base of the jet in V404 Cyg is on average approximately parallel to the jet axis, implying that the magnetic field is orthogonal to the jet axis. This may be due to the compression of magnetic field lines in shocks in the flow, resulting in a partially ordered transverse field. We also find that this ejection occured at a similar stage in the repetitive cycles of flares, as other indicators of jet launching found previously: rapid sub-second optical flaring, and excess near-infared emission.
ACKNOWLEDGEMENTS
We thank the referee Prof. Phil Charles for his valuable comments. We thank James Miller-Jones and Gregory Sivakoff for information related to the imaging of the resolved radio jet of V404 Cyg that will appear in Miller-Jones et al. in preparation. This article is based on scheduled observations made with the William Herschel Telescope, the Telescopio Nazionale Galileo and the Nordic Optical Telescope operated on the island of La Palma by the Isaac Newton Group, the Fundaciǿn Galileo Galilei of the INAF (Istituto Nazionale di Astrofísica) and the Nordic Optical Telescope Scientific Association, respectively, in the Spanish Observatorio del Roque de los Muchachos of the Instituto de Astrofísica de Canarias. This research has been supported by the Spanish Ministry of Economy and Competitiveness (MINECO) under the grant AYA 2013-42627. RPF acknowledges support from ERC Advanced Investigator Grant 267607 ’4 PI SKY’. We acknowledge with thanks the variable star observations from the AAVSO International Database contributed by observers worldwide and used in this research. Swift/BAT transient monitor results were provided by the Swift/BAT team. CR is grateful for the support of STFC Studentships and also acknowledges the support of Cambridge University. This work has been supported by ASI grant I/004/11/2.
References
- Alves et al. (2011) Alves F. O., Acosta-Pulido J. A., Girart J. M., Franco G. A. P., López R., 2011, AJ, 142, 33
- Barthelmy et al. (2015) Barthelmy, S. D., D’Ai, A., D’Avanzo, P., Krimm, H. A., Lien, A. Y., Marshall, F. E., Maselli, A., Siegel, M. H. 2015, GRB Coordinates Network, 17929, 1
- Baglio et al. (2014) Baglio M. C., Mainetti D., D’Avanzo P., Campana S., Covino S., Russell D. M., Shahbaz T., 2014, A&A, 572, A99
- Bernardini et al. (2016) Bernardini F., Russell D. M., Shaw A. W., Lewis F., Charles P. A., Koljonen K. I. I., Lasota J. P., Casares J., 2016, ApJ, 818, L5
- Bjornsson & Blumenthal (1982) Bjornsson C.-I., Blumenthal G. R., 1982, ApJ, 259, 805
- Blandford Königl (1979) Blandford R. D., Königl A., 1979, ApJ, 232, 34
- Blay et al. (2015) Blay P., Munoz-Darias T., Kajava J., Casares J., Motta S., Telting J., 2015, ATel, 7678, 1
- Brocksopp et al. (2007) Brocksopp C., Miller-Jones J. C. A., Fender R. P., Stappers B. W., 2007, MNRAS, 378, 1111
- Brown, McLean, & Emslie (1978) Brown J. C., McLean I. S., Emslie A. G., 1978, A&A, 68, 415
- Casares, Charles, & Naylor (1992) Casares J., Charles P. A., Naylor T., 1992, Natur, 355, 614
- Casella et al. (2010) Casella P., et al., 2010, MNRAS, 404, L21
- Charles & Coe (2006) Charles P.A., Coe, M.J., in Walter Lewin and Michiel van der Klis, eds, Cambridge Astrophysics Series, No. 39, Compact stellar X-ray sources. Optical, ultraviolet and infrared observations of X-ray binaries. Cambridge University Press, Cambridge, p. 215
- Chaty, Dubus, & Raichoor (2011) Chaty S., Dubus G., Raichoor A., 2011, A&A, 529, A3
- Cheng et al. (1988) Cheng F. H., Shields G. A., Lin D. N. C., Pringle J. E., 1988, ApJ, 328, 223
- Covino et al. (2014) Covino S., et al., 2014, AN, 335, 117
- Curran et al. (2014) Curran P. A., et al., 2014, MNRAS, 437, 3265
- Dhillon et al. (2007) Dhillon V. S. et al., 2007, MNRAS, 378, 825
- Dolan (1984) Dolan J. F., 1984, A&A, 138, 1
- Dolan & Tapia (1986) Dolan J. F., Tapia S., 1986, BAAS, 18, 968
- Dolan & Tapia (1989) Dolan J. F., Tapia S., 1989, PASP, 101, 1135
- Dubus & Chaty (2006) Dubus G., Chaty S., 2006, A&A, 458, 591
- Fender & Pooley (1998) Fender R. P., Pooley G. G., 1998, MNRAS, 300, 573
- Fender et al. (2002) Fender R. P., Rayner D., McCormick D. G., Muxlow T. W. B., Pooley G. G., Sault R. J., Spencer R. E., 2002, MNRAS. 336, 39
- Ferrigno et al. (2015) Ferrigno C., et al., 2015, ATel, 7662, 1
- Gandhi et al. (2011) Gandhi P., et al., 2011, ApJ, 740, L13
- Gandhi et al. (2016) Gandhi P., et al., 2016, MNRAS, 459, 554
- Garner et al. (2015) Garner A., et al., 2015, ATel, 7663, 1
- Giro et al. (2003) Giro E., Bonoli C., Leone F., Molinari E., Pernechele C., Zacchei A., 2003, SPIE, 4843, 456
- Gliozzi et al. (1998) Gliozzi M., Bodo G., Ghisellini G., Scaltriti F., Trussoni E., 1998, A&A, 337, L39
- Hannikainen et al. (2000) Hannikainen D. C., Hunstead R. W., Campbell-Wilson D., Wu K., McKay D. J., Smits D. P., Sault R. J., 2000, ApJ, 540, 521
- Hynes et al. (2003) Hynes R. I., et al., 2003, MNRAS, 345, 292
- Hynes et al. (2009) Hynes R. I., Bradley C. K., Rupen M., Gallo E., Fender R. P., Casares J., Zurita C., 2009, MNRAS, 399, 2239
- Hynes et al. (2004) Hynes R. I., et al., 2004, ApJ, 611, L125
- Itoh et al. (2015) Itoh R., et al., 2015, ATel, 7709, 1
- Kafka (2016) Kafka, S., 2016, Observations from the AAVSO International Database, http://www.aavso.org
- Kalamkar et al. (2016) Kalamkar M., Casella P., Uttley P., O’Brien K., Russell D., Maccarone T., van der Klis M., Vincentelli F., 2016, MNRAS, in press (arXiv:1510.08907)
- Kimura et al. (2016) Kimura, M., et al., 2016, Natur, 529, 54
- Kitamoto et al. (1989) Kitamoto S., Tsunemi H., Miyamoto S., Yamashita K., Mizobuchi S., 1989, Natur, 342, 518
- Klein-Wolt et al. (2002) Klein-Wolt M., Fender R. P., Pooley G. G., Belloni T., Migliari S., Morgan E. H., van der Klis M., 2002, MNRAS, 331, 745
- Kong et al. (2002) Kong A. K. H., McClintock J. E., Garcia M. R., Murray S. S., Barret D., 2002, ApJ, 570, 277
- Krimm et al. (2013) Krimm H. A., et al., 2013, ApJS, 209, 14
- Kuulkers & Ferrigno (2016) Kuulkers E., amp, Ferrigno C., 2016, ATel, 8512,
- Kuulkers (2015) Kuulkers E., 2015, ATel, 7758,
- Kuulkers et al. (2015) Kuulkers E., Motta S., Kajava J., Homan J., Fender R., Jonker P., 2015, ATel, 7647, 1
- Landi Degl’Innocenti, Bagnulo, & Fossati (2007) Landi Degl’Innocenti E., Bagnulo S., Fossati L., 2007, ASPC, 364, 495
- Lipunov et al. (2016) Lipunov V. M., et al., 2016, arXiv, arXiv:1608.02764
- Makino et al. (1989) Makino F., Wagner R. M., Starrfield S., Buie M. W., Bond H. E., Johnson J., Harrison T., Gehrz R. D., 1989, IAUC, 4786, 1
- Martí, Luque-Escamilla, & García-Hernández (2016) Martí J., Luque-Escamilla P. L., García-Hernández M. T., 2016, A&A, 586, A58
- Michalsky, Swedlund, & Stokes (1975) Michalsky J. J., Swedlund J. B., Stokes R. A., 1975, ApJ, 198, L101
- Miller-Jones et al. (2009) Miller-Jones J. C. A., Jonker P. G., Dhawan V., Brisken W., Rupen M. P., Nelemans G., Gallo E., 2009, ApJ, 706, L230
- Mirabel et al. (1998) Mirabel I. F., Dhawan V., Chaty S., Rodriguez L. F., Marti J., Robinson C. R., Swank J., Geballe T., 1998, A&A, 330, L9
- Mooley et al. (2015) Mooley K., Fender R., Anderson G., Staley T., Kuulkers E., Rumsey C., 2015, ATel, 7658, 1
- Motta et al. (2015a) Motta S., Beardmore A., Oates S., Sanna N. P. M. K. A., Kuulkers E., Kajava J., Sanchez-Fernanedz C., 2015a, ATel, 7665, 1
- Motta et al. (2015b) Motta S., Beardmore A., Oates S., Sanna N. P. M. K. A., Kuulkers E., Kajava J., Sanchez-Fernanedz C., 2015b, ATel, 7666, 1
- Muñoz-Darias et al. (2016) Muñoz-Darias T., et al., 2016, Natur, 534, 75
- Natalucci et al. (2015) Natalucci L., Fiocchi M., Bazzano A., Ubertini P., Roques J.-P., Jourdain E., 2015, ApJ, 813, L21
- Naylor (1998) Naylor T., 1998, MNRAS, 296, 339
- Negoro et al. (2015) Negoro H., et al., 2015, ATel, 7646, 1
- Oliva (1997) Oliva E., 1997, A&AS, 123,
- Panopoulou, Reig, & Blinov (2015) Panopoulou G., Reig P., Blinov D., 2015, ATel, 7674, 1
- Rodriguez et al. (2015) Rodriguez J., et al., 2015, A&A, 581, L9
- Russell & Fender (2008) Russell D. M., Fender R. P., 2008, MNRAS, 387, 713
- Russell et al. (2013) Russell D. M., et al., 2013, MNRAS, 429, 815
- Russell & Shahbaz (2014) Russell D. M., Shahbaz T., 2014, MNRAS, 438, 2083
- Rybicki & Lightman (1979) Rybicki G. B., Lightman A. P. 1979, in Radiative Processes in Astrophysics, New York, Wiley
- Schultz (2000) Schultz J., 2000, A&A, 364, 587
- Serkowski (1974) Serkowski K., 1974, in Methods of Experimental Physics, Vol. 12A, ed. N. Carleton (New York: Academic), 361
- Serkowski, Mathewson, & Ford (1975) Serkowski K., Mathewson D. S., Ford V. L., 1975, ApJ, 196, 261
- Spruit (2014) Spruit H,, 2014, in González Martínez-País I., Shahbaz T., Casares Velázquez J., eds, XXI Canary Islands Winter School of Astrophysics, Accretion discs. Cambridge University Press, Cambridge, p. 1
- Shahbaz et al. (1996) Shahbaz T., Bandyopadhyay R., Charles P. A., Naylor T., 1996, MNRAS, 282, 977
- Shahbaz et al. (1994) Shahbaz T., Ringwald F. A., Bunn J. C., Naylor T., Charles P. A., Casares J., 1994, MNRAS, 271, L10
- Shahbaz et al. (2003) Shahbaz T., Dhillon V. S., Marsh T. R., Zurita C., Haswell C. A., Charles P. A., Hynes R. I., Casares J., 2003, MNRAS, 346, 1116
- Shahbaz et al. (2008) Shahbaz T., Fender R. P., Watson C. A., O’Brien K., 2008, ApJ, 672, 510
- Tanaka et al. (2016) Tanaka Y. T., et al., 2016, arXiv, arXiv:1601.01312
- Tetarenko et al. (2015) Tetarenko A., Sivakoff G. R., Young K., Wouterloot J. G. A., Miller-Jones J. C., 2015, ATel, 7708, 1
- Trushkin, Nizhelskij, & Tsybulev (2015) Trushkin S. A., Nizhelskij N. A., Tsybulev P. G., 2015, ATel, 7716, 1
- Tsubono et al. (2015) Tsubono K., Aoki T., Asuma K., Daishido T., Kida S., Nakajima H., Niinuma K., Takefuji K., 2015, ATel, 7701, 1
- Udalski & Kaluzny (1991) Udalski A., Kaluzny J., 1991, PASP, 103, 198
- van Paradijs & McClintock (1994) van Paradijs J., McClintock J. E., 1994, A&A, 290,
- Wagner et al. (1994) Wagner R. M., Starrfield S. G., Hjellming R. M., Howell S. B., Kreidl T. J., 1994, ApJ, 429, L25
- Wardle & Kronberg (1974) Wardle J. F. C., Kronberg P. P., 1974, ApJ, 194, 249
- Whittet et al. (1992) Whittet D. C. B., Martin P. G., Hough J. H., Rouse M. F., Bailey J. A., Axon D. J., 1992, ApJ, 386, 562