Fermi LAT Study of Gamma-Ray Emission in the Direction of the Monoceros Loop Supernova Remnant
Abstract
We present an analysis of the gamma-ray measurements by the Large Area Telescope onboard the Fermi Gamma-ray Space Telescope in the region of the supernova remnant (SNR) Monoceros Loop (G205.50.5). The brightest gamma-ray peak is spatially correlated with the Rosette Nebula, which is a molecular cloud complex adjacent to the southeast edge of the SNR. After subtraction of this emission by spatial modeling, the gamma-ray emission from the SNR emerges, which is extended and fit by a Gaussian spatial template. The gamma-ray spectra are significantly better reproduced by a curved shape than a simple power law. The luminosities between 0.2–300 GeV are erg s-1 for the SNR and erg s-1 for the Rosette Nebula, respectively. We argue that the gamma rays likely originate from the interactions of particles accelerated in the SNR. The decay of neutral pions produced in nucleon-nucleon interactions of accelerated hadrons with interstellar gas provides a reasonable explanation for the gamma-ray emission of both the Rosette Nebula and the Monoceros SNR.
1 Introduction
The shock waves of supernovae accelerate particles to very high energies through the mechanism of diffusive shock acceleration (e.g., Blandford & Eichler, 1987). However, the processes of acceleration, release from the shock region, and diffusion in the interstellar medium of such particles are not well understood. Gamma-ray observations in the GeV domain are a powerful probe of these mechanisms. The Large Area Telescope (LAT) on board the Fermi Gamma-ray Space Telescope has detected GeV gamma rays from several SNRs (e.g., Thompson et al., 2012; Acero et al., 2016b, and references therein).
The Monoceros Loop (G205.50.5) is a well-studied middle-aged SNR. It has a large diameter ( ) which allows detailed morphological studies in high-energy gamma rays since the LAT has a comparable point-spread function (PSF) above a few hundred MeV (the 68% containment angle above 1 GeV is smaller than 1∘). The radio emission of the SNR has a non-thermal spectrum (e.g. Xiao & Zhu, 2012), indicating the existence of high-energy electrons. A young stellar cluster and molecular cloud complex, the Rosette Nebula, is located at the edge of the southern shell of the SNR. The H line widths in the SNR ridge overlapping with the Rosette region are larger than near the center of the Rosette Nebula (Fountain et al., 1979), suggesting that the SNR is interacting with the Rosette Nebula. Turner (1976) obtained distances of for stars associated with the Rosette Nebula from main sequence fitting. Odegard (1986) argued that the distance of the SNR is based on his decameter wavelength observations of the absorption of nonthermal emission from the SNR by the Rosette Nebula. In this paper, we adopt this distance of 1.6 kpc for both objects. The age was estimated to be yr based on the X-ray data and an SNR model (Leahy et al., 1986).
In Monoceros, a very-high-energy (VHE) gamma-ray source, HESS J0632057, was first discovered at TeV energies by the High Energy Stereoscopic System (H.E.S.S.; Aharonian et al., 2007), located close to the rim of the Monoceros SNR. It appears to be point-like within experimental resolution; the limit on the size of the emission region was given as (95% confidence level). Detection of variability in the VHE gamma-ray and X-ray fluxes supports interpretation of the object as a gamma-ray emitting binary (Acciari et al., 2009), indicating that the bulk of VHE gamma rays do not come from high-energy particles accelerated by the SNR. No significant emission from the location of HESS J0632057 was detected in the 0.1-100 GeV energy range integrating over 3.5 yr of Fermi LAT data (Caliandro et al., 2013). Also, an unidentified high-energy gamma-ray source, 3EG J06340521 has been detected using the EGRET data (Hartman et al., 1999). However, morphological studies which could associate the gamma-ray emission with molecular clouds require higher photon statistics with better angular resolution.
Seven LAT point-like sources positionally associated with the Monoceros Loop SNR (2FGL J0631.60640, 2FGL J0633.70633, 2FGL J0636.00554, and 2FGL J0637.80737) and the Rosette Nebula (2FGL J0631.70428, 2FGL J0634.30356c, and 2FGL J0637.00416c) are listed in the 2FGL catalog (Nolan et al., 2012). However, the two sources (2FGL J0634.30356c and 2FGL J0637.00416c) associated with the Rosette Nebula were classified as ‘c’ sources that require caution in interpreting or analyzing. In addition, the extended emission around the SNR was reported in the first Fermi LAT SNR catalog (Acero et al., 2016b), which was modeled as a uniform disk with the radius of 23. In order to understand the emission and its mechanism more deeply, a detailed analysis and further discussion are required.
In this paper, we report a detailed study of the emission in the direction of the Monoceros Loop by using the Fermi LAT data. We have analyzed the 67-month LAT data by using the 2FGL catalog. Observations and data selection are briefly described in Section 2. The analysis procedure and results described in Section 3 include a study of the morphology and spectrum of the emission associated with the Monoceros Loop and the Rosette Nebula. Finally, we present our results in Section 4 and conclusions in Section 5. The data selection, analysis procedure, and the modeling of gamma-ray emission are based on the previous studies of the Cygnus Loop by Katagiri et al. (2011) and SNR HB 3 by Katagiri et al. (2016).
2 OBSERVATIONS AND DATA SELECTION
The main instrument on Fermi is the LAT which detects gamma rays from 20 MeV to 300 GeV111Only events with energies 0.2 GeV are used in this analysis.. The LAT is an electron-positron pair production telescope, using tungsten foil converters and silicon microstrip detectors and a hodoscopic cesium iodide calorimeter to measure the arrival directions and energies of incoming gamma rays. They are surrounded by 89 segmented plastic scintillators that serve as an anticoincidence detector to reject events originating from charged particles. Detailed information about the instrument can be found in Atwood et al. (2009), the on-orbit calibration is described in Abdo et al. (2009), and a summary of event classification strategies and instrument performance is given in Ackermann et al. (2012). The LAT has a larger field of view ( 2.4 sr), a larger effective area ( 8000 cm2 for 1 GeV on-axis peak effective area) and improved PSF in comparison to previous high-energy gamma-ray telescopes.
We analyzed events toward the Monoceros Loop recorded from the start of science operations on 2008 August 4 until 2014 January 29. The LAT operated in a nearly continuous sky survey mode, to obtain a total exposure of 1.5 1011 cm2 s (at 1 GeV). In this observing mode approximately uniform coverage of the entire sky is obtained every 2 orbits ( 3 hr).
We used the standard LAT analysis software, the ScienceTools version v9r32, publicly available from the Fermi Science Support Center (FSSC)222Software and documentation of the Fermi ScienceTools are distributed by the Fermi Science Support Center at http://fermi.gsfc.nasa.gov/ssc.. We use events classified as P7SOURCE that have been reprocessed with an updated instrument calibration (Bregeon et al., 2013). Only events that have a reconstructed zenith angle less than 100∘ were used in order to minimize the contamination from Earth-limb gamma-ray emission. Furthermore, only time intervals when the center of the LAT field of view is within 52∘ of the local zenith are accepted to further reduce the contamination by Earth’s atmospheric emission. The Instrument response functions (IRFs) that correspond to this dataset are P7REP_SOURCE_V15 (publicly available via the FSSC) throughout this work.
Times when the LAT detected a gamma-ray burst (GRB) or nova were eliminated from the dataset. The transients located within 15∘ of the Monoceros Loop were GRB 130504C (Kocevski et al., 2013) and Nova Mon 2012 (Cheung et al., 2013), corresponding to 56416.97797–56417.00390 and 56099.00000–56109.00000 in Modified Julian Day, respectively.
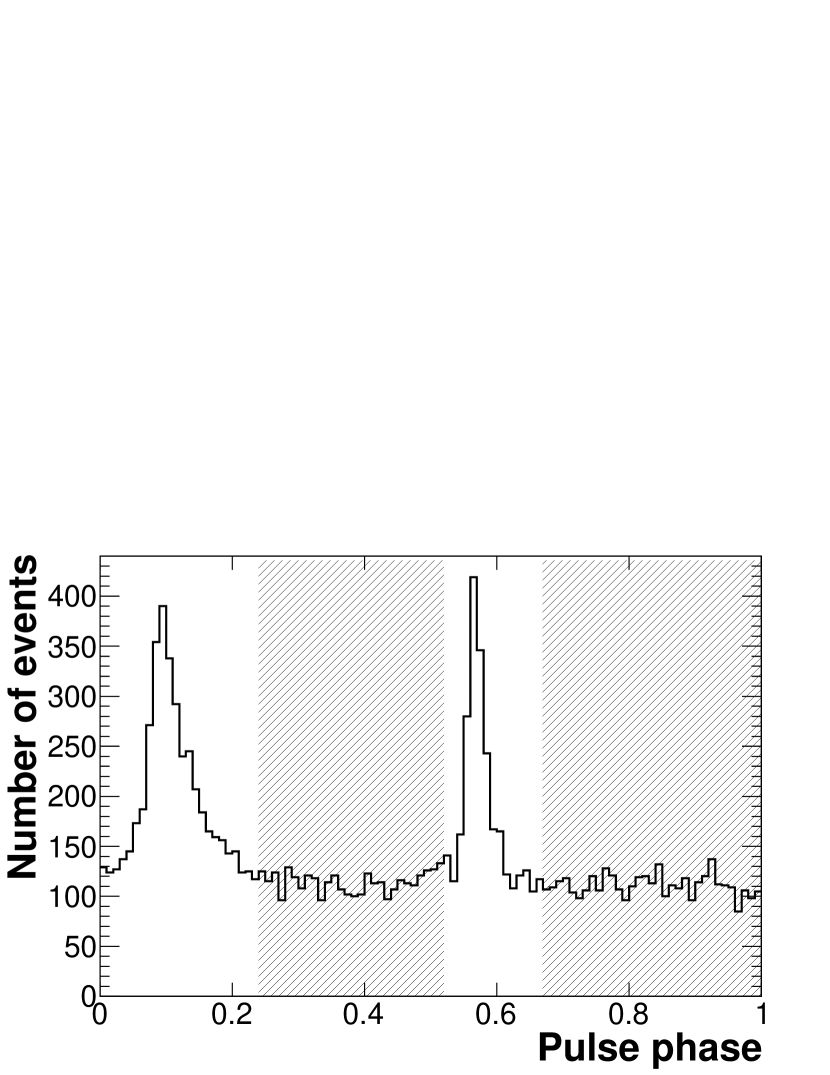
The region around the SNR is dominated by the gamma-ray emission of PSR J06330632 (2FGL J0633.70633). The pulse profile in the 0.2–300 GeV energy range analyzed in this paper is shown in Figure 1, where the events are within 1∘ of the pulsar position. Using a timing solution modeling the effects of spin-down and timing noise (Kerr et al., 2015), we assigned rotational phase to each photon using the Fermi plug-in of the TEMPO2 software package (Hobbs et al., 2006). We only used the events during the off-pulse phases of PSR J06330632, corresponding to phases of 0.24–0.52 and 0.67–1.00 as adopted in Abdo et al. (2013). We restricted the energy range to GeV to avoid possible large systematics due to the rapidly varying effective area and much broader PSF at lower energies.
3 ANALYSIS AND RESULTS
3.1 General settings
The morphology and spectrum of gamma-ray emission from the Monoceros Loop and Rosette Nebula were determined using a binned likelihood analysis based on Poisson statistics333As implemented in the publicly available Fermi Science Tools. The documentation concerning the analysis tools and the likelihood fitting procedure is available from http://fermi.gsfc.nasa.gov/ssc/data/analysis/documentation/Cicerone/. (see, e.g., Mattox et al., 1996). The likelihood is the product of the probabilities of the observed gamma-ray counts within each spatial and spectral bin for a specified model. The gamma-ray emission model used here included all sources detected in the 2FGL catalog within 20∘ of the SNR. We also included the standard LAT diffuse background model (Acero et al., 2016a), gll_iem_v05_rev1.fit that results from cosmic-ray (CR) interactions with the interstellar medium and radiation fields and an isotropic component to represent extragalactic gamma rays and charged particle background using a tabulated spectrum (iso_source_v05.txt). Both diffuse models are available from the FSSC. We fit all spectral parameters of the 2FGL sources spatially associated with the SNR (3 sources within the SNR (Group S), 3 sources within the Rosette Nebula (Group R) and PSR J06330632), the Galactic diffuse emission and the isotropic component, while the integral fluxes of the other point sources are left as free parameters and the spectral indices are fixed to the values reported in 2FGL.
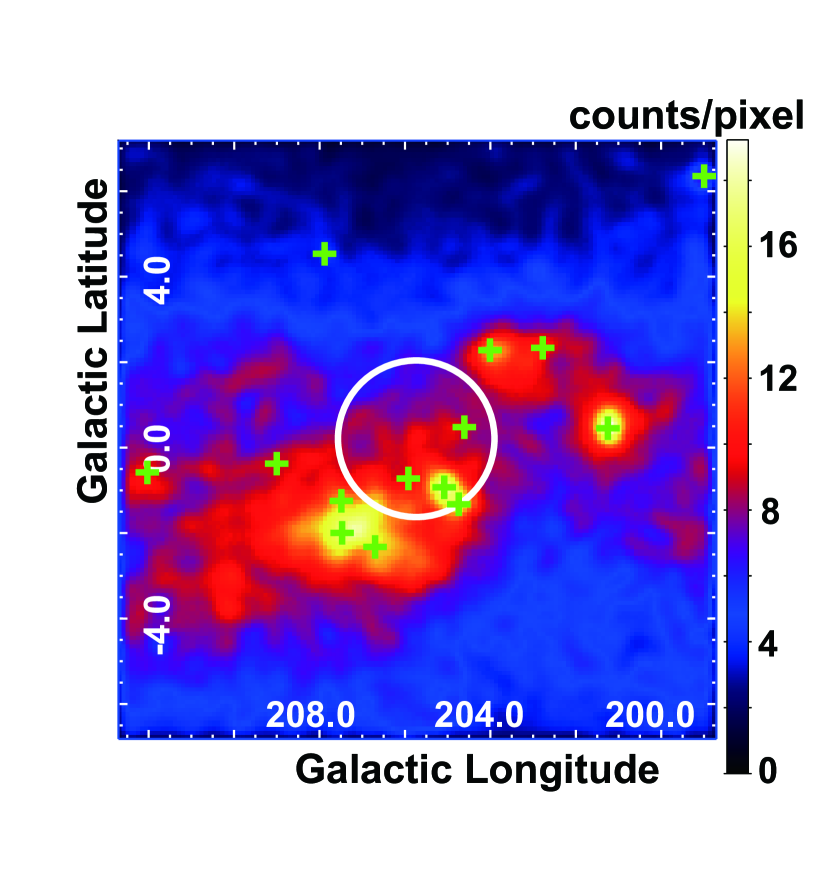
The analyses were performed within a 1414∘ square region using pixels. The energy range for likelihood analysis is divided into 40 logarithmically-spaced energy bins from 0.2 GeV to 300 GeV. Figure 2 shows the counts map in the region of interest. We centered the region on the center of the SNR: (R.A., Dec.) (9975,650) (J2000).
3.2 Morphological analysis
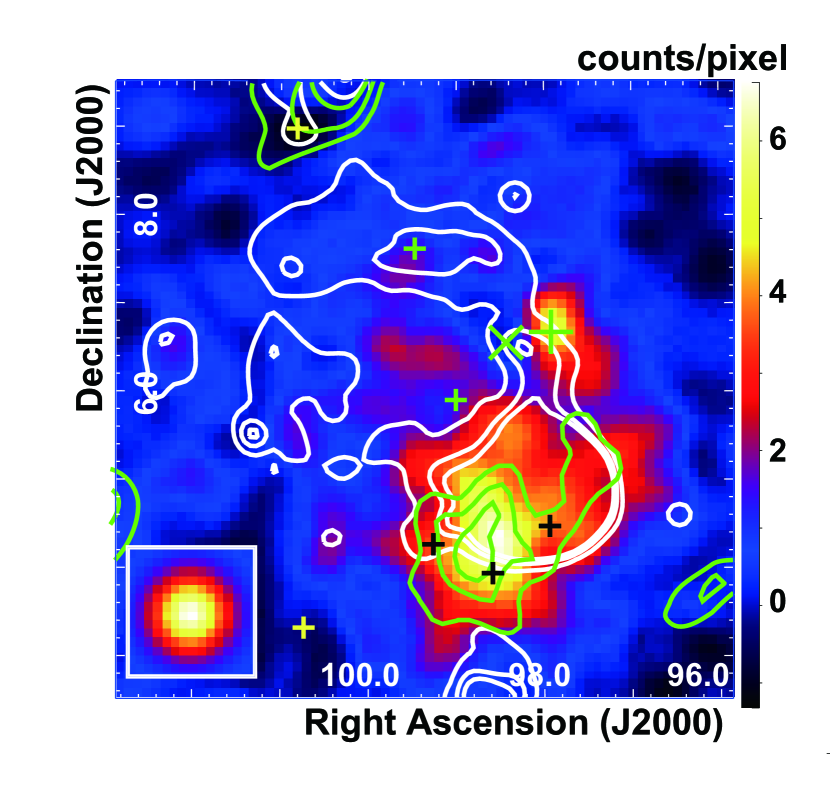
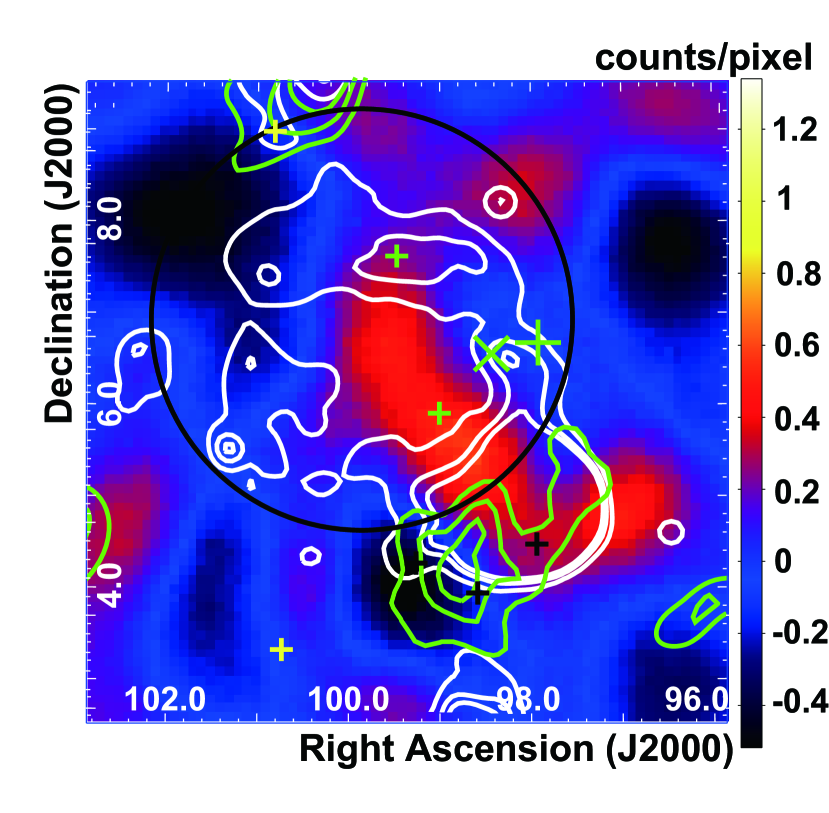
For our morphological study we only used events with energies greater than 0.5 GeV (compared to the 0.2 GeV used in our spectral analysis) to take advantage of the narrower PSF at higher energies. Figure 3 shows the counts map in a 7 7∘ region centered on the Monoceros Loop, after subtracting the background: the Galactic emission, the isotropic component, and the 2FGL point sources except for the six 2FGL sources in Group S and R, the parameters of which were the best-fit ones obtained by the likelihood analysis where the emission associated with the SNR and the Rosette Nebula are modeled as the six sources (Model 1 in Table 1). The CO contours overlaid on the map correspond to line intensity integrated over velocities of km s-1 km s-1 with respect to the local standard of rest, encompassing the velocity of 14 km s-1 corresponding to the distance from the Earth (1.6 kpc assuming the IAU-recommended values kpc and km s-1). The correlation between gamma rays and the CO line emission around the Rosette Nebula is evident. We note that the LAT standard diffuse model includes this CO emission (Acero et al., 2016a). Thus the residual excess of the gamma-ray emission indicates that the CR density in this region is enhanced relative to the surrounding region. The emission north of the CO region appears point-like and is consistent with the position of the source 2FGL J0631.60640.
To evaluate the correlation between the gamma-ray and CO line emission quantitatively, we fit LAT emission with a spatial template based on the CO line emission for the Rosette Nebula instead of the three 2FGL sources in Group R. We restricted the spatial template to a 213 radius about the central cloud (R.A., Dec.) (9841,481) (J2000). Since the edge of the CO emission region is unclear due to statistical noise in the CO spectral measurements, we introduced the CO intensity threshold used to create the spatial template as an additional free parameter in the fit. The spectral model was assumed to be a power-law function. The resulting maximum likelihood values with respect to the maximum likelihood for the null hypothesis (no source component associated with the Rosette Nebula and the SNR other than PSR J06330632) are summarized in Table 1. The test statistic (TS) value (e.g. Mattox et al., 1996) for the CO image (Model 2 in Table 1) is significantly larger than for all 3 individual point sources of Group R (Model 1). The threshold value of the CO intensity to maximize the likelihood value is 0 Kkm s-1 where the parameter varies from 0 Kkm s-1 to 4 Kkm s-1.
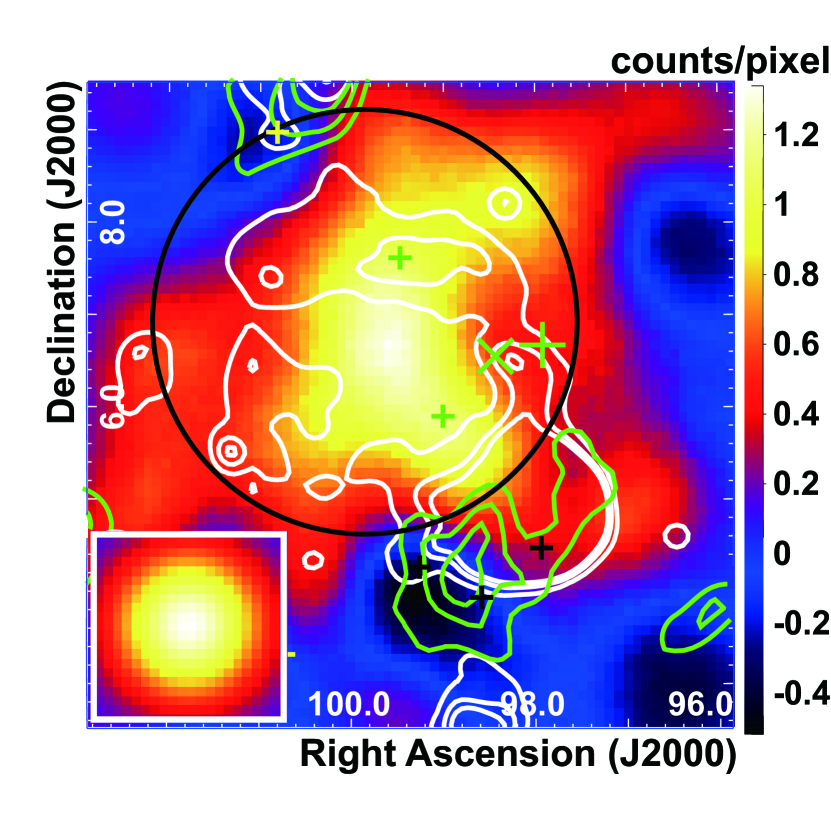
We further characterized the morphology of gamma-ray emission associated with the Monoceros Loop. Figure 4 shows the counts map in a 7 7∘ region centered on the SNR, after subtracting the background and the emission from the Rosette Nebula. The background here consists of the Galactic emission, the isotropic component, the CO spatial template, 2FGL J0631.60640 in Group S, and the 2FGL point sources except for the other two sources in Group S (2FGL J0636.00554 and 2FGL J0637.80737), the parameters of which were the best-fit ones obtained by the likelihood analysis with the CO template plus all 3 point sources of Group S (Model 2 in Table 1). A spatially extended emission region within the SNR becomes apparent.
To quantitatively evaluate the detection significance of the spatially extended emission, we tested the hypothesis of an extended emission region inside the Monoceros Loop against the model with the two individual point sources in Group S (2FGL J0636.00554 and 2FGL J0637.80737). We fitted the LAT counts by replacing all 3 point sources of Group S by one point source (2FGL J0631.60640 in Group S) and a spatially extended component modeled as either a uniform disk or a Gaussian emission profile (Model 3 and 4 in Table 1). The spectral shapes for both additional sources were assumed to be power-law functions. We varied the radius (1 for a Gaussian profile) and location of the extended components and evaluated the maximum likelihood values. The resulting maximum likelihood values with respect to the maximum likelihood for the null hypothesis are summarized in Table 1. The TS values for the uniform disk or the Gaussian profile plus the point source and the CO template (Model 3 and 4) are much larger than for the three 2FGL sources plus the CO template (Model 2) albeit having fewer degrees of freedom. The Gaussian profile (Model 4) provides a greater likelihood than the uniform disk (Model 3): the TS value increases by 26.7. The maximum likelihood Gaussian profile has a radius () of centered on (R.A., Dec.) (9986,693) (J2000). The error of the centroid is 035 at 68% confidence level. The detection significances for the best-fit Gaussian profile and 2FGL J0631.60640 at energies of 0.5 GeV are 14 and 11 , respectively. We note that if we add the five eliminated 2FGL sources on top of the best-fit model, the TS value increases by only 6.2 for 10 additional degrees of freedom, i.e. there is no statistical evidence for the presence of these sources in addition to the extended templates. Also, we note that the maximum likelihood value for a 408 MHz radio template with suppression of emission from Rosette Nebula (Model 5) was significantly worse than the best-fit Gaussian model, indicating that the gamma-ray emission around the Monoceros Loop is not strongly spatially associated with the shock region of the SNR as traced by radio. Finally, we examined the residual map after fitting as shown in Figure 5. There is no prominent gamma-ray emission left in the map. Therefore we adopted the Gaussian template with maximum likelihood parameters for the whole SNR in the following spectral analysis.
3.3 Spectral analysis
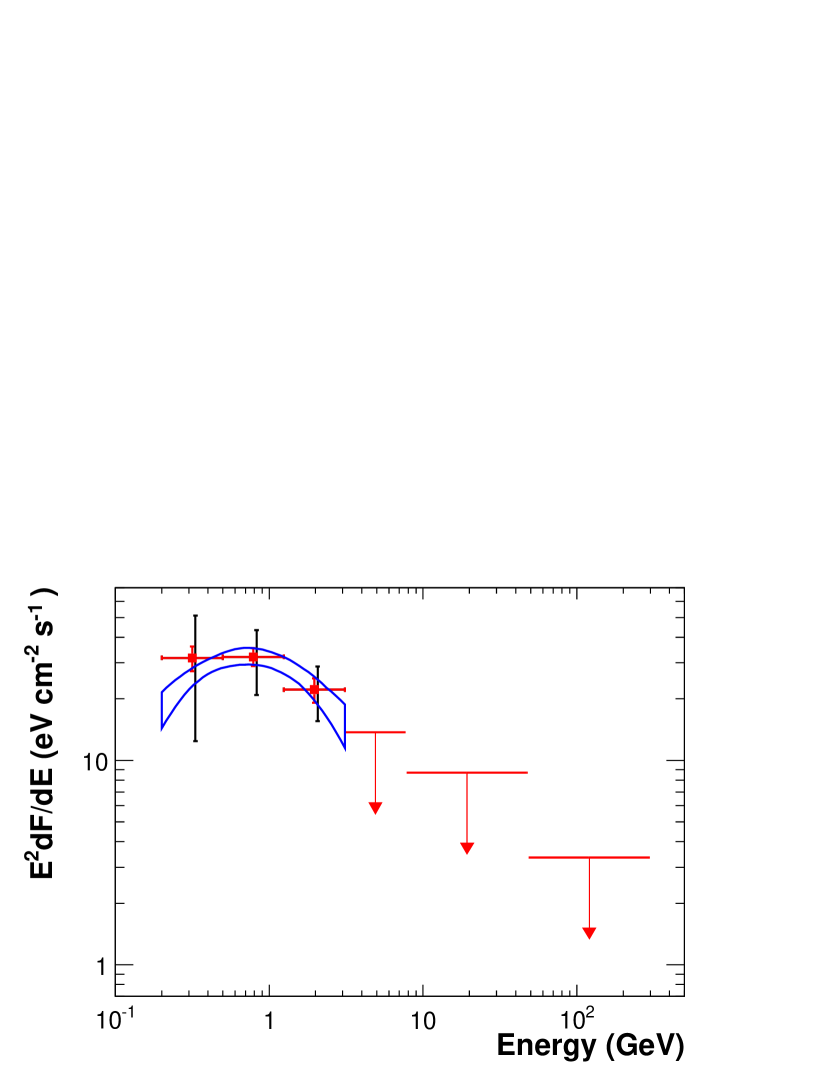
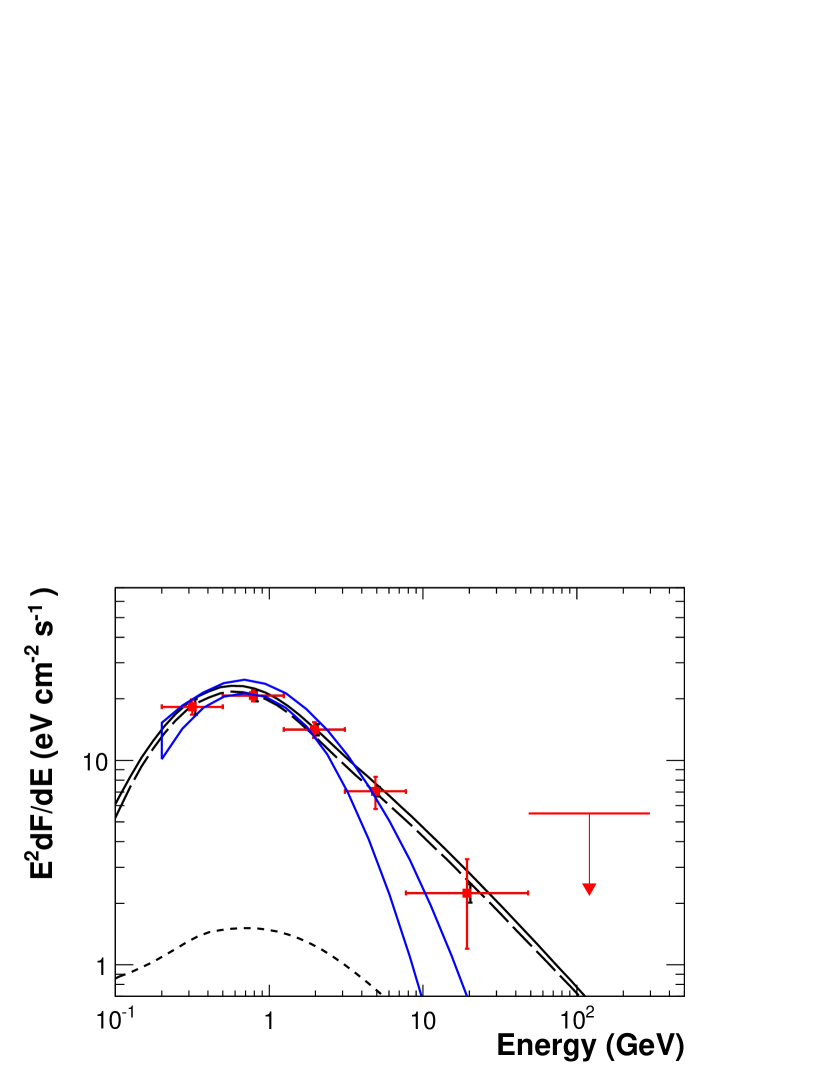
To measure the spectra of the SNR and the Rosette Nebula we used a maximum likelihood fit using the best-fit spatial model over the energy range from 0.2 GeV to 300 GeV. Figures 6 and 7 show the resulting spectral energy distributions (SEDs) for the SNR and the Rosette Nebula, respectively. If the detection is not significant in an energy bin, i.e., the improvement of the TS value with respect to the null hypothesis is less than 4 (corresponding to 2 for one additional degree of freedom) then we calculated a 90% confidence level upper limit assuming a photon index of 2.
At least three different sources of systematic uncertainties affect our analysis: uncertainties in the LAT event selection efficiency, the adopted diffuse model and the morphological templates. Uncertainties in the LAT effective area were evaluated by comparing the efficiencies of analysis cuts for data and simulation of observations of Vela and the limb of the Earth, among other consistency checks (Ackermann et al., 2012). For P7REP_SOURCE_V15, these studies suggest a 10% systematic uncertainty below 100 MeV, decreasing linearly with the logarithm of energy to 5% in the range between 316 MeV and 10 GeV and increasing linearly with the logarithm of energy up to 15% at 1 TeV. We adopted the strategy described in Ackermann et al. (2013) and Acero et al. (2016b) to evaluate the systematic uncertainties due to the modeling of interstellar emission. Results obtained using the standard model in Section 3.2 were compared with the results of eight alternative interstellar emission models. These models were created by varying the uniform spin temperature used to estimate the column densities of interstellar atomic hydrogen, the vertical height of the CR propagation halo, and the CR source distribution in the Galaxy.
We similarly gauged the uncertainties due to the morphological template by comparing the results with those obtained by changing the radius of the Gaussian template within its 1 error. The total systematic errors were set by adding the above uncertainties in quadrature. If the total systematic error in an energy bin was 100%, the point was replaced by an upper limit. This is relevant for the fourth energy bin (3.105 GeV – 7.746 GeV) in Figure 6 where an upper limit is presented due to the large systematic error although the TS value is 9. The dominant systematic error for the measurement of the SNR spectrum arises from the uncertainty of the diffuse model below 0.5 GeV and the morphological uncertainty above 0.5 GeV, respectively.
We searched for a spectral break in the LAT energy range by comparing the likelihood values of a spectral fit over the whole energy range considered based on a simple power law and a log parabola function. TS values and best-fit parameters are summarized in Table 2. The values for a log parabola function correspond to improvements at the confidence level for the SNR and for the Rosette Nebula when only statistical uncertainties are taken into account. For the SNR, we further investigated the systematic effects on the above spectral analysis. Accounting for systematics in the fit, the curved shape is still preferred over a power-law at a confidence level 5 . By comparing the spectral parameters of a log parabola function for both sources, the spectral shapes are consistent within the statistical errors at our current sensitivity. Assuming the spectral shape is a log parabola function, the gamma-ray luminosities integrated over the energy range 0.2–300 GeV inferred from our analysis are erg s-1 for the SNR and erg s-1 for the Rosette Nebula, respectively.
4 DISCUSSION
An extended region of gamma-ray emission was found to be spatially coincident with the Monoceros SNR by Acero et al. (2016b). We confirmed the extended emission with this more detailed analysis. Since no pulsar wind nebula has been discovered so far within the SNR (e.g., Roberts, 2004), the likely explanation for the bulk of this gamma-ray emission is the interaction of high-energy particles accelerated in the shocks of the Monoceros Loop with ambient interstellar matter and radiation fields. The morphological difference between the gamma-ray emission and the radio emission can be explained by the inhomogeneity of the nearby gas, which is irradiated by the accelerated CRs that have escaped from the shocked regions. This hypothesis would also readily explain the enhanced emission from the nearby Rosette Nebula where the same population of high-energy particles would produce a bright gamma-ray signal when interacting in the dense molecular clouds traced by the CO emission. We note that the possibility of a pulsar wind nebula without detectable radio emission cannot be ruled out for the explanation of the enhanced emission around the SNR. Also, we cannot rule out that some of the emission around the SNR is produced by dark gas, i.e. gas that is not accounted for in HI or CO surveys. Its distribution cannot be modeled precisely, yet large quantities of dark gas have been found surrounding nearby molecular clouds (Grenier et al., 2005). In contrast, it is difficult to explain the enhanced emission around the Rosette Nebula only by dark gas considering a good fit of the CO template and the feature of dark gas that is mostly at the outskirt of the cloud.
Broadband emission from the Monoceros Loop SNR was modeled under the assumption that gamma rays are emitted by a population of accelerated protons and electrons. We assumed relativistic electrons and protons have the same injection spectrum and occupy the same spatial volume characterized by a constant magnetic field strength and matter density. We used the following equation to model the momentum distribution of injected particles:
| (1) |
where is the break momentum, is the spectral index below the break and above the break. are normalizations for the electron and proton components, respectively. Because the details of the proton/electron injection process are poorly known, we adopt a minimum momentum of 100 MeV .
Electrons suffer energy losses due to ionization, Coulomb scattering, bremsstrahlung, synchrotron emission and inverse Compton (IC) scattering. The evolution of the momenta spectra are calculated from the following equation:
| (2) |
where is the momentum loss rate, and is the particle injection rate. We assumed that the shock produced particles at a constant rate, so is constant. To derive the gamma-ray emission spectrum we calculated numerically, where is the SNR age of yr. Momentum losses for protons are neglected because the timescale for radiative losses via neutral pion production is 10 yr where is the gas density averaged over the volume occupied by high-energy particles. Gamma-ray emission by secondary leptons produced from charged pion decay was neglected. Generally, this is a negligible contribution unless the gas density is comparable to that in dense molecular clouds and the SNR has reached the later stages of its evolution, or the injected electron-to-proton ratio is much lower than locally observed. The calculation of the spectrum of decay gamma rays from interactions between protons and ambient hydrogen was adopted from Dermer (1986). A scaling factor of 1.84 accounted for helium and heavier nuclei in target material and CRs (Mori, 2009). Contributions from bremsstrahlung and IC scattering by accelerated electrons are computed based on Blumenthal & Gould (1970), and synchrotron radiation is evaluated using the work of Crusius & Schlickeiser (1986).
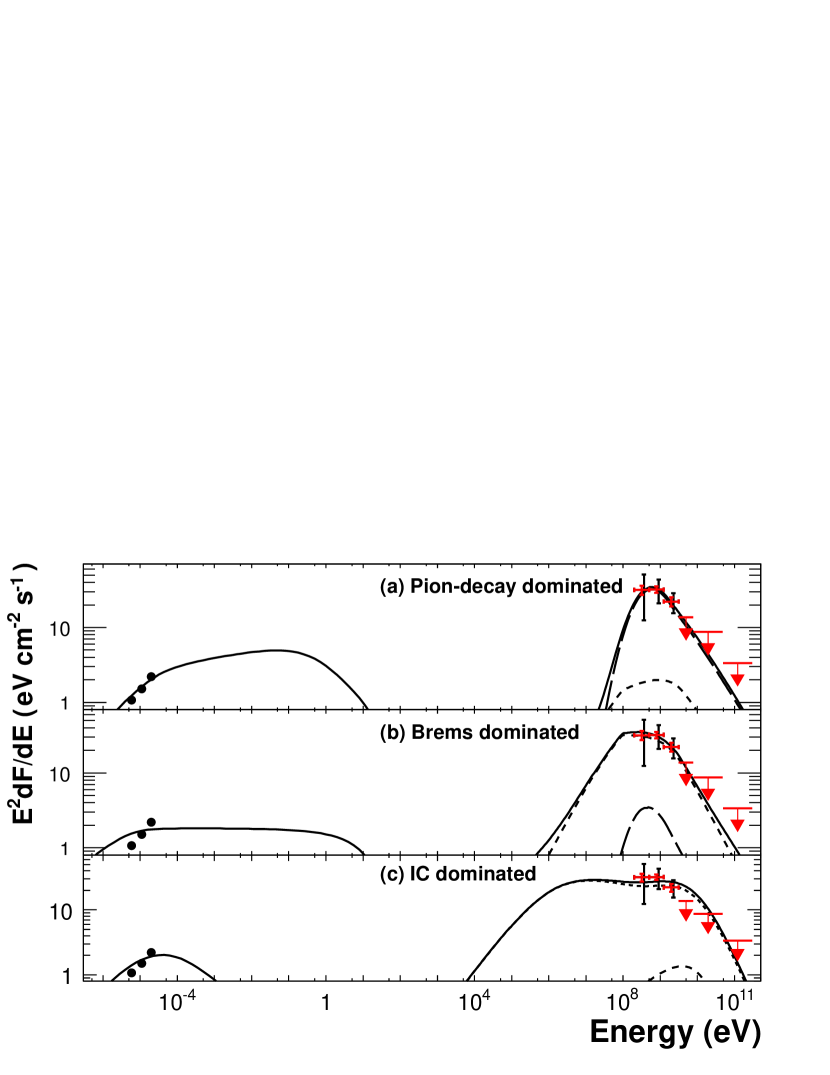
First, we considered a model with the Monoceros Loop SNR dominated by -decay. The gamma-ray spectrum constrains the number index of accelerated protons to be in the high-energy regime. We adopted a spectral index to explain the radio continuum spectrum (Xiao & Zhu, 2012). We note that the radio spectrum was estimated from the full SNR with the exception of the Rosette Nebula region that is dominated by strong thermal emission. Since we expect curvature in the GeV energy band due to the kinematics of production and decay, it is difficult to constrain a break in the proton momenta spectrum from the gamma-ray spectrum. The gamma-ray spectrum thus provides only an upper bound to the momentum break at 10 GeV . We adopt a break at the best-fit value, 2 GeV . The density is fixed to based on the H observations (Xiao & Zhu, 2012). The resulting total proton energy, erg, is less than 10% of the typical kinetic energy of a supernova explosion. For the electron-to-proton ratio measured at Earth, , the magnetic field strength is determined to be G by the radio data. Using these model parameters (Table 3), we obtained the SEDs shown in Figure 8 (a).
In the case of leptonic scenarios, we assume to produce the gamma-ray emission predominantly from the electrons. The radio spectrum (Xiao & Zhu, 2012) is difficult to be modeled as the synchrotron radiation when we fit the gamma-ray spectrum with a model dominated by electron bremsstrahlung, as shown in Figure 8 (b).
The other leptonic scenario is an IC-dominated model. IC gamma rays originate from the interaction of high-energy electrons with the cosmic microwave background (CMB) as well as optical and infrared radiation fields. Galactic radiation fields were adopted from Porter et al. (2008) at the location of the Monoceros Loop. These very complex spectra are approximated by two infrared and two optical blackbody components. It is hard to reproduce the multi-wavelength spectrum well with an IC-dominated model shown in Figure 8 (c). In addition, the ratio between IC and synchrotron fluxes constrained the magnetic field to be less than 2 G and requires a low gas density of to suppress the electron bremsstrahlung, which is unlikely.
In conclusion, the bulk of the gamma-ray emission from the Monoceros SNR is most likely from decay produced by the interactions of protons with ambient hydrogen. It is then reasonable to explain the gamma-ray spectrum of the Rosette Nebula by the same process. If the protons are accelerated in the whole SNR in the same manner and are not strongly affected by spectral deformation due to CR diffusion processes, the shape of the proton spectrum in the Rosette Nebula is expected to be the same as in the Monoceros Loop. Figure 7 shows the gamma-ray spectrum of the Rosette Nebula with the -decay dominated model assuming the density in the molecular clouds is . The spectrum can be reproduced without any change from the proton momentum spectrum of the SNR. The resulting total proton energy, erg, is about 2% of that for the -decay model of the SNR, which is reasonable considering the solid angle of the Rosette Nebula with respect to the SNR and uncertainty of the matter density. We note that these CR energies for the Monoceros Loop SNR and the Rosette Nebula are the enhancements of the CR density in addition to that implicit in the standard Galactic diffuse emission model.
To summarize, the assumption that the gamma-ray emission from the Monoceros SNR is dominated by decay of produced in nucleon-nucleon interactions of hadronic CRs with interstellar matter is a natural scenario that can also readily explain the emission from the nearby Rosette Nebula as interactions of the same population of CRs in the dense molecular cloud. Similarly to SNR HB 3 (Katagiri et al., 2016), it should be emphasized that our observations towards the Monoceros Loop provide a rare and valuable example for which the emissions from both the SNR and the interacting molecular clouds are detected.
5 CONCLUSIONS
We analyzed gamma-ray measurements by the LAT in the region of the Monoceros Loop. The brightest gamma-ray peak is spatially correlated with the Rosette Nebula. A template derived from the CO gas distribution fits the morphology of the gamma-ray emission better than a set of individual point sources. Gamma-ray emission from an extended source was also found inside the Monoceros Loop. A Gaussian emission profile of radius (1 ) is a substantially better match to the gamma-ray data when compared to the 2FGL sources J0636.00554 and J0637.80737. The gamma-ray spectra of both extended components were significantly better reproduced by a curved shape than a simple power law.
Their respective luminosities integrated over the energy range 0.2–300 GeV are erg s-1 for the SNR and erg s-1 for the Rosette Nebula. The decay of produced by interactions of hadrons accelerated by the remnant with interstellar gas can naturally explain the gamma-ray emission of the remnant and that of the nebula.
References
- Abdo et al. (2009) Abdo, A. A., Ackermann, M., Ajello, M., et al. (The Fermi LAT Collaboration) 2009, ApJ, 706, L1
- Abdo et al. (2009) Abdo, A. A., Ackermann, M., Ajello, M., et al. (The Fermi LAT Collaboration) 2009, Astroparticle Physics, 32, 193
- Abdo et al. (2010a) Abdo, A. A., Ackermann, M., Ajello, M., et al. (The Fermi LAT Collaboration) 2010, Science, 327, 1103
- Abdo et al. (2010b) Abdo, A. A., Ackermann, M., Ajello, M., et al. (The Fermi LAT Collaboration) 2010, ApJ, 712, 459
- Abdo et al. (2010e) Abdo, A. A., Ackermann, M., Ajello, M., et al. (The Fermi LAT Collaboration) 2010, ApJ, 718, 348
- Abdo et al. (2013) Abdo, A. A., Ajello, M., Allafort, A., et al. (The Fermi LAT Collaboration) 2013, ApJS, 208, 17
- Acciari et al. (2009) Acciari, V. A., Aliu, E., Arlen, T., et al. 2009, ApJ, 698, L94
- Acero et al. (2016a) Acero, F., Ackermann, M., Ajello, M., et al. (The Fermi LAT Collaboration) 2016, ApJS, 223, 26
- Acero et al. (2016b) Acero, F., Ackermann, M., Ajello, M., et al. (The Fermi LAT Collaboration) 2016, ApJS, 224, 8
- Ackermann et al. (2012) Ackermann, M., Ajello, M., Albert, A., et al. (The Fermi LAT Collaboration) 2012, ApJS, 203, 4
- Ackermann et al. (2013) Ackermann, M., Ajello, M., Allafort, A., et al. (The Fermi LAT Collaboration) 2013, Science, 339, 807
- Aharonian et al. (2007) Aharonian, F. A., Akhperjanian, A. G., Bazer-Bachi, A. R., et al. 2007, A&A, 469, L1
- Atwood et al. (2009) Atwood, W. B., Abdo, A. A., Ackermann, M., et al. (The Fermi LAT Collaboration) 2009, ApJ, 697, 1071
- Blandford & Eichler (1987) Blandford, R. D. & Eichler, D. 1987, Phys. Rep., 154, 1
- Blumenthal & Gould (1970) Blumenthal, G. R., & Gould, R. J. 1970, Reviews of Modern Physics, 42, 237
- Bregeon et al. (2013) Bregeon, J., Charles, E., & M. Wood for the Fermi LAT collaboration 2013, arXiv:1304.5456
- Caliandro et al. (2013) Caliandro, G. A., Hill, A. B., Torres, D. F., et al. 2013, MNRAS, 436, 740
- Cheung et al. (2013) Cheung, C. C., on behalf of the Fermi LAT collaboration 2013, arXiv:1304.3475
- Crusius & Schlickeiser (1986) Crusius, A., & Schlickeiser, R. 1986, A&A, 164, L16
- Dame et al. (2001) Dame, T. M., Hartmann, D., & Thaddeus, P. 2001, ApJ, 547, 792
- Dermer (1986) Dermer, C. D. 1986, A&A, 157, 223
- Fountain et al. (1979) Fountain, W. F., Gary, G. A., & Odell, C. R. 1979, ApJ, 229, 971
- Grenier et al. (2005) Grenier, I. A., Casandjian, J.-M., & Terrier, R. 2005, Science, 307, 1292
- Hartman et al. (1999) Hartman, R. C., Bertsch, D. L., Bloom, S. D., et al. 1999, ApJS, 123, 79
- Hobbs et al. (2006) Hobbs, G. B., Edwards, R. T., & Manchester, R. N. 2006, MNRAS, 369, 655
- Katagiri et al. (2011) Katagiri, H., Tibaldo, L., Ballet, J., et al. 2011, ApJ, 741, 44
- Katagiri et al. (2016) Katagiri, H., Yoshida, K., Ballet, J., et al. 2016, ApJ, 818, 114
- Kerr et al. (2015) Kerr, M., Ray, P. S., Johnston, S., Shannon, R. M., & Camilo, F. 2015, ApJ, 814, 128
- Kocevski et al. (2013) Kocevski, D., Ohno, M., Racusin, J., et al. 2013, GRB Coordinates Network, 14574, 1
- Kuchar & Bania (1993) Kuchar, T. A., & Bania, T. M. 1993, ApJ, 414, 664
- Leahy et al. (1986) Leahy, D. A., Naranan, S., & Singh, K. P. 1986, MNRAS, 220, 501
- Mattox et al. (1996) Mattox, J. R., Bertsch, D. L., Chiang, J., et al. , 1996, ApJ, 461, 396
- Mori (2009) Mori, M., 2009, Astropart. Phys., 31, 341
- Nolan et al. (2012) Nolan, P. L., Abdo, A. A., Ackermann, M., et al. (The Fermi LAT Collaboration) 2012, ApJS, 199, 31
- Odegard (1986) Odegard, N. 1986, ApJ, 301, 813
- Porter et al. (2008) Porter, T. A., Moskalenko, I. V., Strong, A. W., Orlando, E., & Bouchet, L. 2008, ApJ, 682, 400
- Protassov et al. (2002) Protassov, R., van Dyk, D. A., Connors, A., Kashyap, V. L., & Siemiginowska, A. 2002, ApJ, 571, 545
- Reich et al. (1997) Reich, P., Reich, W., & Furst, E. 1997, A&AS, 126, 413
- Roberts (2004) Roberts, M.S.E., 2004, ‘The Pulsar Wind Nebula Catalog (March 2005 version)’, McGill University, Montreal, Quebec, Canada (available on the World-Wide-Web at http://www.physics.mcgill.ca/~pulsar/pwncat.html).
- Taylor et al. (2003) Taylor, A. R., Gibson, S. J., Peracaula, M., et al. 2003, AJ, 125, 3145
- Thompson et al. (2012) Thompson, D. J., Baldini, L., & Uchiyama, Y. 2012, Astroparticle Physics, 39, 22
- Turner (1976) Turner, D. G. 1976, ApJ, 210, 65
- Xiao & Zhu (2012) Xiao, L., & Zhu, M. 2012, A&A, 545, A86
| Model | Test Statisticaa, where and are the maximum likelihoods for the model with/without the source component, respectively. The model for includes PSR J06330632. | Additional Degrees of |
|---|---|---|
| Freedom | ||
| 1: 3 point sources of Group R 3 point sources of Group Sbb The 3 sources in the 2FGL source list associated with the Rosette Nebula (Nolan et al., 2012) are referred to as Group R in the text. The 3 sources listed in the 2FGL source list associated with the Monoceros Loop are referred to as Group S in the text. 2FGL J0633.70633 (PSR J06330632) is not included in them. | 424.1 | 12 |
| 2: CO image + 3 point sources of Group S | 728.8 | 9ccThe additional degrees of freedom for the CO image is 2 for the spectral shape, 1 for the analysis threshold to extract emission. The details are shown in the text. |
| 3: CO image + Uniform disk 2FGL J0631.60640dd2FGL J0631.60640 is included in Group S. | 937.6 | 10 |
| 4: CO image + Gaussian 2FGL J0631.60640 | 964.3 | 10 |
| 5: CO image + Radio templateeeThe radio template was obtained from 408 MHz radio data (Taylor et al., 2003) by excluding the region around the Rosette Nebula, where the emission is predominantly thermal. The additional degrees of freedom for the radio template are 2 for the spectral shape (a power law). 2FGL J0631.60640 | 922.2 | 7 |
| Spectral Model | Test Statisticaa, where and are the maximum likelihood values for the model under consideration and the power-law model, respectively. | Additional Degrees of | Spectral Parameters |
|---|---|---|---|
| Freedom | |||
| Monoceros Loop | |||
| Power Law | 0 | 2 | ; |
| Log Parabola | 51 | 3 | |
| Rosette Nebula | |||
| Power Law | 0 | 2 | ; |
| Log Parabola | 88 | 3 | |
| Model | aaThe ratio electrons-to-protons at 1 GeV . | bb The momentum distribution of particles is assumed to be a smoothly broken power-law, where the indices and the break momentum are identical for both accelerated protons and electrons. is the spectral index in momentum below the break. | cc is the break momentum. | ddSpectral index in momentum above the break. | eeAverage hydrogen number density of ambient medium. | ffThe distance from the Earth is assumed to be 1.6 (Turner, 1976; Odegard, 1986). The total energy is calculated for particles 100 MeV . | ffThe distance from the Earth is assumed to be 1.6 (Turner, 1976; Odegard, 1986). The total energy is calculated for particles 100 MeV . | |
|---|---|---|---|---|---|---|---|---|
| (GeV ) | (G) | (cm-3) | ( erg) | ( erg) | ||||
| (a) Pion | 0.01 | 1.5 | 2.0 | 2.8 | 35 | 3.6 | 7.6 | 0.087 |
| (b) Bremsstrahlung | 1 | 1.5 | 1.0 | 3.0 | 9 | 3.6 | 0.98 | 1.4 |
| (c) Inverse ComptonggSeed photons for inverse Compton scattering of electrons include the CMB, two infrared ( K, eV cm-3, respectively), and two optical components ( K, eV cm-3, respectively) in the vicinity of the Monoceros Loop. | 1 | 1.5 | 20 | 4.0 | 1.1 | 0.01 | 12 | 16 |