Search for EeV Protons of Galactic Origin
Abstract
Cosmic rays in the energy range - eV are thought to have a light, probably protonic, composition. To study their origin one can search for anisotropy in their arrival directions. Extragalactic cosmic rays should be isotropic, but galactic cosmic rays of this type should be seen mostly along the galactic plane, and there should be a shortage of events coming from directions near the galactic anticenter. This is due to the fact that, under the influence of the galactic magnetic field, the transition from ballistic to diffusive behavior is well advanced, and this qualitative picture persists over the whole energy range. Guided by models of the galactic magnetic field that indicate that the enhancement along the galactic plane should have a standard deviation of about 20∘ in galactic latitude, and the deficit in the galactic anticenter direction should have a standard deviation of about 50∘ in galactic longitude, we use the data of the Telescope Array surface detector in to eV energy range to search for these effects. The data are isotropic. Neither an enhancement along the galactic plane nor a deficit in the galactic anticenter direction is found. Using these data we place an upper limit on the fraction of EeV cosmic rays of galactic origin at 1.3% at 95% confidence level.
keywords:
cosmic ray , galactic protons , telescope array , surface detector1 Introduction
In studying ultrahigh energy cosmic rays, a fluorescence detector can observe the development profile of extensive air showers initiated by primary cosmic rays. A detector with pixel size of 1∘, can measure the depth of shower maximum, , to an accuracy of about 20 g/cm2 [1]. This is sufficient to determine, on a statistical basis, the composition of primary cosmic rays. Although in some energy ranges there is disagreement among experiments [1, 2, 3], from about to eV, all fluorescence measurements indicate that the composition is light, and probably protonic.
If this is the case, it is interesting to ask: are the sources of these cosmic ray protons galactic or extragalactic. One way to answer this question is to look for anisotropy in their arrival directions. While extragalactic protons should be isotropic, one would expect that the arrival directions of EeV protons of galactic origin should be concentrated near the galactic plane. The reason is that the critical energy () of the galactic magnetic field - the energy where the Larmor radius equals the coherence length of the turbulent component ([4]) - is thought to be about 0.3 EeV [5]. At energies below one expects to see an isotropic distribution, since the turbulent component randomizes proton directions. Conversely, protons of - eV should spiral around the regular component of the field, but their directions should not be randomized by the turbulent component.
In addition, if galactic cosmic ray sources were concentrated in the disk, and there were many more sources at smaller galactic radii than the galactic radius of the sun, there would be a second anisotropy signal, a relative shortage of events in the direction of the galactic anticenter. For definiteness, in our model [6] we chose the distribution of pulsars. The details of this distribution are not important, as long as the sources are concentrated in the disk and their density is much larger than 1/kpc3 [6]. For a lower density of sources, our simulations show that an unmistakable anisotropy would result from the sources nearest to the Earth. Since we will see below that the data is isotropic to high accuracy, this case is not realized in nature.
To search for these anisotropy signals, it would be useful to be able to estimate the geometrical size of the effects: how wide should the enhancement along the galactic plane be; and how wide should the shortage of events be when looking along the galactic plane in the direction of the galactic anticenter. To perform these estimates, we traced protons of - eV through the galactic magnetic field (GMF) to the vicinity of the earth. In galactic coordinates (,), the result [6] is that the enhancement in should be about 20∘ in standard deviation, and the deficit centered at should have a standard deviation of about 50∘.
These predictions are not sensitive to the details of the model [6]. For example, a large part of the enhancement along the galactic plane comes from events whose sources are located in the same galactic arm as the sun. This type of enhancement will occur for any model as long as the regular component of the GMF follows the galactic arms.
In Section 2 of this paper we describe the properties of the GMF model and the prediction for anisotropy if protons in the - eV range were of galactic origin. In Section 3 we describe the data collected by the surface detector (SD) of the Telescope Array (TA) experiment. In Section 4 we present our results and conclusions.
2 GMF Model and Anisotropy Prediction
The modeling of proton propagation in the GMF that we performed, prior to searching for effects in the TA data, is described in reference [6]. In the galactic disk the magnetic field has two components: a regular component which follows the galactic arms, and a random component with critical energy 0.3 EeV. In the energy range of interest the effects of the random component are subdominant [7]. Above and below the galactic disk the halo component has a toroidal shape. The main GMF model we use is that of M. Pshirkov et al. [8]. The model of R. Jansson and G. Farrar [9] gives very similar quantitative answers. Since the magnitude of the regular component of the GMF at the location of the earth is slightly smaller in Jansson and Farrar’s model than in that of Pshirkov et al., the enhancement along , and the deficit in around the galactic anticenter are slightly narrower, and the effects we are searching for are slightly larger. The distribution of sources is assumed to be the same as the distribution of pulsars in the galaxy given in reference [10].
It is clear that at energies the random component isotropizes the distribution of cosmic rays. If there are many sources, one would see a continuous distribution in (,). Above , for instance for - eV, the random component of the GMF cannot isotropize cosmic rays. If the source density is high, a continuous distribution (no small-scale excesses or deficits) will result. If the source density is low, the nearest sources will produce small-scale anisotropy signals, which are not visible in the data described later in this paper.
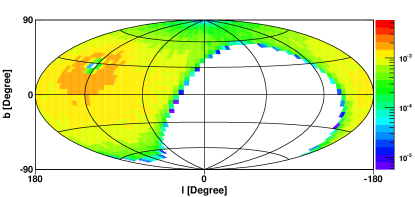
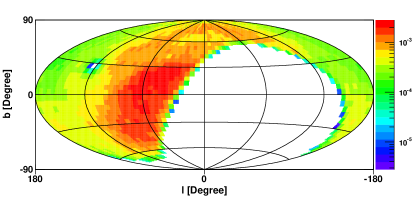
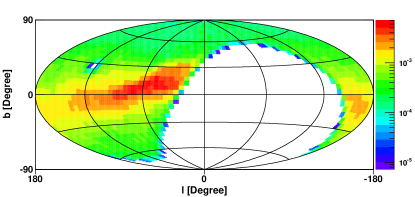
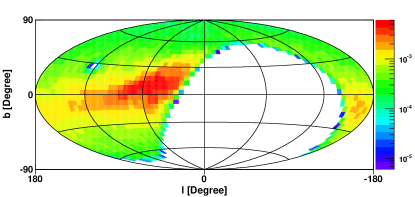
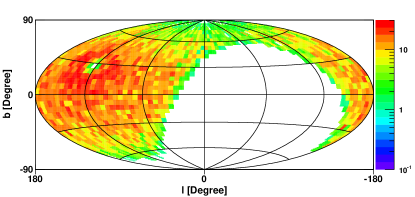
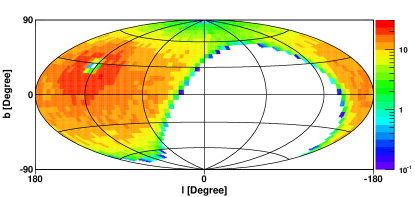
Figures 1b - 1c show sky maps of the prediction of the Pshirkov et al. model for galactic protons at 1 and 3 EeV, respectively. Figure 1d shows the model prediction for the galactic protons with energies distributed according to the measured spectrum of cosmic rays in the eV range, [11, 12, 13, 14, 15, 16, 17], where the High Resolution Fly’s Eye, Telescope Array, and Pierre Auger experiments are in good agreement, when their measurements are adjusted to use a common energy scale.
Figure 1a shows the sky map if the distribution were isotropic. The anisotropies show up clearly in Figures 1b - 1d.
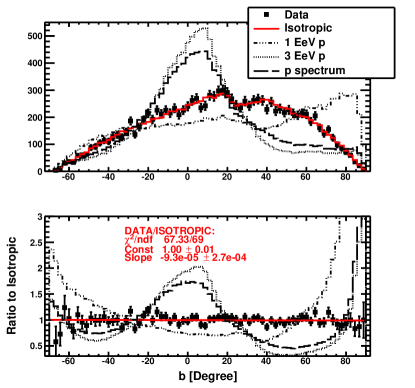
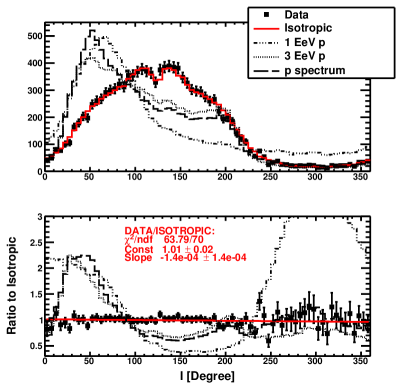
Figure 2a shows a histogram of events in as it would be seen by the TA experiment, and Figure 2b shows the histogram in . This figure is a prediction of what would be seen if all cosmic rays in the - eV energy range were protons of galactic origin. Also shown are the and of the TA data, and histograms of an isotropic distribution, according to the TA surface detector Monte Carlo simulation. All histograms are normalized to the same area. The galactic and isotropic distributions are clearly different, and a measurement of the and distributions of cosmic rays in the - eV energy range should allow a determination of the fraction of events of galactic origin. A hint of the result is already shown in the Figure 2. It is worth emphasizing that the prediction of the isotropic Monte Carlo simulation is robust (the TA Monte Carlo simulation is very accurate), but there is some model dependence in the exact shape of the and distributions from galactic sources. If the data were to resemble the galactic model, or if there were a mixture of galactic and extragalactic sources, one would perform a fit to the sum of isotropic and galactic models to determine the ratio of events from the two types of sources. One might have to vary the galactic model shape to get a good fit. If the data were to resemble the isotropic simulation then one would search for a deviation from that simulation by using the widths of the expected galactic distributions. In Section 4 we will see that there is no ambiguity in the result.
3 Telescope Array Surface Detector Data
To perform the search we used the data of the surface detector of the Telescope Array experiment. TA is the largest experiment studying ultrahigh energy cosmic rays in the northern hemisphere. The TA experiment consists of a surface detector (SD) [20] covering 700 km2, and 48 fluorescence telescopes [21, 22], located at three sites, which overlook the SD array. The data described here were collected over 7 years, from 11 May, 2008 to 11 May, 2015.
The TA SD consists of 507 scintillation counters each 3 m2 in area, deployed in a grid of 1.2 km spacing in the desert of Millard County, Utah, USA. There are 2 layers of plastic scintillator in each counter. The counters are solar-powered, read out by a radio system, and calibrated using single muons every 10 minutes, to determine the pulse height of a minimum ionizing particle (MIP). The SD trigger is satisfied when within an 8s window 3 adjacent counters have energy deposits equivalent to 3 MIPs or more. Every second the counters are queried as to the times of 3 MIP hits, and when the trigger conditions are satisfied, all counters are instructed to report the FADC wave forms of hits above 0.3 MIP energy deposit.
TA SD data analysis consists of two steps: the first is a fit to the time that counters are struck, to determine the direction of the air shower, and the second is a fit to the distribution of counter pulse heights as a function of distance perpendicular to the path of the air shower. The signal at a distance of 800 m from the shower core, called S800, is determined and the cosmic ray energy is found from a look-up table with inputs S800 and sec(), where is the zenith angle of the shower. The energies come from a Monte Carlo simulation of the SD using CORSIKA [23] and the hadronic generator QGSJET II-3 [24]. The TA SD energy resolution is estimated from the Monte Carlo to be 36% for , 29% for , and 19% for [12]. The TA SD angular resolution is 2.4o for , 2.1o for , and 1.4o for [12].
Although the approximation technique called thinning is used in our Monte Carlo simulation, we carry out a process called de-thinning [25] to restore lost shower information. Upon comparing the energies of cosmic rays found in this way, and those found for the same events using the data of our fluorescence detectors, we see a difference of a constant fraction of 1.27 [26], independent of energy. Because the fluorescence detector energy measurement has a smaller systematic uncertainty, since it is a calorimetric determination, we correct the SD energy (downward) by this factor.
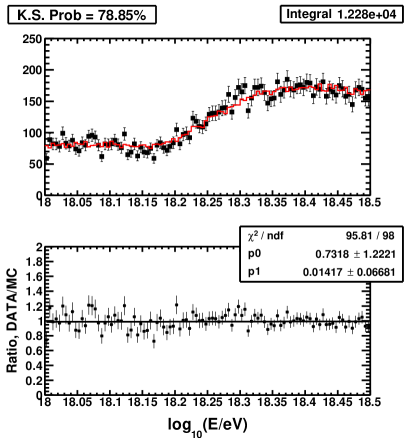
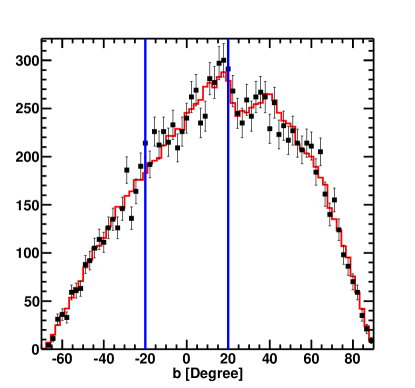
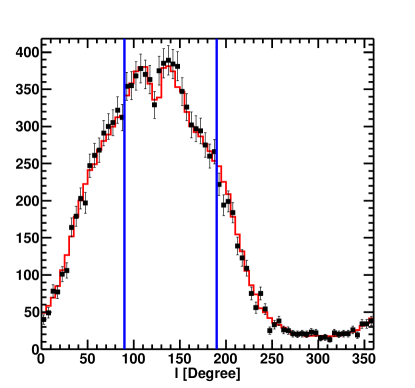
Choosing events of energies between and eV, (the energy histogram is shown in Figure 3), we show in Figure 4 histograms of the galactic latitude, , and longitude, . The data is shown as black points with error bars, and the red histogram is the prediction of our Monte Carlo simulation for an isotropic distribution. The blue lines indicate the range over which an excess in , and a deficit in , are expected if - eV cosmic rays come from galactic sources. No excess at low galactic latitudes is evident, nor does a deficit of events show up at = 140∘, the direction away from the galactic center.
4 Results
We search for evidence for galactic origin of cosmic rays in our data using two approaches. In the first approach, we compare the galactic latitude and longitude histograms shown in Figure 4 to the Monte Carlo distributions of isotropic events. This method is less sensitive to the details of the model of the galactic protons: the only model-dependent information used in this approach is that there is an expected excess for and a deficit for , if we simulate galactic protons using measured cosmic ray spectrum in eV range.
In Figure 4, the Monte Carlo is normalized to the total number of events in the data. We calculate the fractional difference, between the data and Monte Carlo while applying a cut on galactic latitude, : . We then calculate while applying a cut in . Here and are the number of data and isotropic Monte Carlo events that pass the cuts on , and separately, and is the total number of events in our data between and eV, which is 12281 for the 7 years of TA SD data. No significant enhancement in or deficit in was found. The 95% confidence level upper limit on from this study is found to be 1.3% for the analysis, and 0.3% for the analysis.
In the second approach, we use the full 2-dimensional information of the model of the galactic protons and fit the data distribution to a function of the form, , where is the number of data events in each bin in and , is the flux model in the case of isotropy, is the flux calculated using a galactic proton model, is the overall normalization constant, and is the amplitude of the anisotropy due to the model, which is related to the fraction of the galactic protons by , where for . If we fit the data to the Galactic proton model that follows measured cosmic ray spectrum (as shown in Figure 5), we find the answer: , which means that the upper 95% C.L. limit on is 0.9%. If we repeat this search using 1 and 3 EeV galactic proton models, we find answers (0.5% for 95% C.L. on ) and (0.8% for 95% C.L. on ), respectively. Also, if we repeat the same analysis in - eV energy range, the answer for the fraction of the galactic protons is 0.7%, at 95% confidence level.
5 Summary
We have searched for evidence that cosmic rays in the - eV energy range, thought to be largely protons, are of galactic origin. Models of the galactic magnetic field predict that if this were true anisotropy should be present in cosmic rays’ arrival directions. No anisotropy is seen. Examining the dependence of the event distribution turns out to be the most sensitive test, resulting in 0.3% for the upper limit on the fraction of the galactic protons, at 95% confidence level. For the final answer, we choose 1.3% (95% C.L.), a more conservative answer obtained by comparing the distributions of between the data and the isotropic Monte Carlo.
6 Acknowledgements
The Telescope Array experiment is supported by the Japan Society for the Promotion of Science through Grants-in-Aid for Scientific Research on Specially Promoted Research (21000002) “Extreme Phenomena in the Universe Explored by Highest Energy Cosmic Rays” and for Scientific Research (19104006), and the Inter-University Research Program of the Institute for Cosmic Ray Research; by the U.S. National Science Foundation awards PHY-0307098, PHY-0601915, PHY-0649681, PHY-0703893, PHY-0758342, PHY-0848320, PHY-1069280, PHY-1069286, PHY-1404495 and PHY-1404502; by the National Research Foundation of Korea (2015R1A2A1A01006870, 2015R1A2A1A15055344, 2016R1A5A1013277, 2007-0093860, 2016R1A2B4014967); by the Russian Academy of Sciences, RFBR grant 16-02-00962a (INR), IISN project No. 4.4502.13, and Belgian Science Policy under IUAP VII/37 (ULB). The foundations of Dr. Ezekiel R. and Edna Wattis Dumke, Willard L. Eccles, and George S. and Dolores Doré Eccles all helped with generous donations. The State of Utah supported the project through its Economic Development Board, and the University of Utah through the Office of the Vice President for Research. The experimental site became available through the cooperation of the Utah School and Institutional Trust Lands Administration (SITLA), U.S. Bureau of Land Management (BLM), and the U.S. Air Force. We appreciate the assistance of the State of Utah and Fillmore offices of the BLM in crafting the Plan of Development for the site. We also wish to thank the people and the officials of Millard County, Utah for their steadfast and warm support. We gratefully acknowledge the contributions from the technical staffs of our home institutions. An allocation of computer time from the Center for High Performance Computing at the University of Utah is gratefully acknowledged.
References
- [1] R. U. Abbasi, et al., Study of Ultra-High Energy Cosmic Ray composition using Telescope Array’s Middle Drum detector and surface array in hybrid mode, Astropart. Phys. 64 (2015) 49–62. arXiv:1408.1726, doi:10.1016/j.astropartphys.2014.11.004.
- [2] A. Aab, et al., Depth of maximum of air-shower profiles at the Pierre Auger Observatory. II. Composition implications, Phys. Rev. D90 (12) (2014) 122006. arXiv:1409.5083, doi:10.1103/PhysRevD.90.122006.
- [3] R. U. Abbasi, et al., Indications of Proton-Dominated Cosmic Ray Composition above 1.6 EeV, Phys. Rev. Lett. 104 (2010) 161101. arXiv:0910.4184, doi:10.1103/PhysRevLett.104.161101.
- [4] R. Beck, Galactic and extragalactic magnetic fields, Space Sci. Rev. 99 (2001) 243–260. arXiv:astro-ph/0012402, doi:10.1023/A:1013805401252.
- [5] M. Haverkorn, Magnetic Fields in the Milky Way, Astrophysics and Space Science Library 407 (2014) 483–506. arXiv:1406.0283, doi:10.1007/978-3-662-44625-6_17.
- [6] P. G. Tinyakov, F. R. Urban, D. Ivanov, G. B. Thomson, A. H. Tirone, A signature of EeV protons of Galactic origin, Mon. Not. Roy. Astron. Soc. 460 (2016) 3479–3487. arXiv:1511.01333, doi:10.1093/mnras/stw1163.
- [7] M. S. Pshirkov, P. G. Tinyakov, F. R. Urban, Mapping UHECRs deflections through the turbulent galactic magnetic field with the latest RM data, Mon. Not. Roy. Astron. Soc. 436 (2013) 2326. arXiv:1304.3217, doi:10.1093/mnras/stt1731.
- [8] M. S. Pshirkov, P. G. Tinyakov, P. P. Kronberg, K. J. Newton-McGee, Deriving global structure of the Galactic Magnetic Field from Faraday Rotation Measures of extragalactic sources, Astrophys. J. 738 (2011) 192. arXiv:1103.0814, doi:10.1088/0004-637X/738/2/192.
- [9] R. Jansson, G. R. Farrar, A New Model of the Galactic Magnetic Field, Astrophys. J. 757 (2012) 14. arXiv:1204.3662, doi:10.1088/0004-637X/757/1/14.
- [10] D. R. Lorimer, The galactic population and birth rate of radio pulsars[IAU Symp.218,105(2004)]. arXiv:astro-ph/0308501.
- [11] R. U. Abbasi, et al., Observation of the GZK cutoff by the HiRes experiment, Phys. Rev. Lett. 100 (2008) 101101. arXiv:astro-ph/0703099, doi:10.1103/PhysRevLett.100.101101.
- [12] D. Ivanov, Energy Spectrum Measured by the Telecope Array Surface Detector, Ph.D. thesis, Rutgers—The State University of New Jersey, Department of Physics and Astronomy, Piscataway, New Jersey, USA (October 2012).
- [13] R. U. Abbasi, et al., The energy spectrum of cosmic rays above 1017.2 eV measured by the fluorescence detectors of the Telescope Array experiment in seven years, Astropart. Phys. 80 (2016) 131–140. arXiv:1511.07510, doi:10.1016/j.astropartphys.2016.04.002.
- [14] A. Aab, et al., Measurement of the cosmic ray spectrum above 4 1018 eV using inclined events detected with the Pierre Auger Observatory, JCAP 1508 (2015) 049. arXiv:1503.07786, doi:10.1088/1475-7516/2015/08/049.
- [15] V. Verzi, Measurement of the Energy Spectrum of Cosmic Rays with the Pierre Auger Observatory, JPS Conf. Proc. 9 (2016) 010001. doi:10.7566/JPSCP.9.010001.
- [16] D. Ivanov, et al., TA Spectrum Summary, in: Proceedings of the 34th ICRC, Hague, NL, 2015.
- [17] I. Valino, The flux of ultra-high energy cosmic rays after ten years of operation of the Pierre Auger Observatory, in: Proceedings of the 34th ICRC, Hague, NL, 2015.
- [18] P. Abreu, et al., Large scale distribution of arrival directions of cosmic rays detected above eV at the Pierre Auger Observatory, Astrophys. J. Suppl. 203 (2012) 34. arXiv:1210.3736, doi:10.1088/0067-0049/203/2/34.
- [19] P. Abreu, et al., Constraints on the origin of cosmic rays above eV from large scale anisotropy searches in data of the Pierre Auger Observatory, Astrophys. J. 762 (2012) L13. arXiv:1212.3083, doi:10.1088/2041-8205/762/1/L13.
- [20] T. Abu-Zayyad, et al., The surface detector array of the Telescope Array experiment, Nucl. Instrum. Meth. A689 (2013) 87–97. arXiv:1201.4964, doi:10.1016/j.nima.2012.05.079.
- [21] T. Abu-Zayyad, et al., New air fluorescence detectors employed in the Telescope Array experiment, Nucl. Instrum. Meth. A676 (2012) 54–65. arXiv:1201.0002, doi:10.1016/j.nima.2012.02.044.
- [22] T. Abu-Zayyad, et al., The energy spectrum of Telescope Array’s Middle Drum detector and the direct comparison to the High Resolution Fly’s Eye experiment, Astropart. Phys. 109 (2012) 39–40.
- [23] D. Heck, G. Schatz, T. Thouw, J. Knapp, J. N. Capdevielle, CORSIKA: A Monte Carlo code to simulate extensive air showers, Tech. Rep. 6019, FZKA (1998).
- [24] S. Ostapchenko, QGSJET-II: Towards reliable description of very high energy hadronic interactions, Nucl. Phys. Proc. Suppl. 151 (2006) 143–146. arXiv:hep-ph/0412332, doi:10.1016/j.nuclphysbps.2005.07.026.
- [25] B. T. Stokes, et al., Dethinning extensive air shower simulations, Astropart. Phys. 35 (2012) 759. arXiv:1104.3182.
- [26] T. Abu-Zayyad, et al., The Cosmic Ray Energy Spectrum Observed with the Surface Detector of the Telescope Array Experiment, Astrophys. J. 768 (2013) L1. arXiv:1205.5067, doi:10.1088/2041-8205/768/1/L1.