∎
Seattle, WA. 98195-3925 USA.
22email: pedro.doria.maia@gmail.com 33institutetext: J. Nathan Kutz 44institutetext: Department of Applied Mathematics, University of Washington,
Seattle, WA. 98195-3925 USA.
44email: kutz@uw.edu
Reaction time impairments in decision-making networks as a diagnostic marker for traumatic brain injuries and neurodegenerative diseases
Abstract
The presence of diffuse Focal Axonal Swellings (FAS) is a hallmark cellular feature in many neurodegenerative diseases and traumatic brain injury. Among other things, the FAS have a significant impact on spike-train encodings that propagate through the affected neurons, leading to compromised signal processing on a neuronal network level. This work merges, for the first time, three fields of study: (i) signal processing in excitatory-inhibitory (EI) networks of neurons via population codes, (ii) decision-making theory driven by the production of evidence from stimulus, and (iii) compromised spike-train propagation through FAS. As such, we demonstrate a mathematical architecture capable of characterizing compromised decision-making driven by cellular mechanisms. The computational model also leads to several novel predictions and diagnostics for understanding injury level and cognitive deficits, including a key finding that decision-making reaction times, rather than accuracy, are indicative of network level damage. The results have a number of translational implications, including that the level of network damage can be characterized by the reaction times in simple cognitive and motor tests.
Keywords:
Alzheimer Focal Axonal Swellings Cognitive Deficits Decision Making Neural Networks Neurodegenerative Disease Multiple Sclerosis Parkinson Traumatic Brain Injury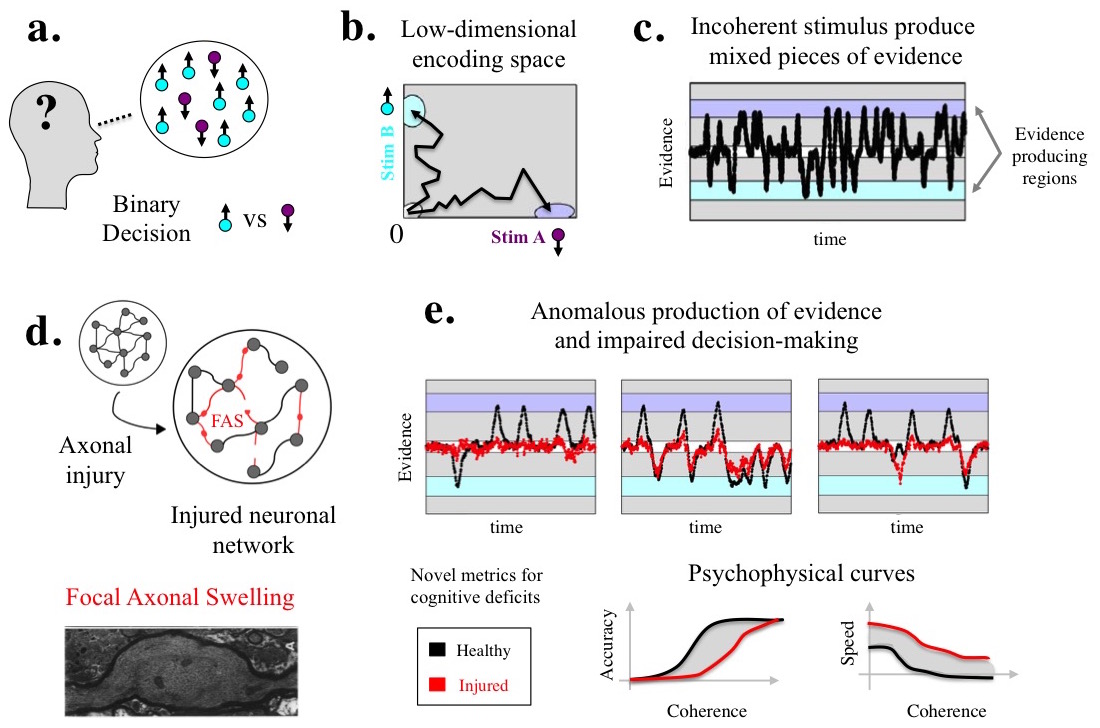
1 Introduction
Neurodegenerative diseases and traumatic brain injuries are responsible for an overwhelming variety of functional deficits in animals and humans, with common developments including memory loss or behavioral/cognitive impairments. Many brain disorders have a complex cascade of pathological effects spanning multiple spatial scales: from cellular or network levels to tissues or entire brain regions. Our limited ability to diagnose cerebral malfunctions in vivo cannot detect several anomalies that occur on smaller scales. In this sense, Focal Axonal Swellings (FAS) are ubiquitous to many incurable disorders such as Multiple Sclerosis, Alzheimer’s and Parkinson’s diseases, dramatically affecting signaling properties of neurons associated with cognitive tasks. Moreover, FAS are a hallmark feature of traumatic brain injury. To evaluate the impact of FAS in neuronal networks, we consider a computational setting where a healthy network produces evidence for different stimuli in the form of low-dimensional encodings (population codes). When presented with incoherent stimuli, the system integrates all mixed evidence, displaying stereotypical binary decision-making capabilities. The addition of axonal lesions and their impact on spike trains decrease the system’s ability to transmit information with functional population codes. FAS also create a variety of anomalies regarding the production of evidence, which includes both biased and unbiased errors, confusion, and amplification of false, small signatures. In all cases, reaction time deficits are the most aggravating effect of FAS to decision-making performance, with reaction times slowing proportionally to the network’s injury level. We suggest that decision-making tasks are not only a window to study cognition, but also a diagnostic platform for a variety of neurological pathologies and disorders.
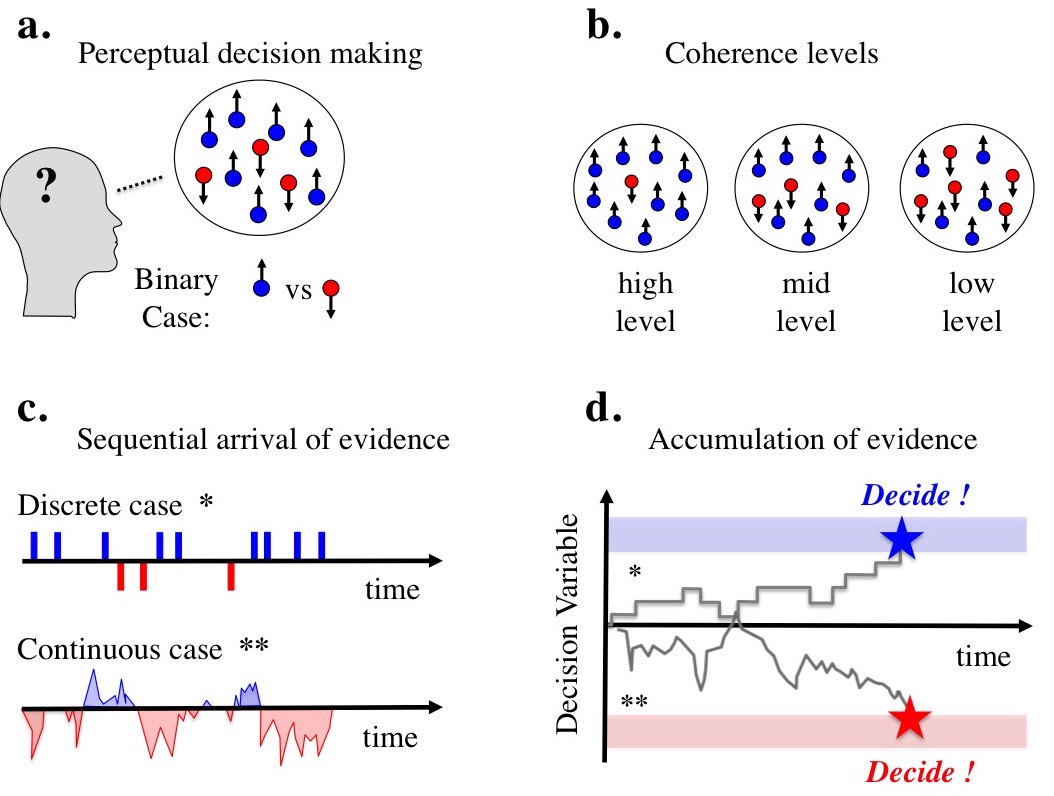
Figure 1 provides a schematic overview of this computational study. We posit a neuronal network with biologically plausible binary Decision-Making (DM) capabilities (A vs B). The core of the DM system consists of an input/output network of excitatory-inhibitory (EI) neurons that responds to meaningful stimuli with robust, low-dimensional population codes. These codes are coupled to an accumulation model that integrates all produced evidence and commits to an alternative when a decision boundary is reached. The system’s performance is described by accuracy/speed psychophysical curves as a function of the task’s difficulty level. Throughout each step of the model, we describe a variety of impairments caused by the focal axonal swellings developed at a cellular level; from hindered network responses to the anomalous production of evidence that if accumulated over time, leads to quantifiable cognitive deficits.
Although DM theory (see the review article Shadlen2016 and references therein) and neural network computational studies (see the reviews Network_Review ; Dayan2001 ; Gerstner2014 and references therein), especially EI networks, are quite mature in the computational neuroscience community, the spike-train propagation through damaged axons has only recently been explored Maia2014_1 ; Maia2014_2 ; Maia2015 . By merging these three distinct areas of study, we can provide a general theoretical architecture for understanding how the cellular progression of neurodegenerative diseases and/or traumatic brain injury can directly lead to compromised DM and cognitive deficits. Thus, by merging three key areas of study, we advance the theory linking cell level biophysics to behavioral decision-making capabilities. Critical to the viability of the theory is the direct connection of the FAS imposed in the computational model with biophysically observed FAS statistics of swelling frequency and size distribution. Such statistics have been well characterized in a number of TBI studies, allowing us to calibrate our models to state-of-the-art biophysical observations. It is envisioned that the model can be easily integrated with other neurodegenerative disease studies and their FAS statistics.
The paper is outlined as follows: In Sec. 2, we review the main ideas behind decision making (drift-diffusion) models and provide a detailed background on Focal Axonal Swellings (FAS). Specifically, we list several neurological disorders in which FAS are implicated and discuss their effects to spike train propagation. Section 3 describes our calibration of FAS distributions from the experimental work of Wang et al. Wang2011 , our network model and its population codes, along with their interpretation in a proper low-dimensional space. We discuss our results in Sec. 4, which includes hindered network responses, loss of transmitted information, anomalous production of evidence and impaired decision making. A summary and discussion of our findings are given in Sec. 5. Possible applications and future directions for our studies are presented in Sec. 6.
2 Background
This work merges three distinct areas of study. As such, a brief review of the critical elements associated with each area is given. Specifically, we review the DM framework along with key aspects of the FAS literature arising in neurodegeneration and TBI. Finally, we review recent work on compromised spike train propagation due to FAS. The three areas are used simultaneously to produce an innovative viewpoint on cognitive deficits.
2.1 Decision making and diffusion-to-boundary models
Decision Making (DM) remains an active topic of research and is studied across a large variety of fields such as psychology, economics, engineering (and many others), but most importantly, in neuroscience. For an overview of DM theory, see Shadlen and Kiani Shadlen2016 for an up-to-date perspective of the field. In this subsection, we review some key aspects of the theoretical and computational models that regard DM as a window on cognition Shadlen2013 . We believe that a proper, quantifiable DM framework is essential to evaluate and interpret cognitive deficits arising from traumatic brain injuries and neurodegenerative diseases. See Fig. 2 for an illustrative schematics.
In this work, we follow Shadlen et al. Shadlen2007 and consider perceptual binary decisions (A vs B) made upon the sequential analysis of evidence. One common experimental setup consists of presenting a patch of moving dots to a fixated subject (see Panel 2a), where a fraction of the dots move coherently in a given direction. At any time, subjects can indicate their choice about the direction of motion of the stimulus. The difficulty level of the task is regulated by increasing or decreasing the coherence level within the stimulus (Panel 2b). This task allows for simultaneous recordings of reaction time and perceptual accuracy and is typically modeled by diffusion-to-boundary models Bogacz2006 ; Ditterich2006 ; Ratcliff1998 . As illustrated in Panel 2c, evidence arrives discretely or continuously in time. In our scheme, different signs/colors refer to distinct choices. A decision variable accumulates evidence in Panel 2d and commits to one of the alternatives by reaching a boundary. These tasks are typically performed by human or monkey subjects, allowing for both psychophysical and physiological investigation, see Shadlen2013 for a comprehensive overview.
The diffusion-to-boundary model, although perhaps most commonly used in theory, is only one specific manifestation of a DM model. A variety of other exist which modify this basic architecture. Indeed, recent biological experiments in rats and humans, for instance, have successfully explored random click tasks to reveal internal properties of decision-making processes Brunton2013 , thus providing a modification of the basic DM architecture. We have chosen to use the basic theoretical framework by Shadlen et al. Shadlen2007 , but the others could just as easily have been used without affecting our basic paradigm. Specifically, we develop a system with biologically plausible DM capabilities coupling an accumulation of evidence model to a neuronal network whose robust population codes are interpreted as evidence for Choices A or B. We will demonstrate that the presence of FAS hinders the network functionality in a variety of ways, including by compromising evidence production, leading to the anomalous production of evidence and consequently, to accuracy and speed deficits.
2.2 FAS in TBI and neurodegenerative diseases
The presence of diffusive FAS is ubiquitous across a host of neurodegenerative diseases and TBI. This is well established in the literature that is reviewed below by disease type. Although other deleterious effects may be present in a damaged axon, the FAS in and of itself can significantly alter spike trains and their information content. Note that many of these landmark studies have only appeared in the last 5 years, allowing for our theoretical developments.
Traumatic Brain Injury:
TBI is one of the major causes of disability and mortality worldwide, which in turn, dramatically jeopardizes society in several socioeconomic ways cdc . Concussions and other milder forms of TBI are more than ever a concern for contact sports and their practitioners book_SI . Soldiers are systematically exposed to blast injuries, which led to the recognition of TBI as the signature wound of the wars in Iraq and Afghanistan Jorge2012 . While many survive TBI events, persistent cognitive, psychiatric, and physiological dysfunction often follows from the mechanical impact Lobue2016 . These issues are pushing the scientific and medical communities to transform clinical procedures Yue2013 and update our epidemiological understanding of TBI in society Roozenbeek2013 . See Menon et al. (Menon2015 ) for a recent report on progress, failures and new approaches in TBI research.
One of the main complications of TBI pathophysiology is that it may affect several different spatial scales: from cellular/microscopic levels to tissue and/or network levels Sharp2014 . Despite the insights gained with animal studies Browne2011 ; Rubovich2011 ; Xiong2013 and in vitro experiments Hemphill2011 ; Hemphill2015 ; Magdesian2012 ; Magdesian2016 , there are still many open questions and opportunities for translational studies Hill2016 . In particular, there have been only a modest number of theoretical and numerical works regarding blast-induced shockwaves Mau2016 , pathological effects on neuronal signaling Kolaric2013 ; Lachance2014 or network dysfunction Rudy2016 . This work aims to contribute with the latter, linking commonly found axonal injuries to a network’s impaired decision-making capabilities.
Alzheimer’s Disease:
AD is the most common type of dementia – an umbrella term that
describes a variety of disorders that arise when neurons die or no longer function normally
Jorm1998 ; Thies2013 . Neuronal malfunction ultimately affects memory, behavior and
the ability to think clearly, advocating for earlier diagnostics of mild cognitive impairments
Petersen2004 . Since aging is the single greatest risk factor for AD Patterson2015 , most
public health systems across the world are expected to face huge challenges due to the growing
elderly population Qiu2009 . In fact, someone in America develops AD every 68
seconds Thies2013 .
Recent reports present strong evidence that TBI patients are more likely to develop neurodegenerative disorders such as Alzheimer’s Disease, Chronic Traumatic Encephalopathy and Amyotrophic Lateral Sclerosis Gupta2016 . The risk is increased for those who, in adulthood, sustained a severe head injury Ikonomovic2004 . See Barnes2014 ; Johnson2010 ; Johnson2012 ; Lobue2016 and references therein for more studies linking TBI to AD and other forms of dementia. One commonality between all previously mentioned brain disorders (and many others) is the extensive presence of axonal injury, which we will explore in details in this work.
Focal Axonal Swellings in TBI:
Axonal injury (also referred to as diffuse/traumatic axonal injury) is a major outcome of all severities of TBI Edlow2016 ; Hanell2015 ; Henninger2016 ; Hill2016 . The longstanding assumption that axon loss is an immediate consequence of impacting mechanical forces has been supplanted by the understanding that most injured axons undergo secondary progressive changes that culminate in Focal Axonal Swellings (FAS) Hemphill2015 ; Johnson2013 ; Reeves2012 . FAS nomenclature varies across the literature, with varicosities, bulbs, spheroids, torpedoes and beadings being common synonyms. In any case, impaired axons provide a clear biophysical marker for evaluating cognitive and behavioral deficits induced by TBI Adams2011 ; Hay2016 ; Skandsen2010 .
The development of FAS following TBI is studied both in vivo Browne2011 ; Dikranian2008 ; Maxwell1997 ; Wang2011 and in vitro experiments Chen2009 ; Fayaz2000 ; Hellman2010 ; Hemphill2011 ; Hemphill2015 ; Magdesian2012 ; Morrison2011 ; Smith1999 and is tracked whenever possible in human patients Adams2011 ; Blumbergs1995 ; Christman1994 ; Grady1993 ; Jorge2012 ; Kinnunen2010 ; Povlishock2005 . Many factors can influence the morphological changes in axons Hemphill2015 ; Johnson2013 ; Morrison2011 , but the most striking finding is that swollen axon diameters can grow dramatically. Tang-Schomer et al. TangSchomer2012 ; TangSchomer2010 , for instance, reported significant axon diameter increases. Such changes are expected to significantly impair spike train propagation and consequently, the information encoded in them.
FAS in AD and other neurodegenerative diseases:
Axonal swellings are implicated in a large variety of neuronal disorders such as Alzheimer’s Disease (AD) Adalbert2009 ; Daianu2016 ; Krstic2012 ; Tsai2004 , Multiple Sclerosis Friese2014 ; Nikic2011 ; Trapp2008 , Parkinson’s Disease Tagliaferro2016 ; Louis2009 ; Galvin1999 , Creutzfeldt-Jakob’s Disease Liberski1999 , HIV Dementia Adle1999 , Neuromyelitis Optica Herwerth2016 , Neuropathies Karlsson2016 ; Lauria2003 , and Pelizaeus-Merzbacher Disease Laukka2016 . In many cases, FAS arise by the agglomeration of specific proteins over time Coleman2005 ; Millecamps2013 . In AD, for example, cell stress induces accumulation of amyloid precursor proteins in axonal compartments, Overall, one of the challenging aspects of research in neurodegenerative diseases and TBI is understanding how neuronal pathologies developed at a cellular level will ultimately compromise the functionality of an entire network of neurons.
2.3 FAS and their effects to spike train propagation
In the previous section, we argued that FAS are almost universal in neurodegenerative diseases, concussions, and TBI. However, as recently pointed by Hill et al. Hill2016 , one outstanding question remains unanswered: what is the functional significance of axonal varicosities? We believe that axonal swellings are responsible for, among other things, hindering the information transmitted from injured neurons to others. It is broadly accepted that (healthy) neurons excite/inhibit their neighbors proportionally to their firing-rate and that this collective activity ultimately produces some form of high-level network functionality (decision-making capability, memory retrieval, learning, etc). Recent theoretical and computational works demonstrate that there is an injurious interplay between electrophysiological dynamics and FAS. We will review some of these results and present ways to jeopardize neuronal firing-rate capabilities in a biophysically plausible manner. By modifying the internal dynamics of injured neurons, we obtain a large variety of interpretable network deficits.
Distinct propagation regimes:
Maia et al. Maia2014_1 investigated
cable equations with varying axonal diameters to identify critical regions for spike propagation
in axon segments. They characterized FAS morphologies by specifying key geometrical parameters
in a prototypical axonal enlargement model; the total diameter increase and how abruptly it occurs.
These parameters determine the propagation regime that spike trains will undertake when they reach
the FAS (See the schematics in Fig. 3a). Smaller swellings may still allow for intact
transmissions of spikes although the filtering regime (with spike shifts and deletions) is more common.
A spike can also split into two, one traveling forward and the other traveling backward. In this case,
when the backward propagating pulse collides with the next spike in the original spike train, both spikes
are deleted. As a consequence, a neuron’s firing rate in a reflection regime is effectively halved.
For more dramatic morphologies, the spike train can be completely blocked, setting the neuron’s firing
rate to zero. Axonal injury can thus be modeled by a (parameter-dependent) transfer function that returns
the effective firing rate after spike propagation through the FAS. The filtering regime was explored in details
in Maia2014_2 , where a pile-up collision mechanism deletes/filters one (out of two) adjacent spikes.
Thus, there is a probability that a spike train with firing rate will be confused as having firing rate
instead of . The confusion matrix in Fig. 3b summarizes all distinct scenarios.
Notice that higher firing rates are more affected, distorting the diagonal structure of the matrix.
The limitations of this methodology and its applicability to FAS diagnostics are explored in Maia2015 . For instance, the theoretical results are valid only for unmyelinated axons and should not be inadvertently extrapolated to other biophysical settings. From a pathological perspective Reeves2012 , unmyelinated axons are more vulnerable to TBI and comprise the numerical majority of cerebral axons.
3 Materials and Methods
With the background theory in hand, we can develop an integrated theoretical approach to understanding the effects of neurodegeneration and TBI in neuronal networks responsible for decision making. The specifics of our theory are now given along with how the FAS statistics are used to calibrate our model.
3.1 Inferring FAS parameters from experimental data
The morphological features of FAS implicated in TBI and neurodegenerative diseases are heterogeneous. They can also jeopardize individual and collective neuronal dynamics in different ways. While injured networks are expected to perform worse, the main challenge is to introduce pathologies to the computational model in a biophysically compatible way. In this regard, we will infer the distribution of FAS and their corresponding functional deficits from a set of experimental results.
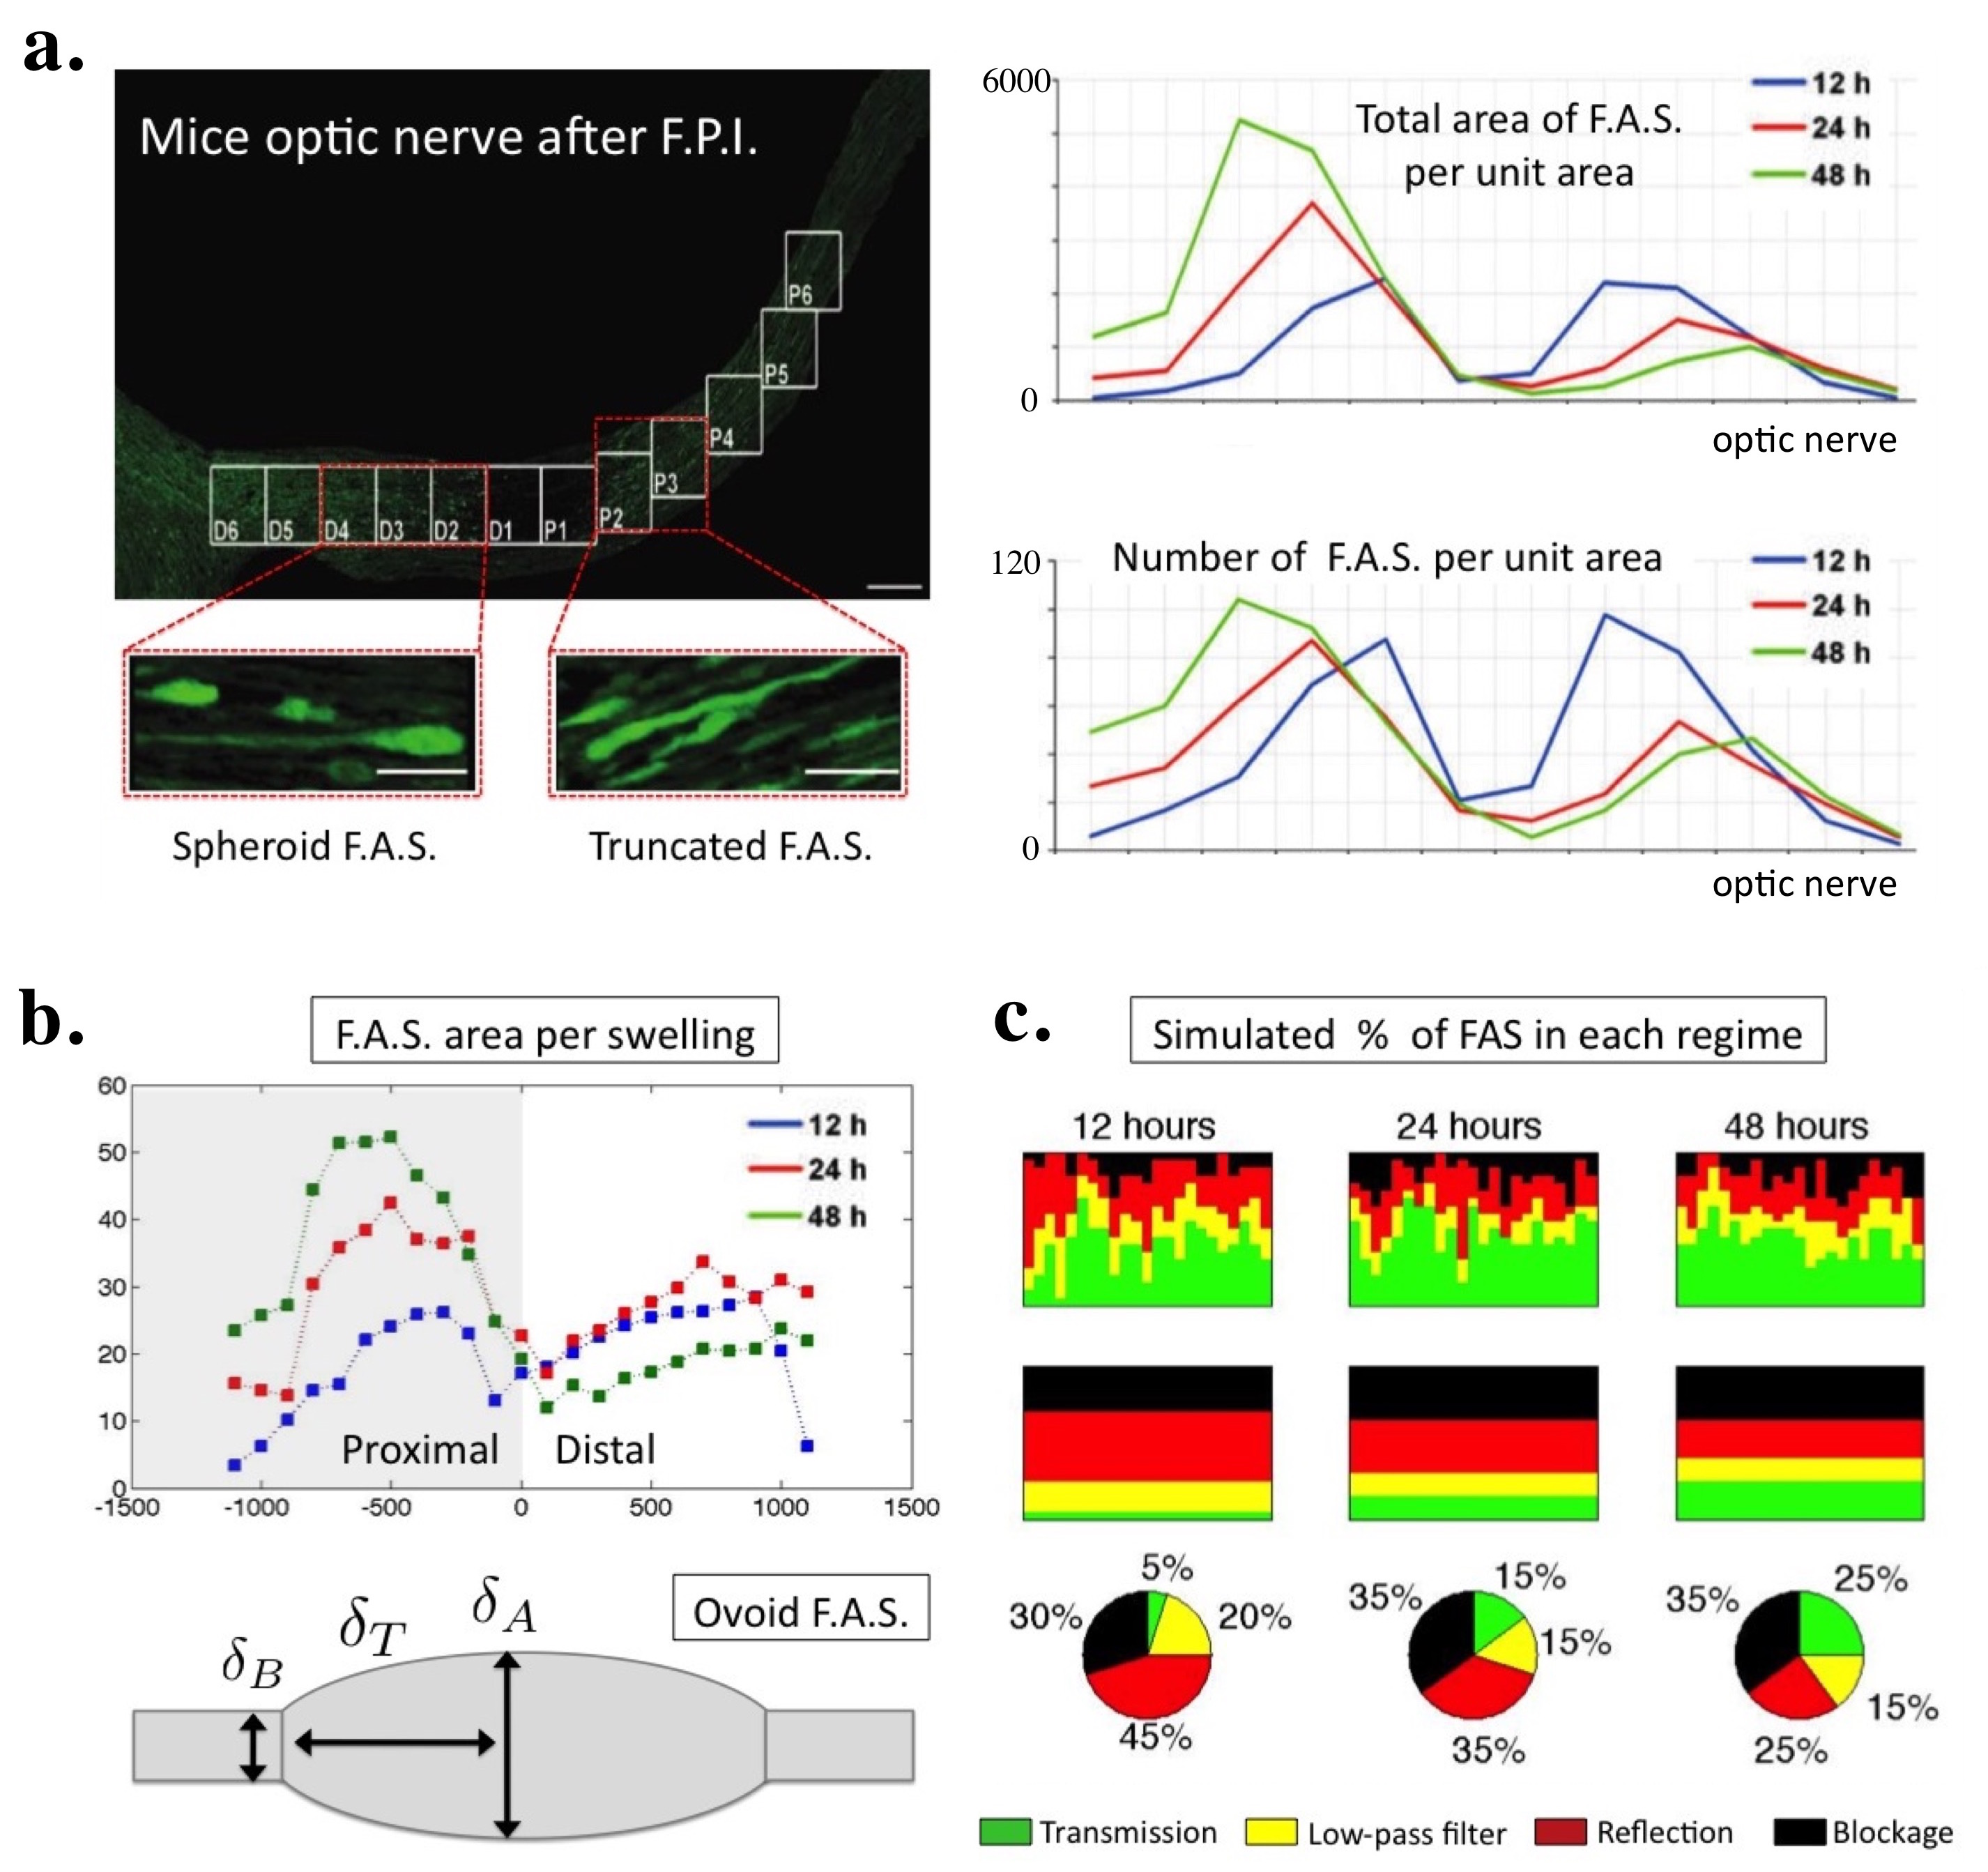
Wang et al. (Wang2011 ) traumatically damage the optic nerve of adult rats with a central fluid percussion injury. They sacrifice mice at different times after the TBI impact (12h, 24h, and 48h respectively) and remove the optic tract from the skull for fluorescence analysis and confocal microscopy. Figure 4a shows this relatively organized and aligned bundle of axons. Two qualitatively different shapes of swellings develop: spheroids (ellipses) at the distal segment and truncated forms at the proximal segment. The most relevant aspect of their study for us is the assessment of the total area and the number of FAS (per unit area). See the right plots in Fig. 4a. Swelling distributions differ along the spatial segments of the bundle in shape, size and number. Moreover, they evolve dynamically as the injury progress in time.
In Fig. 4b, we estimate the average area per swelling. Since the authors describe FAS in the distal segment as elliptical shapes (spheroids), we can generate a family of ovoids having an area within one standard deviation of the measurements. For each generated FAS, we extract the parameters , necessary to estimate the spike propagation regime (see section 2.3 or Maia2014_1 ; Maia2014_2 ; Maia2015 ). Wang et al. Wang2011 divide the optic nerve into 12 spatial grids, and we generate one swelling per grid for each injured axon. The upper flag-charts in Fig. 4b show 20 injured axons (rows) with 12 FAS each (columns). Each FAS has a functional deficit (transmission, filtering, reflection or blockage) according to its geometrical parameters. Finally, we assume that the worst swelling within an axon dominates and classifies the entire axon within that category (intermediate flag-charts). This lead to the pie-charts indicating the fraction of axons in each propagation regime.
There are several drawbacks with this methodology, but we believe that our distributions are biophysically reasonable and compatible with existing available data. Better results could be obtained if Wang et al. Wang2011 used the recently developed diagnostic (computational) tool of Maia and Kutz Maia2015 . Still, the results are interesting, because although the fraction of FAS in the transmission regime increases from 12h to 48h, the fraction of swellings in the blockage regime increases as well. Thus, it is not obvious if the system is ultimately recovering or losing functionality (see Fig. 4b).
3.2 Network model and governing equations
The modeling of neuronal networks is one of the most vibrant fields of computational neuroscience; there are numerous models throughout the literature, with varying levels of complexity, architectural configurations, and biological functionality Network_Review ; Dayan2001 ; Gerstner2014 . In this work we build a system with decision-making capabilities from a network of synaptically coupled firing rate units Dayan2001 . This setup allows the addition of injurious effects of FAS to neuronal dynamics in an intuitive and simple manner while retaining key aspects of the works of Maia and Kutz Maia2014_2 ; Maia2014_1 .
More broadly, high-dimensional neuronal networks are ubiquitous and characterized by a large connectivity graph whose structure determines how the system operates as a whole Watts:1998db ; Park2013science . Typically the connectivity is so complex that the functionality, control and robustness of the network of interest is impossible to characterize using currently available methods. Moreover, with few exceptions, underlying nonlinearities impair our ability to construct analytically tractable solutions, forcing one to rely on experiments and/or modern high-performance computing to study a given system. However, advances over the past decade have revealed a critical, and seemingly ubiquitous, observation: that meaningful input/output of signals in high-dimensional networks are encoded in low-dimensional patterns of dynamic activity jones07 ; rabinovich01 ; rabinovich08 .
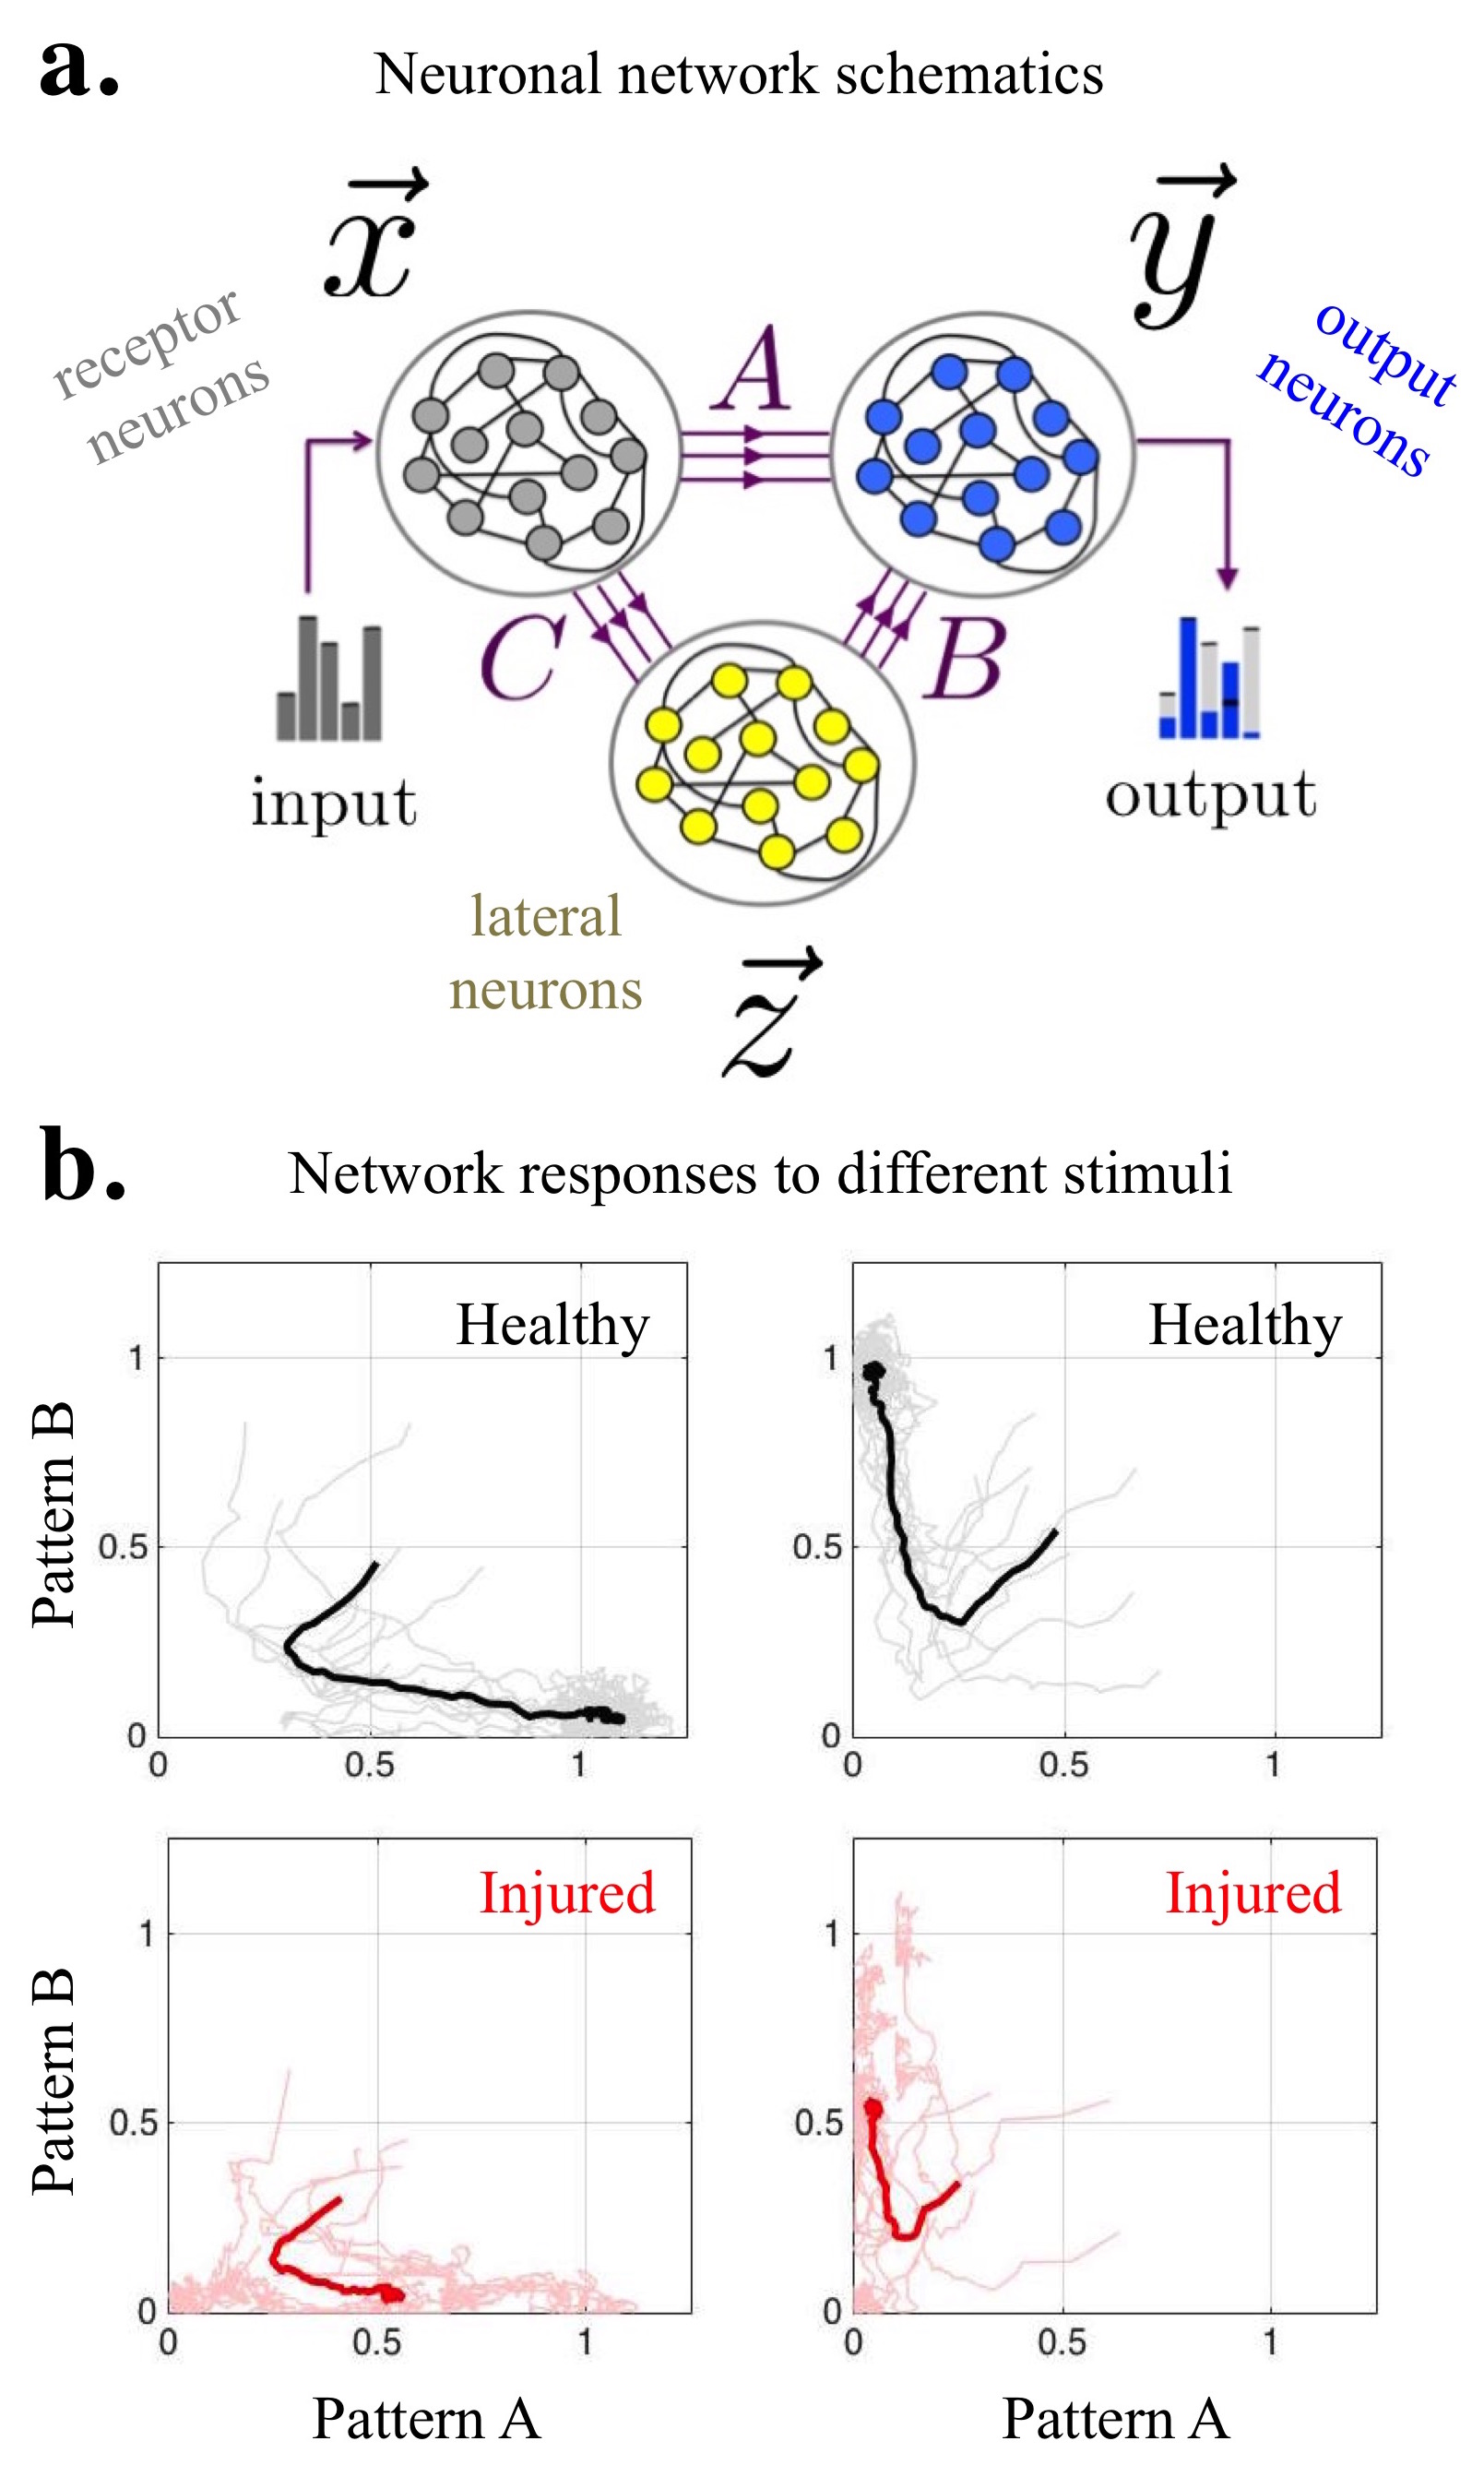
We avoided committing to a specific network architecture, keeping only three broad classes of neuronal subpopulations (see Fig. 5a): input neurons that receive different stimuli from the external environment, output neurons , and local/lateral interneurons . The dynamical equations of the system are given by:
| (1) | |||||
| (2) | |||||
| (3) |
The operator is a standard linear threshold function (Dayan2001 ) that rectifies each component of the vector, i.e.
| (4) |
The connectivity matrices and account for the neuronal coupling terms. See Table 1 for a list of all parameters used in the model. The network was calibrated (as in Shlizerman2014 ) to produce distinguishable responses to meaningful external stimuli and match observed input/output patterns. The input neurons lock at a faster timescale onto the driving stimulus , which in turn, excite or inhibit the subpopulation so that may produce a stable output associated to it.
| Symbol | Description | Remarks |
|---|---|---|
| input/receptor neurons | firing-rate units | |
| output/projection neurons | firing-rate units | |
| lateral/local interneurons | firing-rate units | |
| time scale for dynamics of | fast, reference time scale | |
| time scale for dynamics of | slower time scale | |
| time scale for dynamics of | slower time scale | |
| connections between and | assumed to be known | |
| connections between and | calibrated to match i/o patterns | |
| connections between and | assumed to be known | |
| connections between and | randomly connected | |
| external stimulus | usually or | |
| noise intensity | assumed Brownian () | |
| linear threshold function | see Equation (4) |
To simulate our equations numerically, we modified the MATLAB implementation of the Euler-Maruyama scheme from D. J. Higham Higham2001 to solve the stochastic differential Eqs. (1) - (3). The dW term refers to a standard Brownian/Wiener process, and the noise intensity level was calibrated to model natural stochastic fluctuations in the system.
3.3 Network responses in proper low dimensional spaces
The output neurons in the network produce high-dimensional dynamical responses , although they do not always have biological relevance. For example, in the absence of external stimulus, , the network’s activity consists of simple stochastic fluctuations around the resting state of the system. Thus, we will focus on the outputs of a pre-defined set of external stimuli () whose meaning should vary with context. For instance, on a network representing the antennal lobe of the Manduca sexta moth, the output codes represent the response to different stimulus odors used in flower discrimination (Riffell2014 ; Shlizerman2014 ). In the context of cognition, the external stimuli would be, for instance, associated with a recognition task (visual, auditory, tactile, etc).
The corresponding network responses form a library
in which each element (or pattern) encodes a specific stimulus: encodes , encodes , and so on. With a proper transformation and change of basis, one can rewrite the library as a set of orthonormal vectors
See Shlizerman2014 for mathematical and technical details. This allow us to write the dynamics of the output neurons with the low-rank decomposition
| (5) |
What completes the decomposition is the remainder vector onto which all meaningless features (non-library elements) are projected. We can now easily interpret network activity over time by tracking the projections and .
Binary case:
In this work, we limit our library to two distinct patterns ( and ) and use them to build a system with binary decision-making capabilities. This restriction can easily be lifted, but for the purposes of illustrating compromised decision making, a binary task will serve to illustrate our theory best. In this case, Eq. (5) simplifies to
In Figure 5B, we randomly initiate a healthy network and stimulate it with (left plots) or (right plots) and depict several trajectories (in gray) projected onto the PCA subspace generated by . Without noise (see Shlizerman2014 ), the trajectories would reach the fixed points or . Instead, they randomly fluctuate/gravitate around these values while the stimulus persists. The outcome for injured networks can vary significantly (see trajectories in red), depending on the injury levels, the subset of targeted neurons and FAS morphological distributions. These discrepancies will ultimately hinder the network’s production of evidence and impair its decision-making abilities.
4 Results
4.1 Compromised network responses
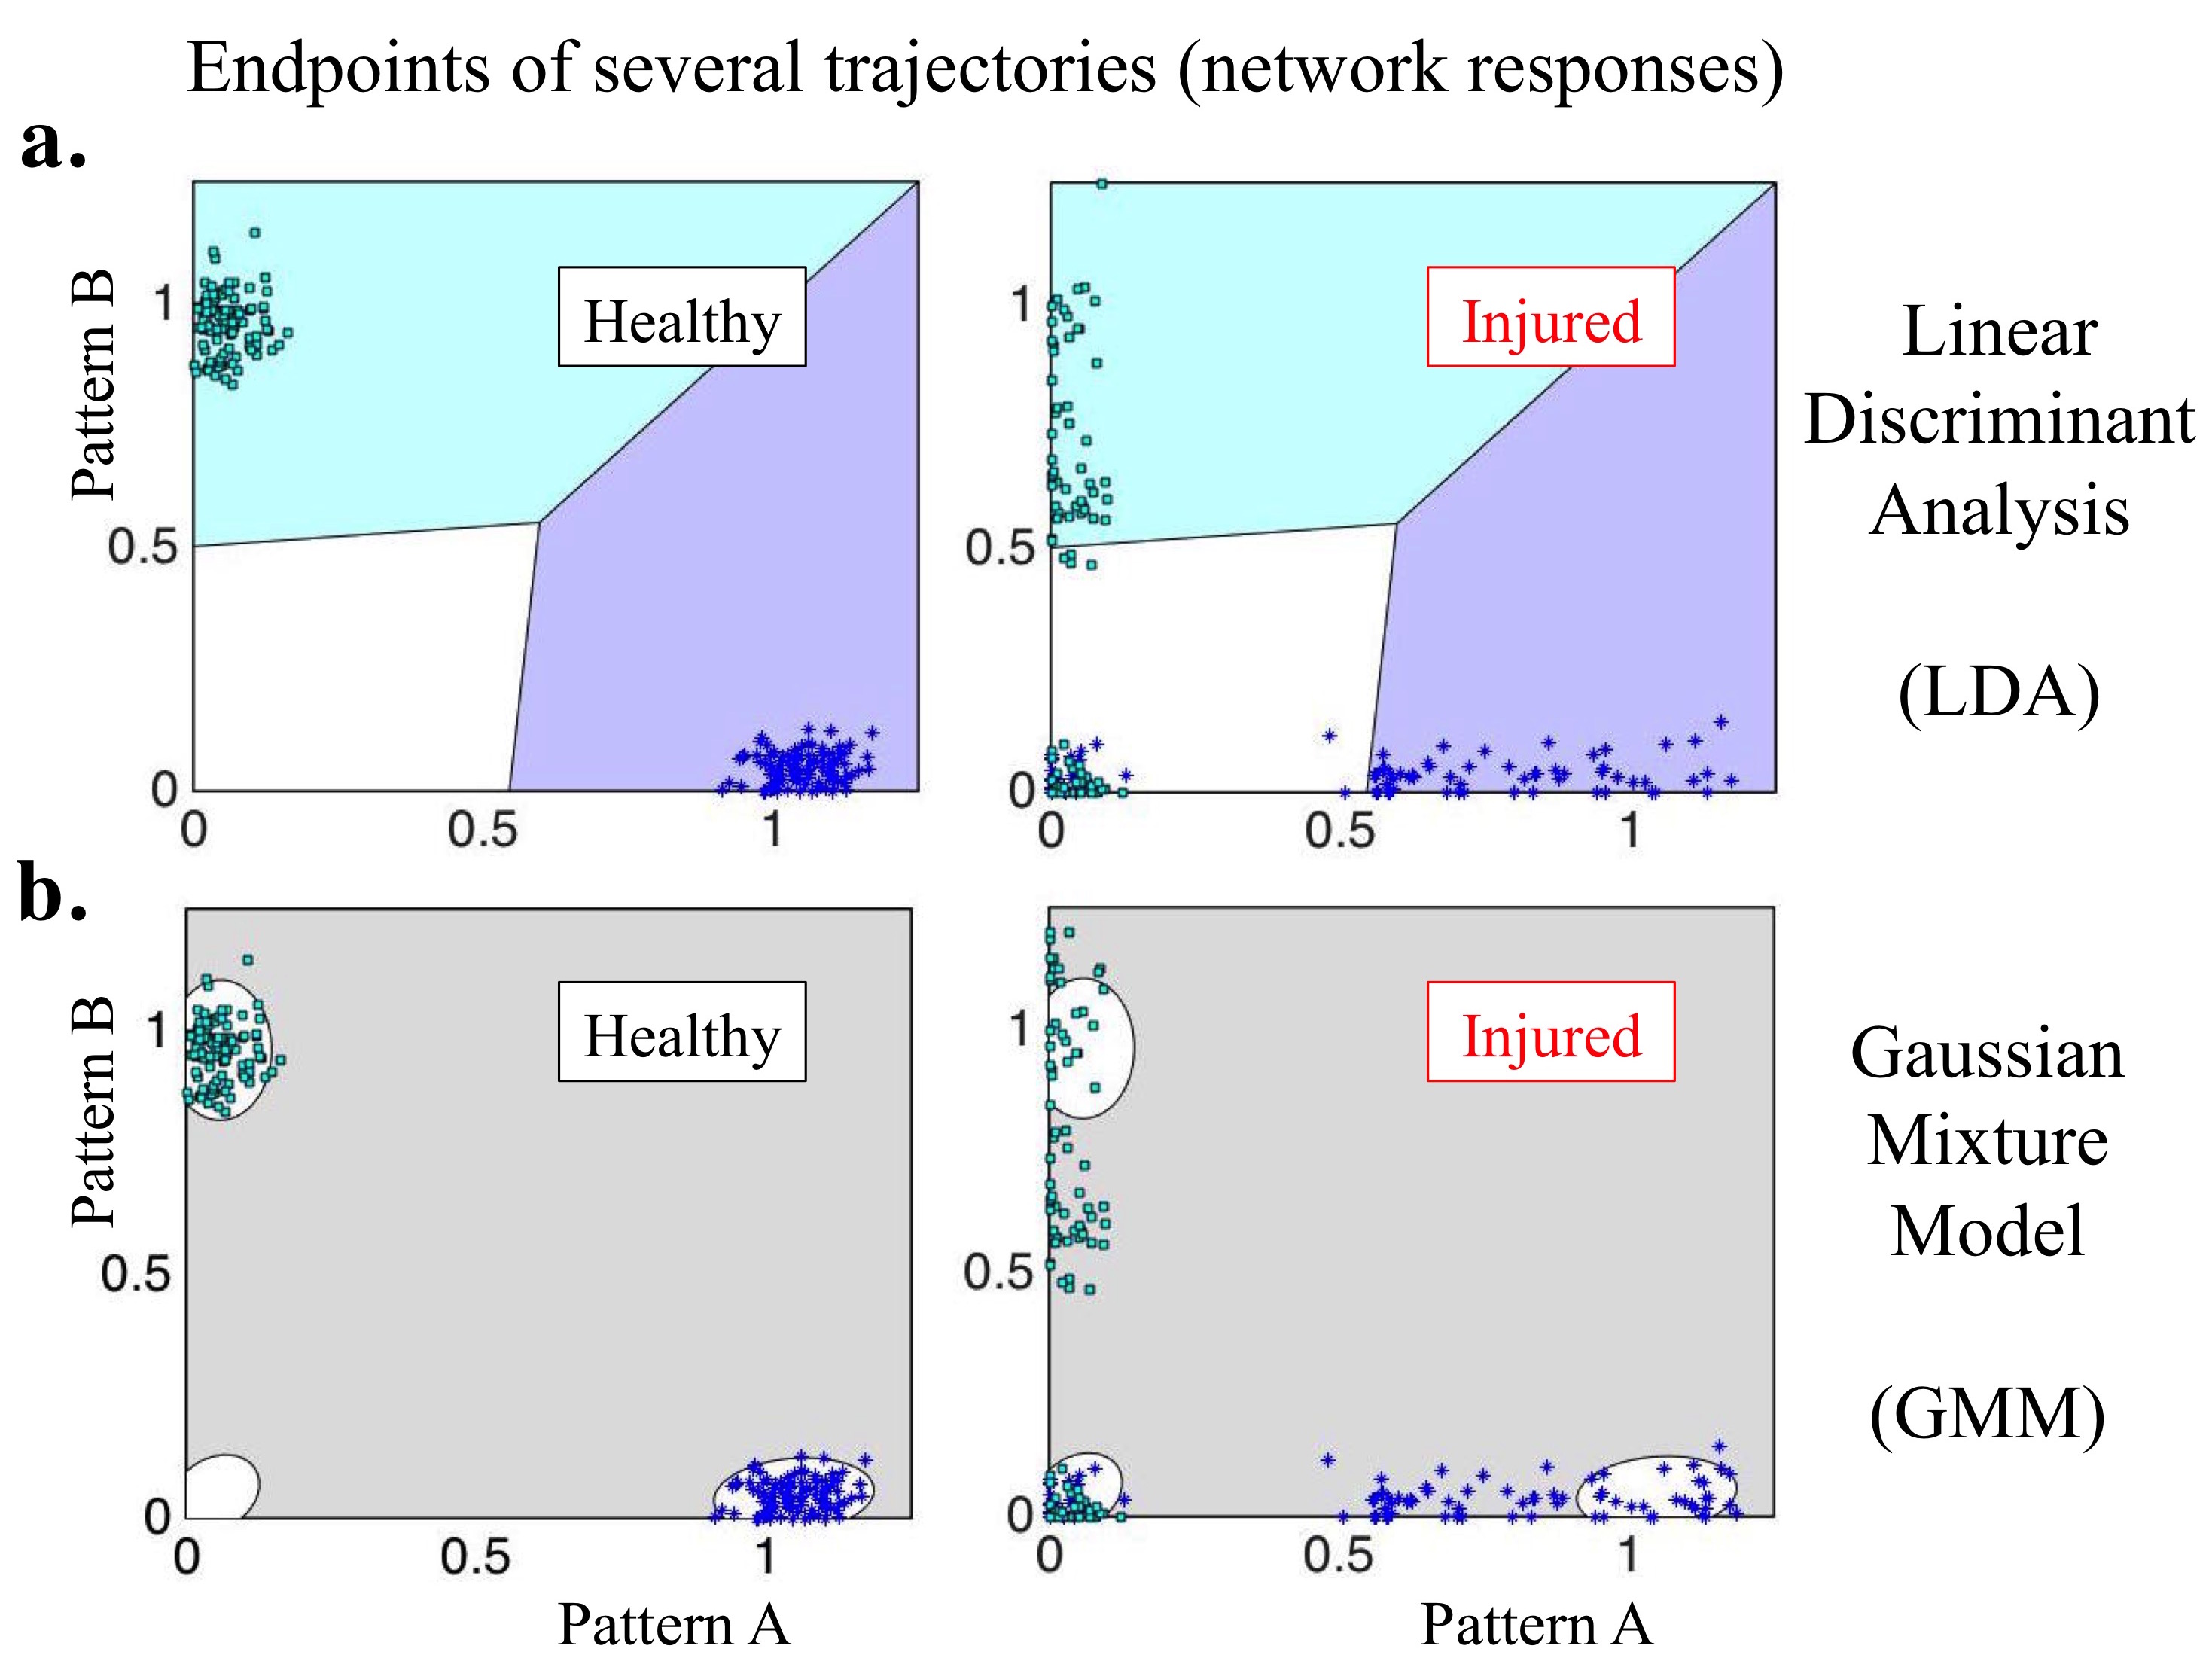
We showed that a healthy network responds to meaningful stimulus with a trajectory (projected in a proper low dimensional space) that ends near a fixed point of the system. This behavior can change significantly with injury; see Figures 5b and 6 for illustrative examples. In these cases, we randomly added FAS to 30% of the neurons in the network, with 10% leading to the filtering regime, 10% to reflection and 10% to the blockage regime. Note that the trajectories do not form clear clustering regions around the fixed points anymore. Instead, many trajectories end near the origin, which means that no stable response pattern (library element) was produced. We use two different criteria to define these clustering regions and quantify the number hindered/misclassified responses.
Linear Discriminant Analysis:
LDA is a method used in statistics, pattern recognition and machine learning to find a linear combination of features which separates two or more classes of objects or events. In our case, we use LDA to separate the network healthy/typical responses in three classes: A, B, and Resting State (when no stimulus is presented). We generate a training set for which the correct classification is known and find a good predictor for any sample with the same distribution (not from the training set so as to cross-validate the findings). This results in hyperplanes (lines in the 2D case) that yield maximum separation between distinct classes. See Figure 6a for an example of LDA classification; the dark blue region corresponds to , the light blue region to and the white region to the resting state. The left panel of Fig. 6a shows that many injured responses can cross the original separating lines, with most of them falling in the white region. The misclassification of a response to its corresponding stimulus can be quantified by a pair confusion matrices (before/after injury):
| (10) | |||
| (12) | |||
| (17) |
The confusion matrix associated with the injured network is significantly less diagonal than the one associated to the healthy network. This is a common feature across all injury distributions and will always lead to a relative loss of transmitted information Maia2014_2 .
Gaussian Mixture Model:
GMM refers to a probability density function represented as a weighted sum of Gaussian component densities and commonly used for data clustering. In our case, we use GMM to cluster the network responses in the same three distinct classes as before. The method uses an iterative algorithm and yields the best 3-Gaussian fit to our data. Computations were performed using the gmdistribution function from MATLAB’s Statistics Toolbox. Figure 6b shows that after injury, many trajectories do not end within the original ellipses (95% confidence interval for each gaussian component). The analogous confusion matrices (before and after injury), for the same example, are now given by:
| (22) | |||
| (24) | |||
| (29) |
The GMM criterium is stricter than the LDA criteria and significantly increases misclassification after injury. The relative loss of Transmitted Information (TI) in this case is equal to 83.96%, as opposed to a 53% loss given by the LDA criterium. We will discuss the loss of TI in more details in the following section.
4.2 Loss of transmitted information
The Transmitted Information (TI) in a system quantifies how much its responses (to different stimulus) are non-random. It is a quantity calculated from confusion matrices such as those from equations (10)–(29), and we refer to Maia2014_2 ; Victor1997 for a more detailed account of the topic. The matrix in (10) has perfect diagonal structure and exemplifies maximum TI. Since there are only three stimulus and response classes, we have in this case . Conversely, the matrix in (29) transmits very little information.
Intuitively, TI penalizes imperfect confusion matrices proportionally to the magnitude of their off-diagonal terms. The misclassification terms grow whenever the system responds to stimulus with a signal that is classified as from class (with ). For both classification criteria – LDA and GMM – the loss in TI after injury provides a natural metric for loss of cognitive functionality. Maia and Kutz Maia2014_2 provide TI decay rates for individual neurons injured with mild FAS. In this section, we provide analogous results, but at a collective network level and for different FAS distributions.
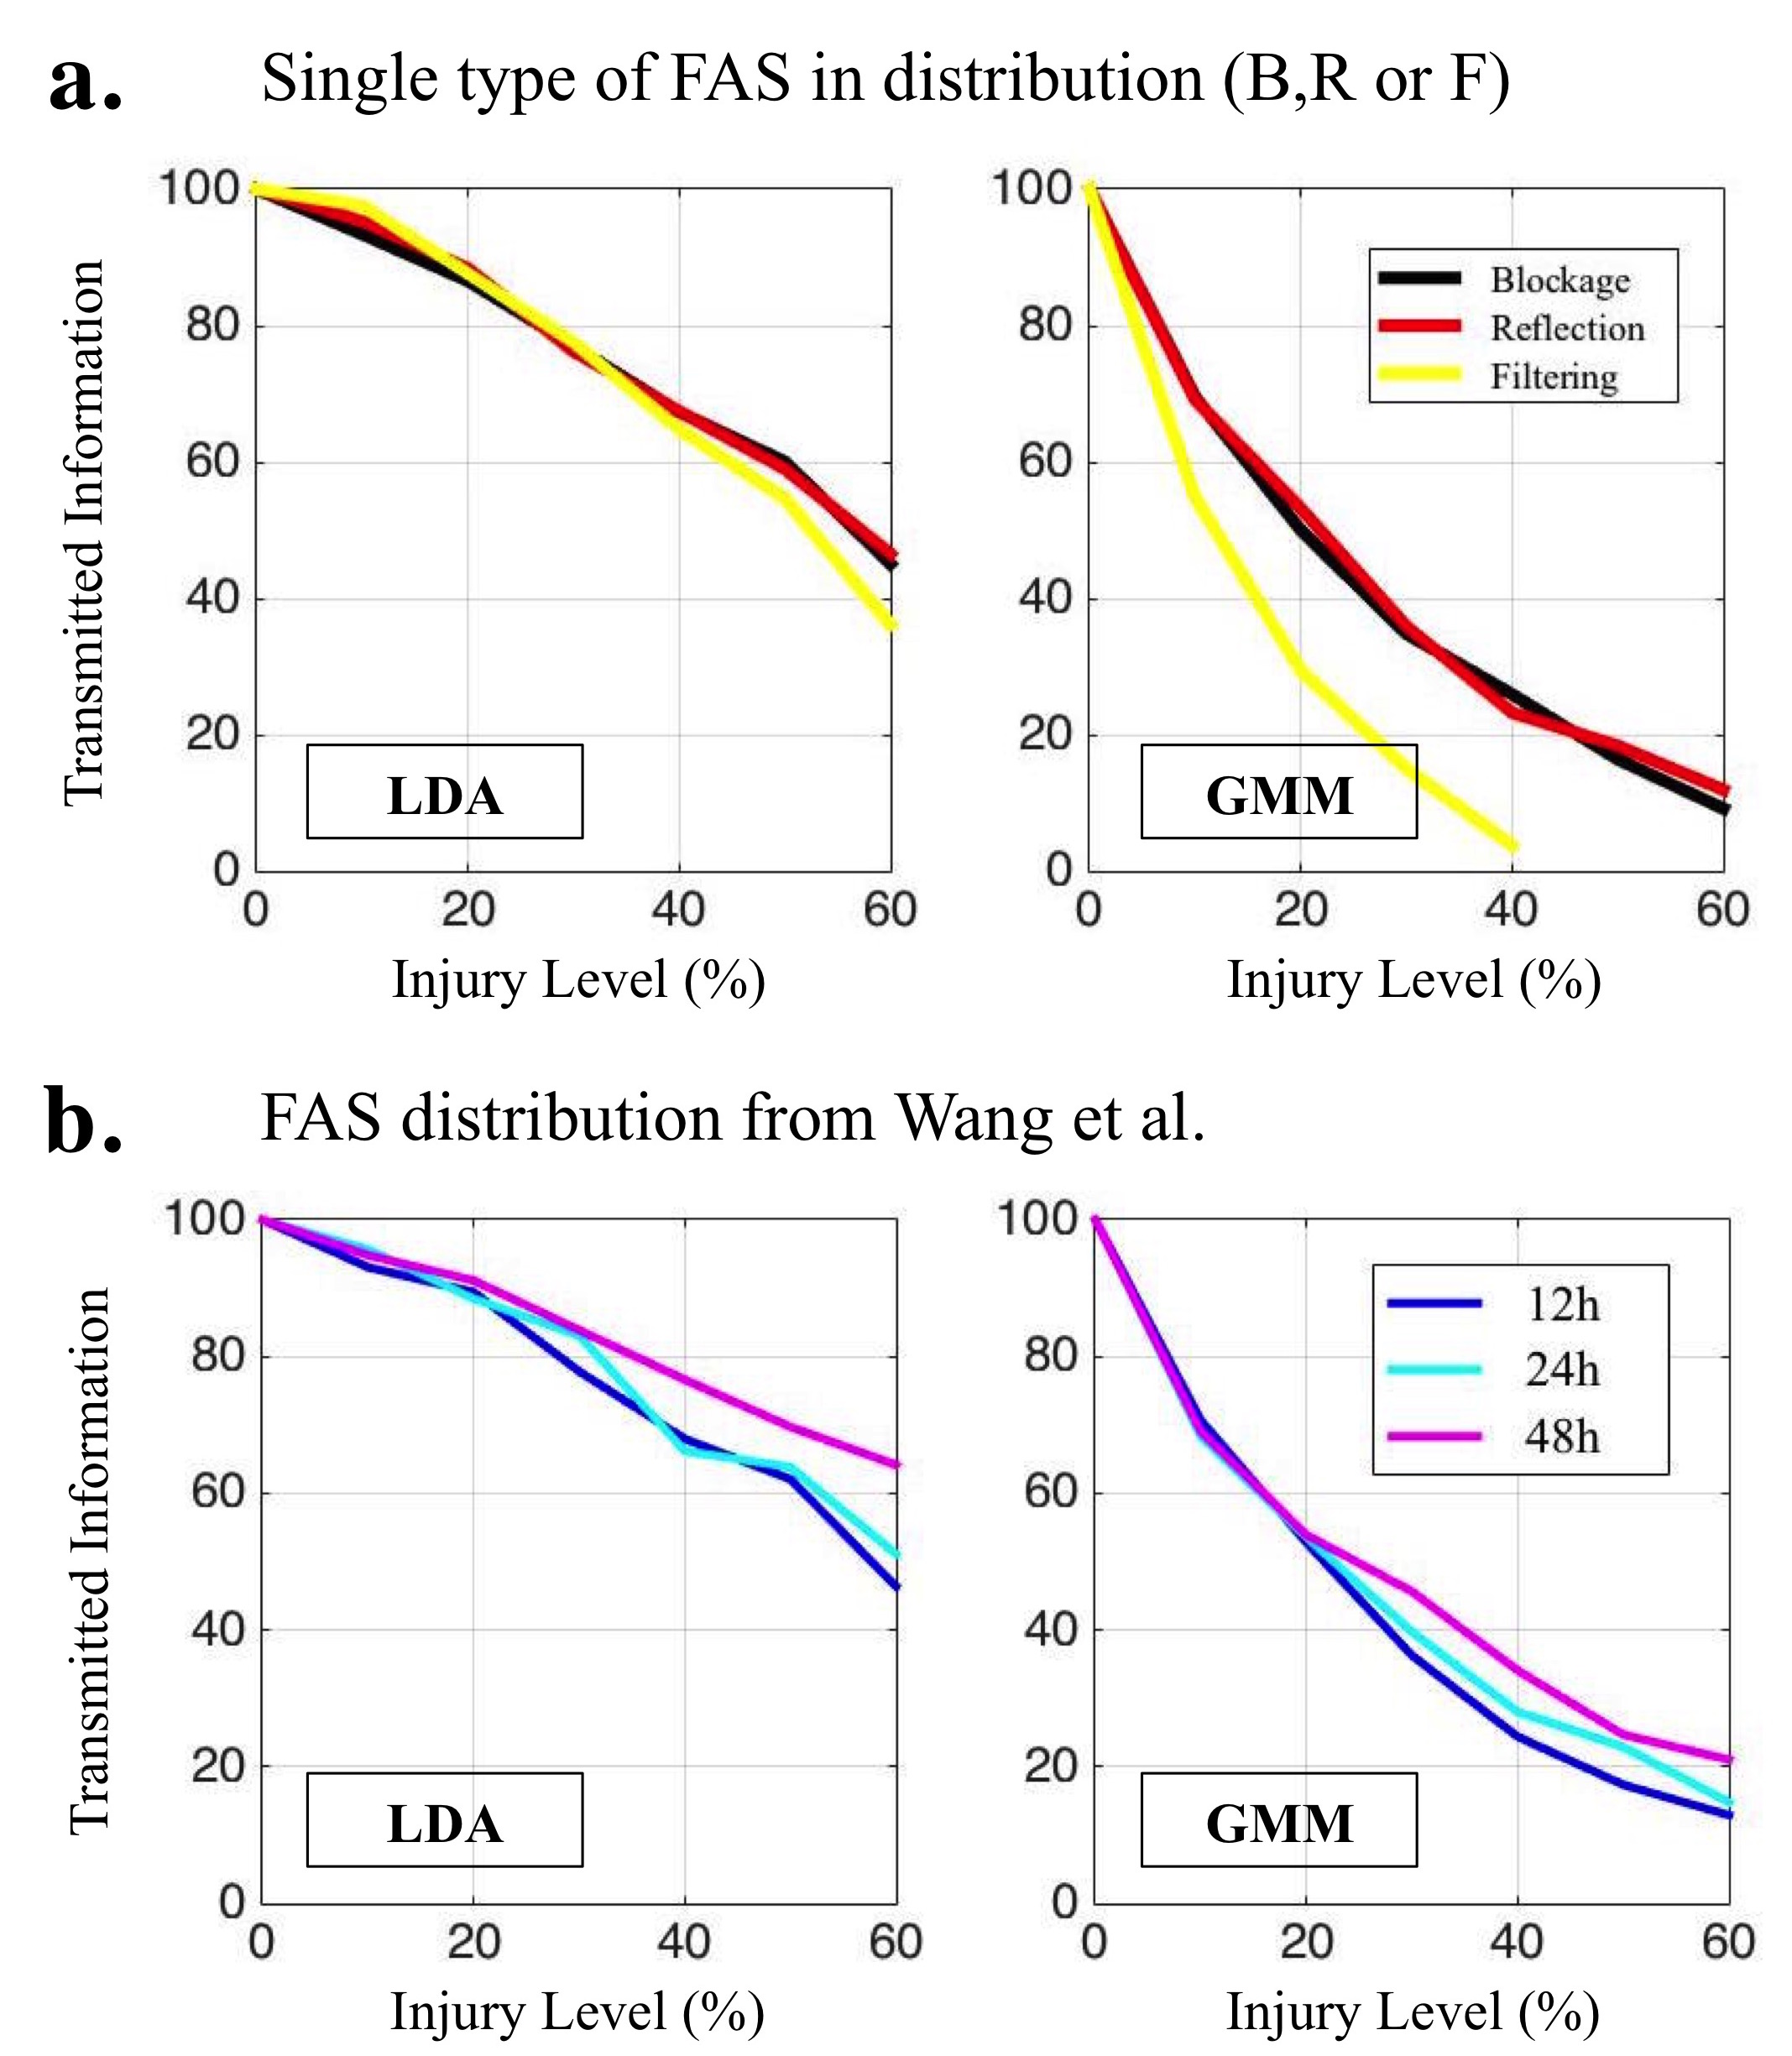
Homogeneous FAS distributions:
As discussed in sections 2–3, FAS following injury have a large variety of shapes and sizes, and consequently affect neuronal dynamics in different ways. As a first example, however, we consider homogeneous FAS distributions throughout the network, i.e., when all injured neurons have the same dysfunctional regime (filtering, reflection or blockage of spike trains). Figure 7a shows the decay of TI as a function of injured neurons (%) for all three regimes. For the GMM criterium, a homogeneous distributions of FAS in the filtering regime is more harmful than one in the blockage or in the reflection regimes. This result is surprising, since axons subject to the highest amount of damage typically exhibit FAS in the blockage regime (Maia2014_1 ). For the LDA criterium (left plot), the type of propagation regime does not seem to influence the loss of TI except for larger fractions of injured neurons. There again, the filtering regime is slightly worse than the others.
FAS distributions from Wang et al. Wang2011 :
In Figure 7b, we plot TI as a function of damaged neurons for the three heterogeneous distributions of FAS from Fig. 4c (pie charts). They correspond to FAS development up to 12h, 24h, and 48h after the TBI impact. For a small percentage of injured neurons, different heterogeneities did not significantly alter the decay of TI (for both LDA and GMM criteria). For larger fractions, however, the results show a clear improvement as the injury progressed in time, suggesting that recovering mechanisms might have played a role.
As a consistency check, we note that the heterogeneous distributions yield better results than the worst homogeneous distribution (filtering alone). Our heterogeneous FAS functional distributions were derived from indirect calculations (see section 3.1), and we hope that our results incentivize experimentalists to report more geometrical parameters for individual swellings. Nevertheless, we were able to illustrate novel methodologies to quantify the loss of functionality in injured networks in a biophysically plausible way.
4.3 Anomalous production of evidence
In what follows, we model a system with biologically plausible decision-making capabilities using the neuronal input/output network of the last section as its core generator of evidence. The network responds to incoherent external stimuli producing mixed pieces of evidence, which in turn, are coupled to an accumulation model that ultimately decides in favor of one choice (A vs B). We also show how the addition of FAS injuries to the network leads to a large variety of anomalies regarding production of evidence.
Mixed stimuli and coherence levels:
So far, we only applied constant inputs to the network; or . On the other hand, organisms are faced with many decisions where the evidence is noisy, mixed, or arrives intermittently over time Shadlen2007 . To account for more realistic scenarios, we will consider stimulus of the form
| (30) | |||
| (33) |
In simpler terms, the external input is a mixed train of and pulses, each with duration and starting times and respectively. We will refer to it as a Poisson mixed train of stimulus if the pulse initiation times and are generated by their (own, independent) Poisson process of intensity and respectively. It is relatively straightforward to adjust these intensities to achieve the desired coherence level, with denoting incoherent trains and denoting coherent ones. Such input stimulus is consistent with recent, biophysically relevant DM experiments Brunton2013 .
Healthy production of evidence:
The network’s response to a Poisson mixed train of stimulus can be thought as a series of simpler trajectories alternating between the vicinities of the fixed points and . We interpret these vicinities as Evidence-Producing Regions (EPR) for choices A and B, although their precise definition may vary according to the clustering classification criteria; for the LDA criterium, the EPR correspond to the (dark/light) blue colored regions, and for the GMM criterium, they correspond to the 95% confidence intervals (ellipses). Fig. 6 illustrates them clearly. Thus, when , the trajectory will spend, on average, more time in the EPR for A than in the EPR for B (and vice-versa when ).
To map the trajectory from a 2-dimensional PCA plane to a (1D, diffusion-to-boundary) decision-making framework, we set
| (34) |
where and denote the euclidian distances between the trajectory and the fixed points and respectively. With this definition, the evidence values for choices will be approximately since at the EPR for A and at the EPR for B. When the network is at rest, and whenever , the produced evidence will be small. See Figure 8a for a prototypical example and schematics. Notice that the EPR regions for choices A and B are mapped onto upper and lower rectangular bands respectively in the 1-dimensional plots.
We discuss bellow a few different type of anomalies regarding the production of evidence in injured networks. See Figure 8b–e for a tentative list of errors drawn from several injury levels and different FAS distributions.
Unbiased vs Biased errors:
Fig. 8b shows two examples of injured network responses that produce unbiased errors, i.e., where the produced evidence jeopardizes both choices with similar magnitude. In the first plot, the injured response (in red) is slightly attenuated but still follows the healthy response (in black) closely. This occurs both when the signal is moving upwards (towards the EPR for choice A) and moving downwards (towards the EPR for choice B). In the second plot, the injured signal is heavily mitigated and produces no evidence for either choice. This type of error contrasts with the ones depicted in Fig. 8c. For those plots, it is clear that one choice is significantly more penalized than the other. The upper plots in Fig. 8c still produce evidence for choice A (with different degrees of success), while the lower plots show analogous biases towards choice B.
Confusion in evidence production:
Fig. 8d depicts two examples of a less common but significantly more dramatic type of error. Notice that in the first highlighted box of Fig. 8d, the healthy signal is clearly in the EPR for choice B while the injured one is in the EPR for choice A. Thus, an injured network may not only fail to produce evidence to a given choice but instead, produces evidence for the opposite one. A similar effect occurs to a lesser degree on the second plot. We believe that this unprecedented confusion mechanism operating at the evidence production level can lead to critical decision-making deficits.
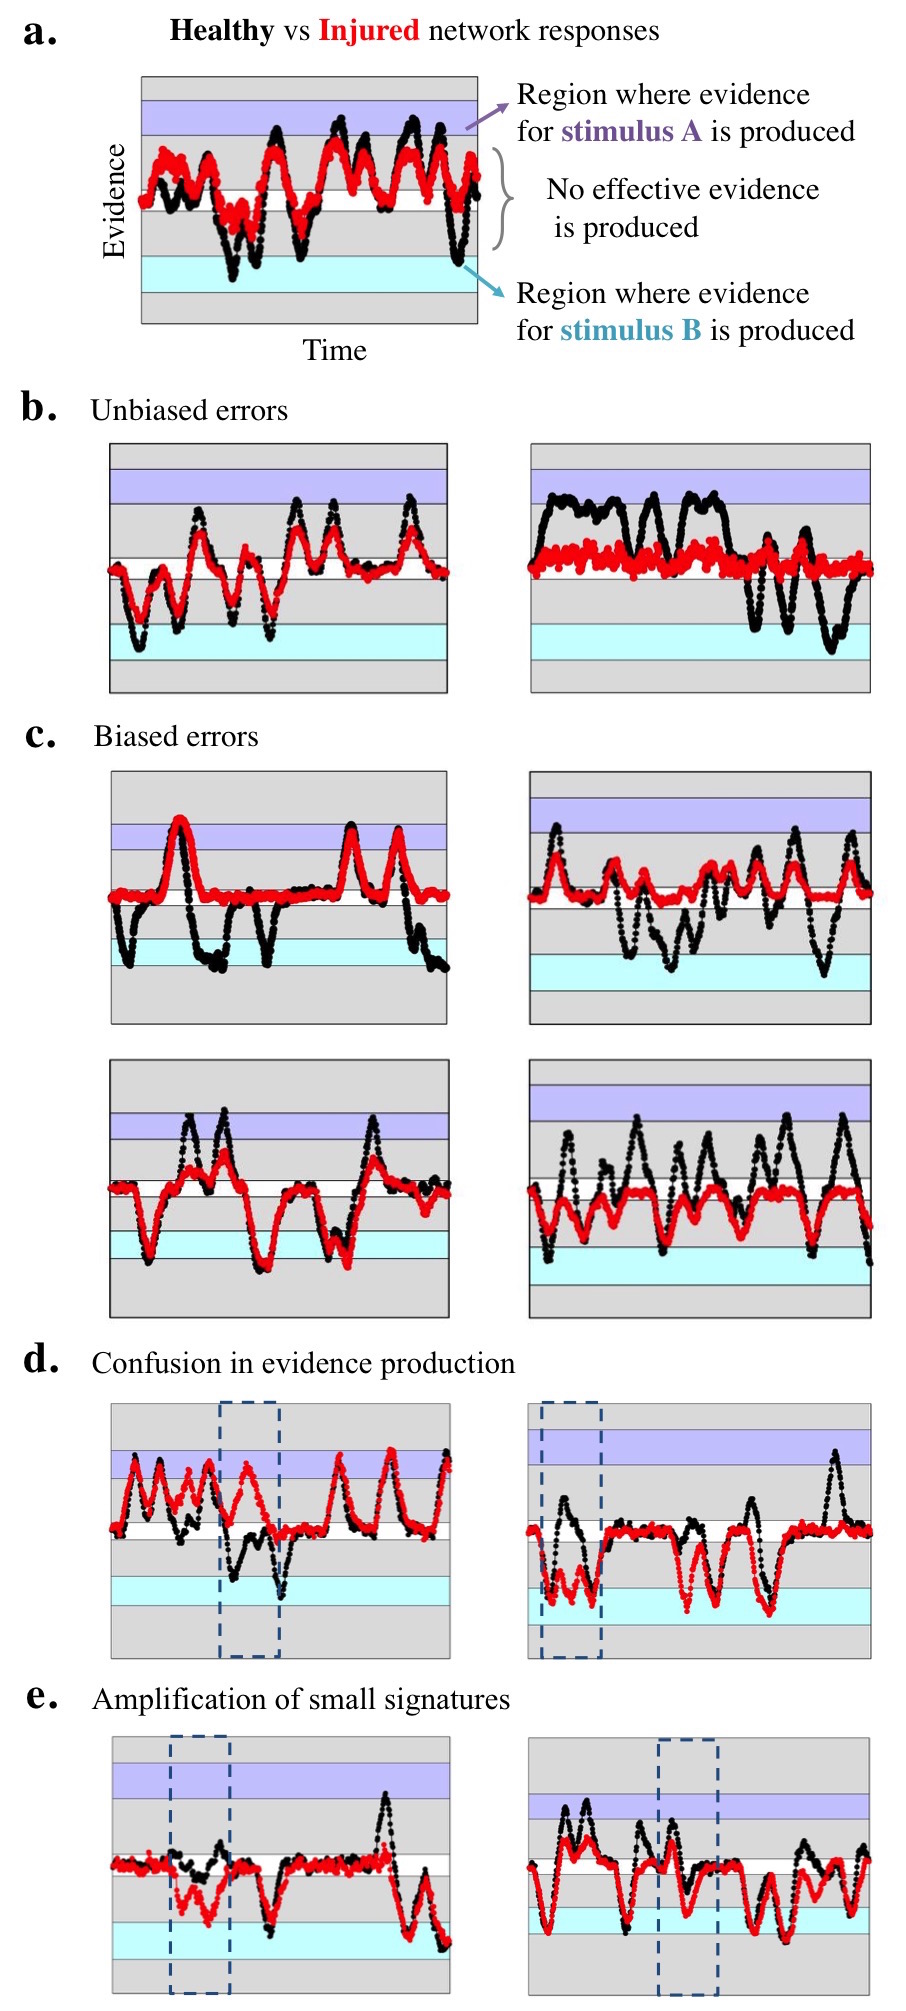

Amplification of small signatures:
In Fig. 8e, we show injured networks producing evidence when the original healthy network does not. By inspecting the two highlighted boxes, we conjecture that FAS injuries or noise mechanisms may amplify small fluctuations, creating non-existent pieces of evidence. This type of error occurs sometimes in conjunction with other ones, such as those in Panels b-c for example.
Figure 8 should not be regarded as a systematic catalogue of all possible types of errors regarding the anomalous production of evidence. Instead, our goal was to simply illustrate the rich variety of injured responses generated from random, biophysically motivated injuries applied to our simulations. Some anomalies, like those presented in Fig. 8d–e for example, are non-obvious, while the ones in Fig. 8b–c are more frequent. Our next step is to investigate the average effects of the anomalous production of evidence to the decision-making capabilities of the system. Indeed, the statistical appearance of these various evidence producing regimes are what drive compromised DM.
4.4 Impaired decision making and cognitive deficits
We now couple the network’s mixed responses to stimuli with an accumulation model that ultimately decides in favor of Choice or . Specifically, we assume (as in Shadlen et al. Shadlen2007 ) that a Decision Variable (DV) continuously integrates the produced evidence until a decision-boundary is reached. Then, the process is interrupted and the DV commits to that choice. When one of the alternatives dominates the mixed stimulus (high coherence level), the DV promptly reaches the correct decision boundary. For low coherence, the decision typically happens over a long period of time and is often incorrect.
The behavioral responses associated with different difficulty levels are well described by psychophysical curves, i.e., by regarding the system’s accuracy and reaction time as a function of the coherence level. See Shadlen2007 for an introductory exposition of the theme. In what follows, we present a series of simulations where FAS hinder the neuronal network activity. As suggested by the previous sections, the anomalous production of evidence leads to several deficits, but most importantly, to slower reaction times.
Homogeneous FAS distributions:
In Figure 9, we show psychophysical curves associated with injured networks in which all the FAS have the same functional type (filtering, reflection or blockage). The upper plots in Panel 9a show how the proportion of choices increases with the coherence level (for A). There is an accuracy deficit (shaded in gray) between the healthy system (in black) and the 10% injured system (in red) for all three cases. The type of FAS did not seem to strongly influence the results. The lower plots in Panel 9a show psychometric curves for reaction times as a function of the coherence level. These curves are naturally decreasing since a higher coherence level is associated with an easier task, and consequently, with faster decisions. Still, one can observe reaction time deficits across all homogeneous FAS distributions.
Panel 9b shows analogous plots for networks injured at a 20% level. In every plot, we average over 400 trials at 15 different coherence levels, from zero () to fully coherent (). We also randomize the neurons targeted with FAS and the external train of stimulus every turn. Overall, the impairments translate into less accurate and slower decision-making capabilities, although reaction time impairments are more pronounced at higher injury levels.
FAS distributions from Wang et al. Wang2011 :
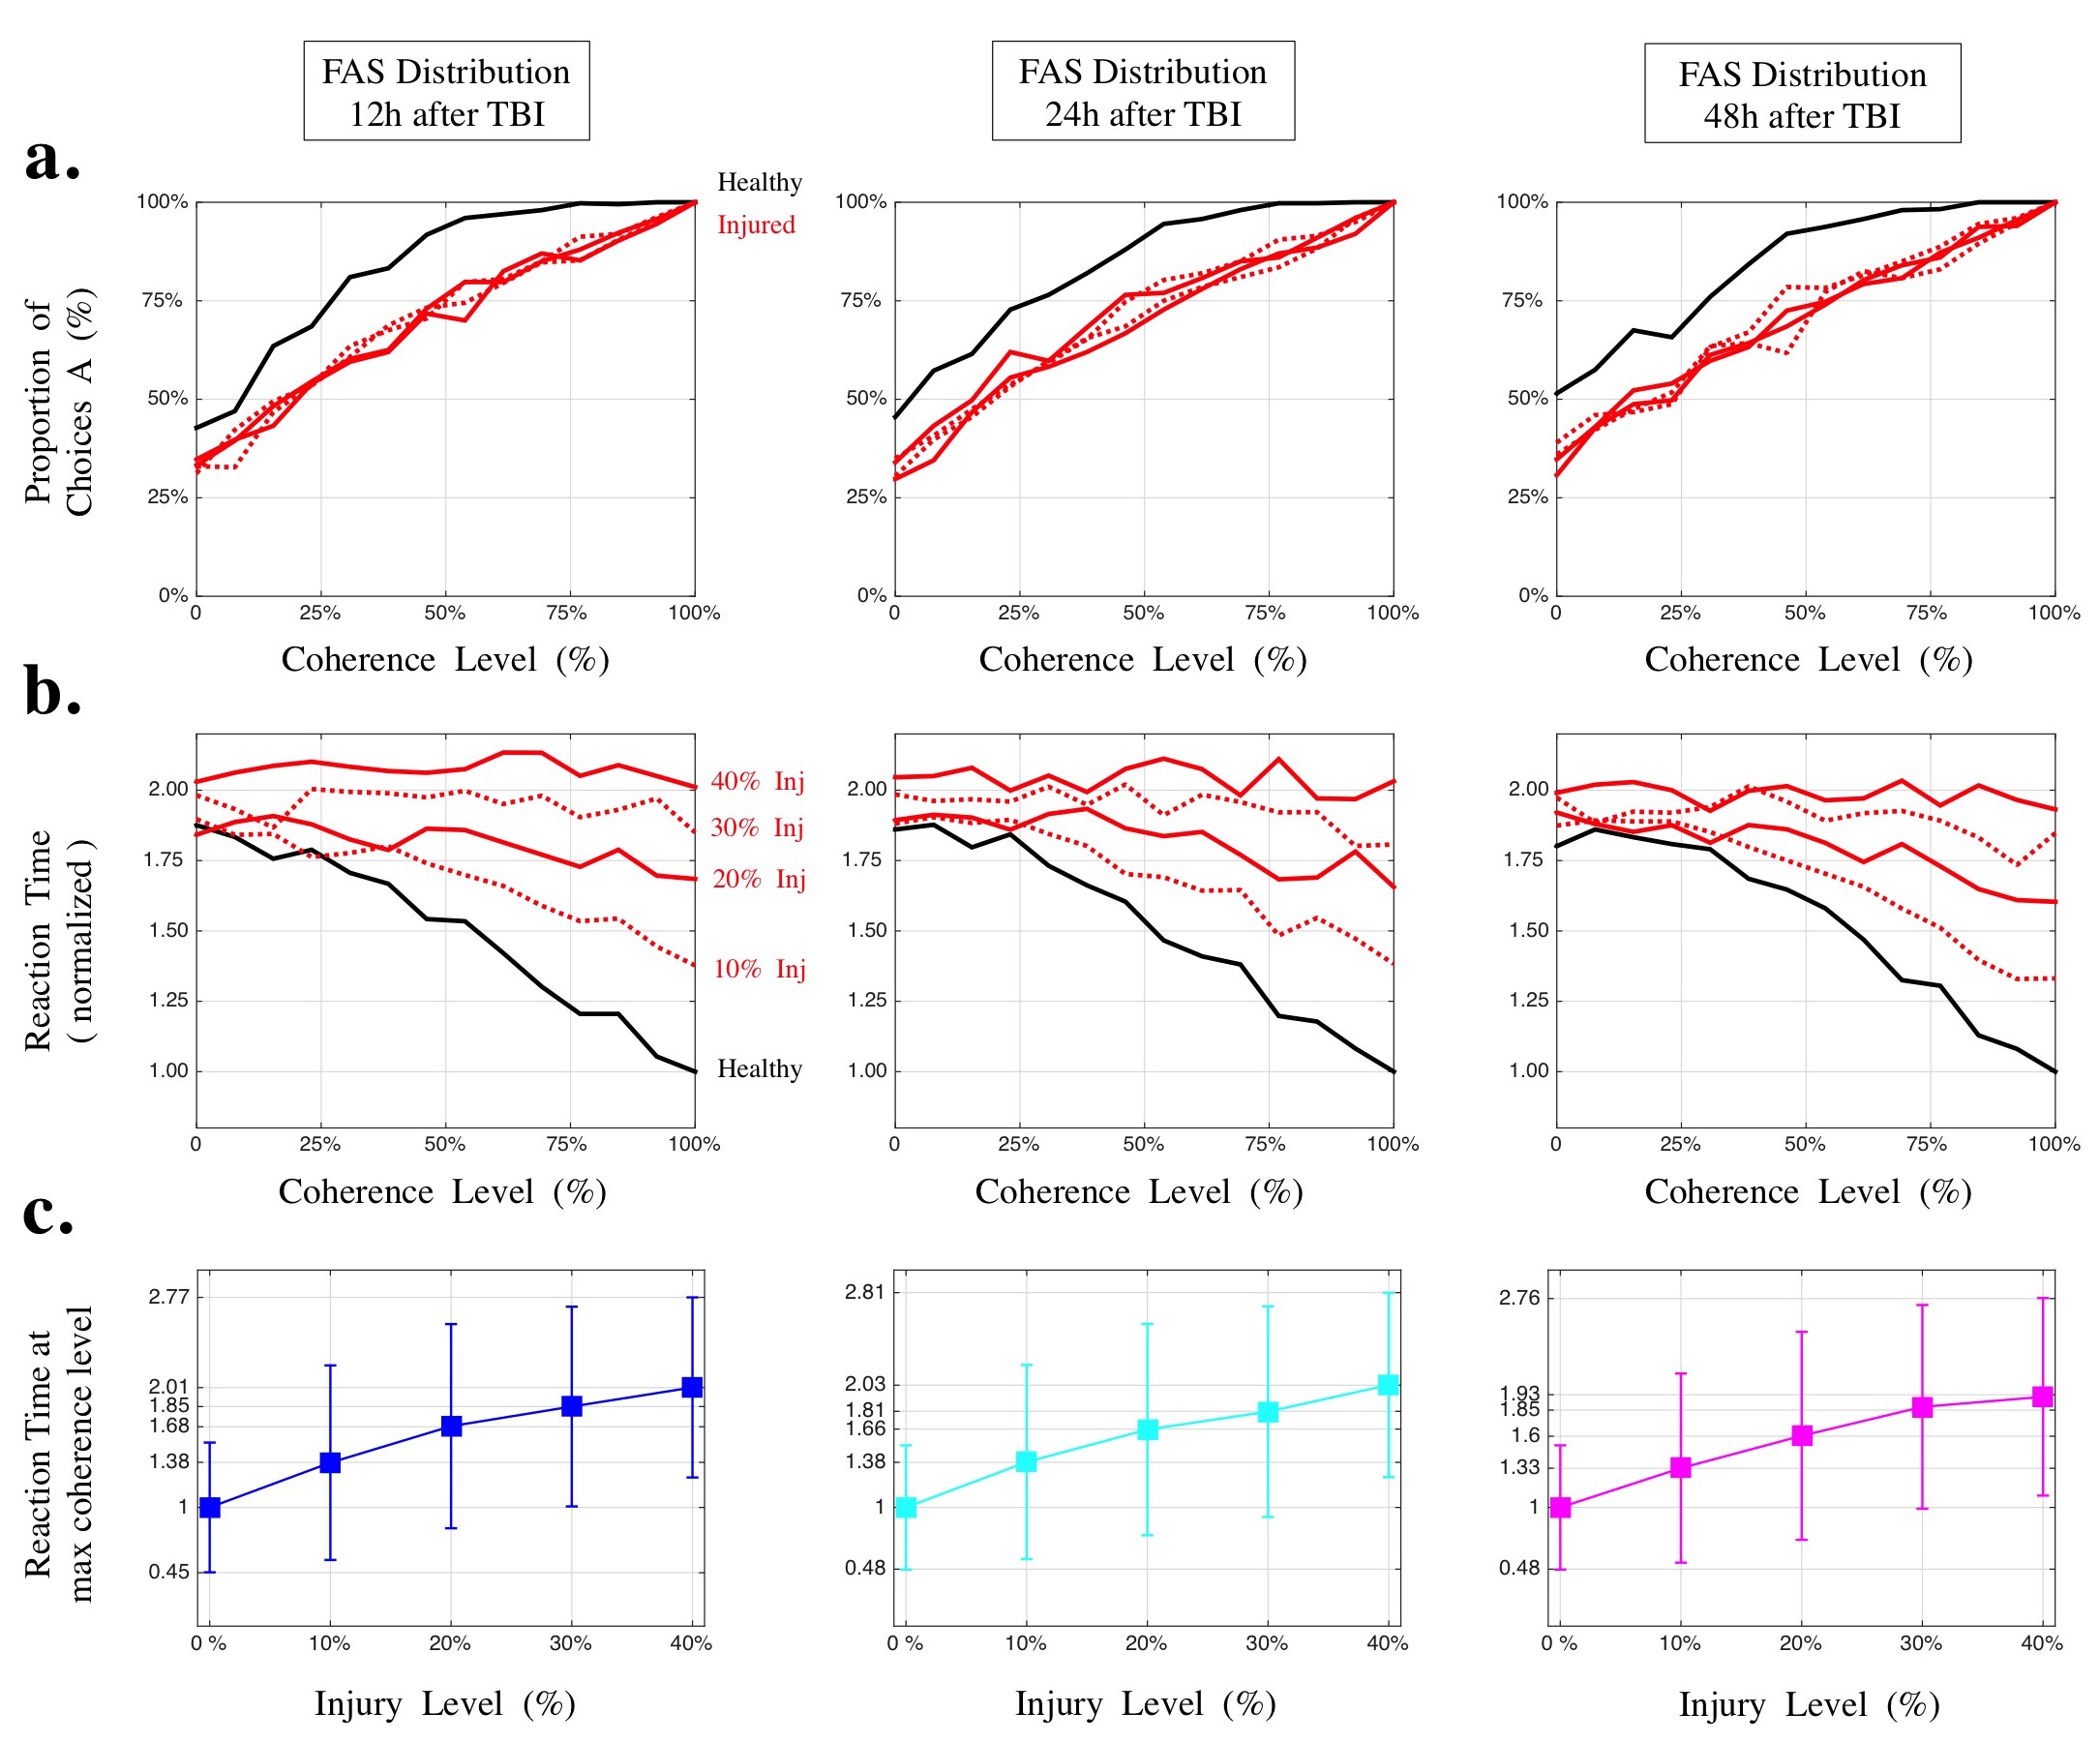
Figure 10 shows the central result of our set of simulations. The neuronal networks are now injured following the FAS distributions derived from the experimental results of Wang et al. Wang2011 . Each column corresponds to FAS development along the optic nerve of an adult rat at 12h, 24h, and 48h after TBI. See Section 3.1 and Fig. 4 for details. In Panel 10a we show how the proportion of choices increases with the coherence level (for A). Again, there is an accuracy deficit between the healthy responses (in black) and the injured ones (in red). The trends are similar for all three FAS distributions.
Reaction-time impairments and network diagnostics:
Panel 10b shows psychometric curves for the Reaction Times (RT). Within each plot, we see distinctive trends for different injury levels (10%, 20%, 30% and 40% of damaged neurons in the network). We normalized the RT using the healthy value at the maximum coherence level as a baseline (i.e., setting RT = 1 when ). The similarity between the trends across all three FAS distributions is staggering, suggesting that reaction time deficits increase with injury at a significant rate. Panel 10c and Table 2 show the RT ( 1 std.) at the maximum coherence level, where the separability between injury levels (%) is highest.
The compromised reaction times have profound translational implications, specifically because reaction times can be measured experimentally in a non-invasive fashion. Thus, if a TBI patient takes (on average) around two times longer to successfully make a simple decision, our results suggest that roughly 40% of the neurons in the network could have some form of FAS injury. More importantly, Table 2 could provide an indirect way to diagnose and calibrate FAS progression from clinically observed functional deficits.
| Inj. Level | 12h | 24h | 48h |
|---|---|---|---|
| 0 % | 1.00 .54 | 1.00 .52 | 1.00 .52 |
| 10 % | 1.37 .81 | 1.38 .81 | 1.33 .79 |
| 20 % | 1.68 .86 | 1.65 .89 | 1.60 .87 |
| 30 % | 1.85 .84 | 1.80 .88 | 1.84 .85 |
| 40 % | 2.01 .75 | 2.03 .77 | 1.93 .83 |
5 Discussion and Summary of Model
In this work, we develop a theoretical framework to quantify Decision-Making (DM) impairments following Traumatic Brain Injuries (TBI) and/or under the influence of neurodegenerative diseases. Specifically, we were able to link a cellular-level pathology named Focal Axonal Swellings (FAS) to network dysfunctions, to the anomalous production of evidence, and consequently, to DM impairments and cognitive deficits; see Fig. 1 for a simplified overview of our work. We introduced the key elements of our multi-scale model gradually throughout the paper, which we now summarize while revisiting Fig 2:
- (i)
-
(ii)
The core of the DM system is a neuronal network that responds to meaningful stimuli with robust population codes. In a proper low dimensional PCA space, input stimulus dynamically evolve the population codes fixed points associated with each stimulus. Due to stochastic fluctuations, trajectories fluctuate around the fixed points and produce evidence for that stimulus. See Fig. 5 for details.
-
(iii)
The network responds to mixed stimuli with a series of trajectories that alternate between the vicinities of the fixed points A and B – treated as Evidence-Producing-Regions (see Fig. 6). Equation 34 maps the trajectories to a 1D diffusion-to-boundary framework, and Fig. 8 has an analogous role to Panel 2C.
-
(iv)
The produced evidence is coupled to an accumulation model; as in Panel 2D, a decision variable continuously integrates evidence, and commits to a choice when it reaches a boundary associated to that alternative.
- (v)
In Section 2, we provide a comprehensive review of FAS, a key signature of TBI reported in almost every animal study or in vitro experiment. FAS are also present in Alzheimer’s disease, which is the most common type of dementia in the elderly population, and several other neural disorders such as Multiple Sclerosis and Parkinson’s disease. See Sec. 2 for a large list of references. The recent results of Maia and Kutz described several deleterious effects of FAS to spike propagation Maia2015 ; Maia2014_2 ; Maia2014_1 . In fact, they demonstrated that the morphology (shape) of a swelling plays a critical role and can lead to the filtering, reflection, and blockage of action potentials. See Fig. 3. In Sec. 3, we infer FAS distributions from the experimental work of Wang et al. Wang2011 and include them in our simulations, which led to a variety of novel results:
-
(i)
FAS hinders the network’s production of low-dimensional population codes from their associated stimulus. Several trajectories no longer reach the expected fixed points and fluctuate around them. See Figs. 5 and 6. Confusion matrices show that the system’s responses to meaningful stimuli become more random.
- (ii)
-
(iii)
Distortion of population codes leads to anomalous production of evidence. There is significant variability in this aspect; Fig. 8 shows examples of biased/unbiased errors, confusion (i.e., production of the wrong type of evidence), and amplification of (false) small signatures.
-
(iv)
The anomalous production of evidence leads to DM impairments, which are easily interpretable from psychophysical curves for accuracy and speed. See Figs. 9 and 10. We observe distinctive trends for reaction time impairments as a function of the injury level, which could lead to novel FAS diagnostics in vivo.
Overall, we provided an innovative translational approach to bridge the large body of FAS literature with the state of the art computational modeling of network dynamics and decision-making. The study of biologically-plausible FAS injuries and their pathological effects in computational neuroscience is still in its infancy. Nevertheless, it is a direction for future research that could bring important insights to our understanding of traumatic brain injuries and several neurodegenerative diseases.
6 Outlook
A central finding of this work concerns reaction time impairments in DM networks. This result has significant translational value to practitioners since it can be measured in practice. As such, the outlook of this work has two distinct applications, one for neurodegenerative diseases and a second for TBI. They are characterized in what follows.
6.1 Neurodegeneration and disease progression
Unlike TBI, which has substantial experimental evidence supporting the potential reduction in FAS over time in a neuronal network, neurodegenerative diseases are progressive over time and simply continue to destroy neurons in the network. In addition to attempts to arrest the spread of the disease, assessment of its progression over time is critical. The findings here suggest that patients with neurodegenerative diseases can be given simple cognitive and/or motor tests, for instance, on tablet computers, to assess their reaction times. By monitoring their increasing reaction times to such tests, a readily interpretable framework can be used to assess the damage level, or spread of FAS, in the neuronal network. The assessment is non-invasive, and can help determine the rate of progression of the disease so that personalized treatments can be made for patients with rapid or slow spread of disease.
In addition, the tests are predictive and can be used to potentially predict the loss of key cognitive and motor functions, especially when considering the course of disease spread through various brain regions and along the spinal cord. Of course, continued behavioral and cognitive testing would be required to produce this level of diagnostic, but the theoretical framework developed here provides a mathematical architecture that can potentially help inform such predictive pathways for deterioration of cognitive and motor function.
6.2 TBI and concussion metrics
The Glasgow Coma Scale (GCS) is a common test used by First Aid responders to assess the level of consciousness of a person after head injury. It is composed of three parts (eye, verbal and motor), where the individual values (from 1 to 5) are recorded and summed. The lowest summed score (GCS = 3) corresponds to deep coma or death, while the highest score (GCS = 15) corresponds to a fully awake person. The brain injury is then classified as severe (9 or less), moderate (9-12) or minor (13 and higher).
Unfortunately, many contact-sport practitioners experience mild TBI (or concussions) that are rarely or only vaguely examined by the time they occur. To make matters worse, our results suggest that even a highly injured neuronal network could still produce somewhat accurate responses to simple tasks. This feature could easily mislead the hasty medical examinations given to athletes during (or after) a match. Our main results (Fig. 10 and Table 2) indicate that we should instead, focus on reaction time deficits even when correct answers are given. Thus, we recommend that athletes complete an array of quick, tablet-based games before matches to use as a baseline for normal reaction times. Once a potential head injury occurs, they would perform those same tasks and have a software compare their performance. The software should have an ample selection of games to overcome the large variability of impairments that could occur on a single decision-making task.
References
- (1) Adalbert, R., Nogradi, A., Babetto, E., Janeckova, L., Walker, S.A., Kerschensteiner, M., Misgeld, T., Coleman, M.P.: Severely dystrophic axons at amyloid plaques remain continuous and connected to viable cell bodies. BRAIN 132, 402–416 (2009)
- (2) Adams, J.H., Jennett, B., Murray, L.S., Teasdale, G.M., Gennarelli, T.A., Graham, D.I.: Neuropathological findings in disabled survivors of a head injury. Journal of Neurotrauma 28, 701–709 (2011)
- (3) Adle-Biassette, H., Chretien, F., Wingertsmann, L., Hery, C., Ereau, T., Scaravilli, F., Tardieu, M., Gray, F.: Neuronal apoptosis does not correlate with dementia in hiv infection but is related to microglial activation and axonal damage. Neuropathology and Applied Neurobiology 25, 123–133 (1999)
- (4) Barnes, D.E., Kaup, A., Kirby, K., Byers, A.L., R.Diaz-Arrastia, Yaffe, K.: Traumatic brain injury and risk of dementia in older veterans. Neurology 83, 312–319 (2014)
- (5) Blumbergs, P., Scott, G., Manavis, J., Wainwright, H., Simpson, D., McLean, A.: Topography of axonal injury as defined by amyloid precursor protein and the sector scoring method in mild and severe closed head injury. Journal of Neurotrauma 12, 565–572 (1995)
- (6) Bogacz, R., Brown, E., Moehlis, J., Holmes, P., Cohen, J.D.: The physics of optimal decision making: A formal analysis of models of performance in two-alternative forced-choice tasks. Psychological Review 113(4), 700–765 (2006)
- (7) Brette, R., Rudolph, M., Carnevale, T., Hines, M., Beeman, D., Bower, J.M., Diesmann, M., Morrison, A., Goodman, P.H., Jr., F.C.H., Zirpe, M., Natschl ger, T., Pecevski, D., Ermentrout, B., Djurfeldt, M., Lansner, A., Rochel, O., Vieville, T., Muller, E., Davison, A.P., Boustani, S.E., Destexhe, A.: Simulation of networks of spiking neurons: A review of tools and strategies. Journal of Computational Neuroscience 23(3), 349–398 (2007)
- (8) Browne, K.D., Chen, X.H., Meaney, D.F., Smith, D.H.: Mild traumatic brain injury and diffuse axonal injury in swine. Journal of Neurotrauma 28(9), 1747–1755 (2011)
- (9) Brunton, B.W., Botvinick, M.M., Brody, C.D.: Rats and humans can optimally accumulate evidence for decision-making. Science 340, 95–98 (2013)
- (10) Chen, Y.C., Smith, D.H., Meaney, D.: In-vitro approaches for studying blast-induced traumatic brain injury. Journal of Neurotrauma 26(6), 861–876 (2009)
- (11) Christman, C., Grady, M., Walker, S., Hol-Loway, K., Povlishock, J.: Ultra-structural studies of diffuse axonal injury in humans. Journal of Neurotrauma 11, 173–186 (1994)
- (12) Coleman, M.: Axon degeneration mechanisms: commonality amid diversity. Nature Reviews Neuroscience 6(11), 889–898 (2005)
- (13) Daianu, M., Jacobs, R.E., Town, T., Thompson, P.M.: Axonal diameter and density estimated with 7-tesla hybrid diffusion imaging in transgenic alzheimer rats. SPIE Proceedings 9784, 1–6 (2016)
- (14) Dayan, P., Abbot, L.: Theoretical neuroscience. MIT Press (2001)
- (15) Dikranian, K., Cohen, R., Donald, C.M., Pan, Y., Brakefield, D., Bayly, P., Parsadanian, A.: Mild traumatic brain injury to the infant mouse causes robust white matter axonal degeneration which precedes apoptotic death of cortical and thalamic neurons. Experimental Neurology 211, 551–560 (2008)
- (16) Ditterich, J.: Stochastic models of decisions about motion direction: Behavior and physiology. Neural Networks 19, 981–1012 (2006)
- (17) Edlow, B.L., Copen, W.A., Izzy, S., van der Kouwe, A., Glenn, M.B., Greenberg, S.M., Greer, D.M., Wu, O.: Longitudinal diffusion tensor imaging detects recovery of fractional anisotropy within traumatic axonal injury lesions. Neurocritical Care 24(3), 342–352 (2016)
- (18) Fainaru-Wada, M., Fainaru, S.: League of denial: The nfl, concussions, and the battle for truth. Crown Archetype (2013)
- (19) Faul, M., Xu, L., Wald, M.M., Coronado, V.G.: Traumatic brain injury in the united states: emergency department visits, hospitalizations, and deaths. Atlanta (GA): Centers for Disease Control and Prevention, National Center for Injury Prevention and Control (2010)
- (20) Fayanz, I., Tator, C.H.: Modeling axonal injury in vitro: injury and regeneration following acute neuritic trauma. Journal of Neuroscience Methods 102, 69–79 (2000)
- (21) Friese, M.A., Schattling, B., Fugger, L.: Mechanisms of neurodegeneration and axonal dysfunction in multiple sclerosis. Nature Reviews Neurology 10, 225–238 (2014)
- (22) Galvin, J.E., Uryu, K., Lee, V.M., Trojanowski, J.Q.: Axon pathology in parkinson s disease and lewy body dementia hippocampus contains -, -, and -synuclein. Proceedings of National Academy of Science 96, 13,450–13,455 (1999)
- (23) Grady, M., Mclaughlin, M., Christman, C., Valadaka, A., Flinger, C., Povlishock, J.: The use of antibodies against neurofilament subunits for the detection of diffuse axonal injury in humans. Journal of Neuropathology and Experimental Neurology 52, 143–152 (1993)
- (24) Gupta, R., Sen, N.: Traumatic brain injury: a risk factor for neurodegenerative diseases. Reviews in the Neurosciences 27(1), 93?100 (2016)
- (25) Hanell, A., Greer, J.E., McGinn, M.J., Povlishock, J.T.: Traumatic brain injury?induced axonal phenotypes react differently to treatment. Acta Neuropathologica 129, 317–332 (2015)
- (26) Hay, J., Johnson, V.E., Smith, D.H., Stewart, W.: Chronic traumatic encephalopathy: the neuropathological legacy of traumatic brain injury. Annual Review of Pathology: Mechanisms of Disease 11, 21–45 (2016)
- (27) Hellman, A.N., Vahidi, B., Kim, H.J., Mismar, W., Steward, O., Jeonde, N.L., Venugopalan, V.: Examination of axonal injury and regeneration in micropatterned neuronal culture using pulsed laser microbeam dissection. Lab on a Chip 16, 2083 2092 (2010)
- (28) Hemphill, M., Dabiri, B., Gabriele, S., Kerscher, L., Franck, C., Goss, J., Alford, P., Parker, K.: A possible role for integrin signaling in diffuse axonal injury. PLos ONE 6(7), e22,899 (2011)
- (29) Hemphill, M., Dauth, S., Yu, C.J., Dabiri, B., Parker, K.: Traumatic brain injury and the neuronal microenvironment: A potential role for neuropathological mechanotransduction. Neuron 86(6), 1177–1192 (2015)
- (30) Henninger, N., Bouley, J., Sikoglu, E.M., An, J., Moore, C.M., King, J.A., Bowser, R., Freeman, M.R., Jr, R.H.B.: Attenuated traumatic axonal injury and improved functional outcome after traumatic brain injury in mice lacking sarm1. BRAIN pp. 1–12 (2016)
- (31) Herwerth, M., Kalluri, S.R., Srivastava, R., Kleele, T., Kenet, S., Illes, Z., Merkler, D., Bennett, J.L., Misgeld, T., Hemmer, B.: In vivo imaging reveals rapid astrocyte depletion and axon damage in a model of neuromyelitis optica-related pathology. Annals of Neurology 79, 794–805 (2016)
- (32) Higham, D.: An algorithmic introduction to numerical simulation of stochastic differential equations. SIAM Review 43(3), 525 (546)
- (33) Hill, C.S., Coleman, M.P., Menon, D.K.: Traumatic axonal injury: mechanisms and translational opportunities. Trends in Neuroscience 39(5), 311–324 (2016)
- (34) Ikonomovic, M.D., Uryu, K., Abrahamson, E.E., Ciallella, J.R., Trojanowski, J.Q., Lee, V.M.Y., Clark, R.S., Marione, D.W., Wisniewski, S.R., DeKosky, S.T.: Alzheimer?s pathology in human temporal cortex surgically excised after severe brain injury. Experimental Neurology 190, 192–203 (2004)
- (35) Johnson, V.E., Stewart, W., Smith, D.H.: Traumatic brain injury and amyloid- pathology: a link to alzheimer’s disease? Nature Reviews Neuroscience 11, 361–370 (2010)
- (36) Johnson, V.E., Stewart, W., Smith, D.H.: Widespread tau and amyloid-beta pathology many years after a single traumatic brain injury in humans. Brain Pathology 22, 142–149 (2012)
- (37) Johnson, V.E., Stewart, W., Smith, D.H.: Axonal pathology in traumatic brain injury. Experimental Neurology 246, 35–43 (2013)
- (38) Jones, L., Fontanini, A., Sadacca, B., Miller, P., Katz, D.: Natural stimuli evoke dynamic sequences of states in sensory cortical ensembles. Proc. Natl. Acad. Sci. USA 104, 18,772–18,777 (2007)
- (39) Jorge, R.E., Acion, L., White, T., Tordesillas-Gutierrez, D., Pierson, R., Crespo-Facorro, B., Magnotta, V.: White matter abnormalities in veterans with mild traumatic brain injury. American Journal of Psychiatry 169(12), 1284–1291 (2012)
- (40) Jorm, A.F., Jolley, D.: The incidence of dementia: a meta analysis. Neurology 51, 728–733 (1998)
- (41) Karlsson, P., Haroutounian, S., Polydefkis, M., Nyengaard, J.R., Jensen, T.S.: Structural and functional characterization of nerve fibres in polyneuropathy and healthy subjects. Scandinavian Journal of Pain 10, 28–35 (2016)
- (42) Kinnunen, K.M., Greenwood, R., Powell, J.H., Leech, R., Hawkins, P.C., Bonnelle, V., Patel, M.C., Counsell, S.J., Sharp, D.J.: White matter damage and cognitive impairment after traumatic brain injury. Brain pp. 1–15 (2010)
- (43) Kolaric, K.V., Thomson, G., Edgar, J.M., Brown, A.M.: Focal axonal swellings and associated ultrastructural changes attenuate conduction velocity in central nervous system axons: a computer modeling study. Physiological reports 1(3), e00,059 (2013)
- (44) Krstic, D., Knuesel, I.: Deciphering the mechanism underlying late-onset alzheimer disease. Nature Reviews Neuroscience 9(1), 25–34 (2012)
- (45) Lachance, M., Longtin, A., Morris, C.E., Yu, N., Jo s, B.: Stimulation-induced ectopicity and propagation windows in model damaged axons. Journal of Computational Neuroscience 37, 523–531 (2014)
- (46) Laukka, J.J., Kamholz, J., Bessert, D.: Novel pathologic findings in patients with pelizaeus-merzbacher disease. Neuroscience Letters (2016)
- (47) Lauria, G., Morbin, M., Lombardi, R., Borgna, M., Mazzoleni, G., Sghirlanzoni, A., Pareyson, D.: Axonal swellings predict the degeneration of epidermal nerve fibers in painful neuropathies. Neurology 61, 631–636 (2003)
- (48) Liberski, P.P., Budka, H.: Neuroaxonal pathology in creutzfeldt-jakob disease. Acta Neuropathology 97, 329–334 (1999)
- (49) LoBue, C., Denney, D., Hynan, L.S., Rossetti, H.C., Lacritz, L.H., Jr., J.H., Womack, K.B., Woon, F.L., Cullum, C.M.: Self-reported traumatic brain injury and mild cognitive impairment: increased risk and earlier age of diagnosis. Journal of Alzheimer?s Disease 51, 727–736 (2016)
- (50) Louis, E.D., Faust, P.L., Vonsattel, J., Honig, L.S., Rajput, A., Rajput, A., Pahwa, R., Lyons, K.E., Ross, G.W., Elble, R.J., Erickson-Davis, C., Moskowitz, C.B., Lawton, A.: Torpedoes in parkinson?s disease, alzheimer?s disease, essential tremor, and control brains. Movement Disorders 24(11), 1600–1605 (2009)
- (51) Magdesian, M.H., Lopez-Ayon, G.M., Mori, M., Boudreau, D., Goulet-Hanssens, A., Sanz, R., Miyahara, Y., Barrett, C.J., Fournier, A.E., Koninck, Y.D., Grütter, P.: Rapid mechanically controlled rewiring of neuronal circuits. The Journal of Neuroscience 36(3), 979–987 (2016)
- (52) Magdesian, M.H., Sanchez, F., Lopez, M., Thostrup, P., Durisic, N., Belkaid, W., Liazoghli, D., Grütter, P., Colman, R.: Atomic force microscopy reveals important differences in axonal resistance to injury. Biophysical Journal 103(3), 405–414 (2012)
- (53) Maia, P.D., Hemphill, M.A., Zehnder, B., Zhang, C., Parker, K.K., Kutz, J.N.: Diagnostic tools for evaluating the impact of focal axonal swellings arising in neurodegenerative diseases and/or traumatic brain injury. Journal of Neuroscience Methods 253, 233–243 (2015)
- (54) Maia, P.D., Kutz, J.N.: Compromised axonal functionality after neurodegeneration, concussion and/or traumatic brain injury. Journal of Computational Neuroscience 27, 317–332 (2014)
- (55) Maia, P.D., Kutz, J.N.: Identifying critical regions for spike propagation in axon segments. Journal of Computational Neuroscience 36(2), 141–155 (2014)
- (56) Maxwell, W.L., Povlishock, J.T., Graham, D.L.: A mechanistic analysis of nondisruptive axonal injury: A review. Journal of Neurotrauma 17(7), 419–440 (1997)
- (57) Menon, D.K., Maas, A.I.R.: Progress, failures and new approaches for tbi research. Nature Reviews Neuroloy 11, 71–72 (2015)
- (58) Millecamps, S., Julien, J.: Axonal transport deficits and neurodegenerative diseases. Nature Reviews Neuroscience 14(161), 161–176 (2013)
- (59) Morrison, B., Elkin, B.S., Dolle, J.P., Yarmush, M.L.: In vitro models of traumatic brain injury. Annual Reviews in Biomedical Engineering 13(1), 91–126 (2011)
- (60) Nikic, I., Merkler, D., Sorbara, C., Brinkoetter, M., Kreutzfeld, M., Bareyre, F., Bruck, W., Bishop, D., Misgeld, T., Kerschensteiner, M.: A reversible form of axon damage in experimental autoimmune encephalomyelitis and multiple sclerosis. Nature Medicine 17(4), 495–499 (2011)
- (61) Park, H.J., Friston, K.: Structural and functional brain networks: From connections to cognition. Science 342, 1238,411–1–1238,411–8 (2013)
- (62) Patterson, B.W., Elbert, D.L., Mawuenyega, K.G., Kasten, T., Ovod, V., Ma, S., Xiong, C., Chott, R., Yarasheski, K., Sigurdson, W., Zhang, L., Goate, A., Benzinger, T., Morris, J.C., Holtzman, D., Bateman, R.J.: Age and amyloid effects on human central nervous system amyloid-beta kinetics. American Neurological Association 78(3), 439–453 (2015)
- (63) Petersen, R.C.: Mild cognitive impairment as a diagnostic entity. Journal of Internal Medicine 256, 183–194 (2004)
- (64) Povlishock, J.T., Katz, D.I.: Update of neuropathology and neurological recovery after traumatic brain injury. Journal of Head Trauma Rehabilitation 20(1), 76–94 (2005)
- (65) Qiu, C., Kivipelto, M., von Strauss, E.: Epidemiology of alzheimer?s disease: occurrence, determinants, and strategies toward intervention. Dialogues in Clinical Neuroscience 11(2), 111–128 (2009)
- (66) Rabinovich, M., Huerta, R., Varona, P., Afraimovich, V.: Transient cognitive dynamics, metastability, and decision making. PLoS Comp. Bio. 4, e1000,072 (2008)
- (67) Rabinovich, M., Volkovskii, A., Lecanda, P., Huerta, R., Abarbanel, H., Laurent, G.: Dynamical encoding by networks of competing neuron groups: Winnerless competition. Phys. Rev. Lettl. 87, 068,102 (2001)
- (68) Ratcliff, R., Rouder, J.N.: Modeling response times for two-choice decisions. Psychological Science 9(5), 347–356 (1998)
- (69) del Razo, M.J., Morofuji, Y., Meabon, J.S., Huber, B.R., Peskind, E.R., Banks, W.A., Mourad, P.D., LeVeque, R.J., Cook, D.G.: Computational and in vitro studies of blast-induced blood-brain barrier disruption. SIAM Journal on Scientific Computing 38(3), 347–374 (2016)
- (70) Reeves, T.M., Smith, T.L., Williamson, J.C., Phillips, L.L.: Unmyelinated axons show selective rostrocaudal pathology in the corpus callosum after traumatic brain injury. Journal of Neuropathology & Experimental Neurology 71(3), 198–210 (2012)
- (71) Riffell, J.A., Shlizerman, E., Sanders, E., Abrell, L., Medina, B., Hinterwirth, A.J., Kutz, J.N.: Flower discrimination by pollinators in a dynamic chemical environment. Science 344, 1515–1518 (2014)
- (72) Roozenbeek, B., Maas, A.I.R., Menon, D.K.: Changing patterns in the epidemiology of traumatic brain injury. Nature Reviews Neurology 9, 231–236 (2013)
- (73) Rubovitch, V., Ten-Bosch, M., Zohar, O., Harrison, C., Tempel-Brami, C., Stein, E., Hoffer, B., Balaban, C., Schreiber, S., Chiu, W., Pick, C.: A mouse model of blast-induced mild traumatic brain injury. Experimental Neurology 232(2), 280–289 (2011)
- (74) Rudy, S., Maia, P.D., Kutz, J.N.: Cognitive and behavioral deficits arising from neurodegeneration and traumatic brain injury: a model for the underlying role of focal axonal swellings in neuronal networks with plasticity. Journal of Systems and Integrative Neuroscience (2016)
- (75) Shadlen, M.N., Hanks, T.D., Churchland, A.K., Kiani, R., Yang, T.: The Speed and Accuracy of a Simple Perceptual Decision: A Mathematical Primer. Ch.10 (2007)
- (76) Shadlen, M.N., Kiani, R.: Decision making as a window on cognition. Neuron 80(3), 791–332 (2013)
- (77) Shadlen, M.N., Shohamy, D.: Decision making and sequential sampling from memory. Neuron 90, 927–939 (2016)
- (78) Sharp, D.J., Scott, G., Leech, R.: Network dysfunction after traumatic brain injury. Nature Reviews Neurology 10, 156–166 (2014)
- (79) Shlizerman, E., Riffell, J.A., Kutz, J.N.: Data-driven inference of network connectivity for modeling the dynamics of neural codes in the insect antennal lobe. Frontiers in Computational Neuroscience 8(70), 1–15 (2014)
- (80) Skandsen, T., Kvistad, K.A., Solheim, O., Strand, I.H., Folvik, M., Vik, A.: Prevalence and impact of diffuse axonal injury in patients with moderate and severe head injury: a cohort study of early magnetic resonance imaging findings and 1-year outcome. Journal of Neurosurgery 113(3), 556–563 (2010)
- (81) Smith, D., Wolf, J., Lusardi, T., Lee, V., Meaney, D.: High tolerance and delayed elastic response of cultured axons to dynamic stretch injury. The Journal of Neuroscience 19(11), 4263–4269 (1999)
- (82) Tagliaferro, P., Burke, R.E.: Retrograde axonal degeneration in parkinson disease. Journal of Parkinson?s Disease 6, 1–15 (2016)
- (83) Tang-Schomer, M.D., Johnson, V.E., Baas, P.W., Stewart, W., Smith, D.H.: Partial interruption of axonal transport due to microtubule breakage accounts for the formation of periodic varicosities after traumatic axonal injury. Experimental Neurology 233, 364–372 (2012)
- (84) Tang-Schomer, M.D., Patel, A., Bass, P.W., Smith, D.H.: Mechanical breaking of microtubules in axons during dynamic stretch injury underlies delayed elasticity, microtubule disassembly, and axon degeneration. The FASEB Journal 24(5), 1401–1410 (2010)
- (85) Thies, W., Bleiler, L.: Alzheimer’s disease facts and figures. Alzheimer’s & Dementia 9(2), 208?245 (2013)
- (86) Trapp, B.D., Nave, K.A.: Multiple sclerosis: An immune or neurodegenerative disorder? Annual Review Neuroscience 31(1), 247–269 (2008)
- (87) Tsai, J., Grutzendler, J., Duff, K., Gan, W.B.: Fibrillar amyloid deposition leads to local synaptic abnormalities and breakage of neuronal branches. Nature Neuroscience 7, 1181–1183 (2004)
- (88) Victor, J.D., Purpura., K.P.: Metric space analysis of spike trains: theory, algorithms and application. Network: Computational Neural Systems 8, 127–164 (1997)
- (89) Wang, J., Hamm, R.J., Povlishock, J.T.: Traumatic axonal injury in the optic nerve: evidence for axonal swelling, disconnection, dieback and reorganization. Journal of Neurotrauma, 28(7), 1185–1198 (2011)
- (90) Watts, D.J., Strogatz, S.H.: Collective dynamics of ’small-world’ networks. Nature 393(6684), 440–442 (1998)
- (91) Wulfram Gerstner Werner M. Kistler, R.N., Paninski, L.: Neuronal Dynamics. Cambridge University Press (2014)
- (92) Xiong, Y., Mahmood, A., Chopp, M.: Animal models of traumatic brain injury. Nature Reviews Neuroscience 14(22), 128–142 (2013)
- (93) Yue, J.K., Vassar, M.J., Lingsma, H.F., Cooper, S.R., Okonkwo, D.O., Valadka, A.B., Gordon, W.A., Maas, A.I.R., Mukherjee, P., Yuh, E.L., Puccio, A.M., Schnyer, D.M., Manley, G.T., Casey, S.S., Cheong, M., Dams-O?Connor, K., Hricik, A.J., Knight, E.E., Kulubya, E.S., Menon, D.K., Morabito, D.J., Pacheco, J.L., Sinha, T.K.: Transforming research and clinical knowledge in traumatic brain injury pilot: multicenter implementation of the common data elements for traumatic brain injury. Journal of Neurotrauma 30, 1831–1844 (2013)