Globular Clusters, Ultracompact Dwarfs, and Dwarf Galaxies in Abell 2744 at the Redshift of 0.308
Abstract
We report a photometric study of globular clusters (GCs), ultracompact dwarfs (UCDs), and dwarf galaxies in the giant merging galaxy cluster Abell 2744 at . Color-magnitude diagrams of the point sources derived from deep F814W (restframe ) and F105W (restframe ) images of Abell 2744 in the Hubble Space Telescope Frontier Field show a rich population of point sources whose colors are similar to those of typical GCs. These sources are as bright as (F814W(Vega)) mag, being mostly UCDs and bright GCs in Abell 2744. The luminosity function (LF) of these sources shows a break at (F814W ) mag, indicating a boundary between UCDs and bright GCs. The numbers of GCs and UCDs are estimated to be , and , respectively. The clustercentric radial number density profiles of the UCDs and bright GCs show similar slopes, but these profiles are much steeper than that of the dwarf galaxies and the mass density profile based on gravitational lensing analysis. We derive an LF of the red sequence galaxies for mag. The faint end of this LF is fit well by a flat power law with , showing no faint upturn. These results support the galaxy-origin scenario for bright UCDs: they are the nuclei of dwarf galaxies that were stripped when they pass close to the center of massive galaxies or a galaxy cluster, while some of the faint UCDs are the bright end of the GCs.
Subject headings:
galaxies: clusters: individual (Abell 2744) — galaxies: star clusters: general — galaxies: formation ––galaxies: luminosity function, mass function — galaxies: dwarfs1. INTRODUCTION
The brightest galaxies in galaxy clusters host rich globular cluster (GC) systems as well as satellite galaxies: e.g., M49 and M87 in Virgo, NGC 4874 in Coma, NGC 6166 in Abell 2199, and the brightest galaxies in Abell 1689 (Geisler et al., 1996; Lee & Geisler, 1993; Harris et al., 2009; Peng et al., 2011; Alamo-Martínez et al., 2013; Harris et al., 2014, 2016). Galaxy clusters host not only the GCs around galaxies, but also intracluster GCs between galaxies. These intracluster GCs are mostly metal-poor and they are found even far from massive galaxies (Lee et al., 2010; Peng et al., 2011; Alamo-Martínez et al., 2013; Durrell et al., 2014).
The nearest galaxy clusters like Virgo and Fornax are excellent targets to investigate the details of stellar populations and galaxy populations. However, these galaxy clusters occupy a wide field in the sky so it is not easy to cover the entire area of a galaxy cluster. On the other hand, distant galaxy clusters provide an advantage that it is possible to cover the entire area of a galaxy cluster and its background field. Thus they can serve as a very useful target to study global properties of stellar populations and galaxy populations in an entire cluster, if deep images with high resolution are available.
To date Abell 1689 at is the most distant galaxy cluster ( Mpc and for km s-1 Mpc-1 ) in which GCs were studied in detail. Alamo-Martínez et al. (2013) selected point sources with F814W(AB) mag (F814W(Vega) mag, corresponding to mag) in the deep Hubble Space Telescope (HST)/Wide Field Camera (WFC) F814W images, and estimated the total number of GCs. They obtained a value for the GCs at kpc from the cluster center, , showing that Abell 1689 hosts the largest GC system among the known galaxies or galaxy clusters. They also found that the radial mass density profile of the GCs at kpc is steeper than those of the total mass and X-ray gas, while it is flatter than that of the stellar light. However, no color information is available for these point sources, because they used only one-band (F814W) images for their study.
| Parameter | Value | References |
|---|---|---|
| Heliocentric Velocity | 92336 km s-1 | 1,2 |
| Redshift | 1,2 | |
| Luminosity Distancea | Mpc | 1 |
| Distance Modulusa | 1 | |
| Scalea | 4.370 kpc arcsec-1 = 262.18 kpc arcmin-1 | 1 |
| Age at Redshifta | 9.937 Gyr | 1 |
| Foreground Extinction | , , | 3 |
| Velocity Dispersion | km s-1 | 4 |
| Mass | 7 (gravitational lensing) | |
| 5,6 (galaxy dynamics) | ||
| Cluster Type | BM III | 1 |
| X-ray Luminosity | erg s-1 | 8 |
On the other hand, Mieske et al. (2004) studied bright point sources in the much shallower ACS F475W (SDSS ), F625W (), F775W (), and F850L () images of Abell 1689, finding more than 10 ultracompact dwarfs (UCDs) with mag ( mag). They selected point sources with stellarity values derived using SExtractor (Bertin & Arnouts, 1996). They suggested that the cumulative radial distribution of the UCDs with mag ( mag) is consistent with that of the genuine dwarf galaxies in the same cluster, but the size of the sample they used is too small to be statistically significant.
In this study, we present the results of our survey of GCs and UCDs in Abell 2744 (AC 118) at the redshift of , which is much more distant than Abell 1689. We adopt the cosmological parameters: km s-1 Mpc-1 , , and , as in the NASA Extragalactic Database (NED). For these parameters, the luminosity distance to Abell 2744 is Mpc (corresponding to ), and the time elapsed since the Big Bang for the cluster redshift is 9.9 Gyr. At this distance, one arcsec (one arcmin) corresponds to 4.37 kpc (262 kpc) so the GCs and the UCDs in Abell 2744 are not resolved in the HST images. The basic properties of Abell 2744 are listed in Table 1.
Abell 2744 is a giant galaxy cluster, and is often called the Pandora cluster because it is known to be in the phase of active major merging (Couch & Newell, 1984; Couch & Sharples, 1987; Owers et al., 2011). Abell 2744 shows several distinguishable features. Gravitational lensing analysis (strong lensing and weak lensing), X-ray emission, and galaxy kinematics of Abell 2744 all show it is one of the most massive galaxy clusters, having a mass of 2 (Merten et al., 2011; Richard et al., 2014; Wang et al., 2015; Jauzac et al., 2015; Medezinski et al., 2016). The mass of Abell 2744 is comparable to that of the Bullet cluster at a similar redshift (Paraficz et al., 2012). The center of the mass distribution in Abell 2744 is close to the center of the southern core where the two brightest cluster galaxies (BCGs) are located. It is embedded in a giant radio halo, and are surrounded by huge radio relics (Govoni et al., 2001; Orrú et al., 2007). It has a high X-ray luminosity, but the peak of the X-ray emission is 250 kpc () offset in the north-west direction from the center of the mass map based on the gravitational lensing analysis (see Figure 1 in Merten et al. (2011)).
Abell 2744 shows a large velocity dispersion ( km s-1 ) and two subcomponents that have different kinematics with a mean radial velocity difference of 3000–4000 km s-1 (Boschin et al., 2006; Owers et al., 2011). The color-magnitude diagram (CMD) of this cluster shows a population of faint blue galaxies in addition to a red sequence, which is known as the Butcher-Oemler effect (Couch & Newell, 1984; Couch & Sharples, 1987). Abell 2744 is known to have a high star formation rate, yr-1 for Mpc, and the fraction of IR-detected star-forming galaxies in this cluster is 0.08, comparable to those of other relaxed clusters at similar redshifts (Rawle et al., 2014). Four jellyfish galaxies were found in this cluster, showing evidence of a major cluster merger transforming rapidly the morphology of galaxies. (Owers et al., 2012). Abell 2744 hosts no cD galaxies so it is classified as Bautz-Morgan Type III. Two BCGs are located in the southern core. These BCGs are No.1 and 2 in Couch & Newell (1984)(their finding chart is given in Couch & Sharples (1987)), called CN-1 and CN-2 hereafter. A mass density map derived from gravitational lensing analysis shows peaks at these two brightest galaxies (Lam et al., 2014; Wang et al., 2015; Jauzac et al., 2015), and the highest peak is close to the position of the BCG in the south (CN-2). Abell 2744 hosts numerous dwarf galaxies as well as massive galaxies, so it is an excellent target for the study of the galaxy luminosity function as well. Recently, Blakeslee et al. (2015) reported a detection of GCs and compact star clusters in the single band (F814W) images of Abell 2744.
In this study we investigate the GCs and UCDs as well as dwarf galaxies in Abell 2744 detected in the deep HST Frontier Field (HFF) images obtained with F814W and F105W filters. Primary goals of observing several massive galaxy clusters in the HFF are to study the gravitationally-lensed sources and to detect and study high redshift sources behind the galaxy clusters. However, these images are also an excellent resource to study the objects belonging to the target galaxy clusters. Montes & Trujillo (2014) studied the properties of the diffuse intracluster light in Abell 2744 using F435W, F814W, F105W and F140W images in the HFF program.
We select and study the GCs, UCDs, and dwarf galaxies in Abell 2744, taking advantage of the high spatial resolution and depth of these images. The wide coverage of a large fraction of Abell 2744 in the HFF data provides a unique opportunity of being able to investigate any relation among the GCs, UCDs, and dwarf galaxies in a massive galaxy cluster. This paper is composed as follows. Section 2 describes data reduction. In §3 we present the CMDs of the point sources and extended sources in Abell 2744. Detected point sources are mostly bright GCs and UCDs in Abell 2744, while extended sources are galaxies. We investigate the spatial distributions of the GCs and UCDs and of the galaxies. We then present the luminosity functions (LFs) of the GCs and UCDs and of the red sequence galaxies in Abell 2744. Then we discuss primary results. Finally we summarize our main results.
| Abell 2744 | Parallel Field | HXDF | |
|---|---|---|---|
| Right ascension | 00 14 21.26 | 00 13 53.35 | 3 32 38.82 |
| Declination | –30 23 47.3 | –30 22 52.7 | –27 47 28.3 |
| Galactic longitude | 8 50 08.59 | 9 08 51.13 | 223 33 15.26 |
| Galactic latitude | –81 14 39.3 | –81 09 17.0 | –54 23 43.6 |
| 0.020 | 0.019 | 0.012 | |
| 0.013 | 0.012 | 0.008 | |
| Exposure, F814W | 104,270s | 107,766s | 50,800s |
| Exposure, F105W | 68,952s | 67,330s | 266,700s |
| Pixel scale, F814W | or | ||
| Pixel scale, F105W | |||
| Drizzle software | DrizzlePac | DrizzlePac | APSIS |
2. DATA AND DATA REDUCTION
2.1. Data
We used the data for Abell 2744 released as part of the HFF program (ID13495, PI:J. Lots, ID13386, PI:S.Rodney, ID11689, PI:R. Dupke) (Lotz et al., 2014; Koekemoer et al., 2014). We selected ACS/F814W() and WFC3/F105W() images among the HFF data set, because we believed this combination of images to be the most efficient and suitable for searching for GC-like objects in Abell 2744. The HFF data cover two HST fields in Abell 2744: one for the southern core region of Abell 2744 and one for the parallel field at west. Each of these fields covers . Basic information of the HST data for these fields is summarized in Table 2.
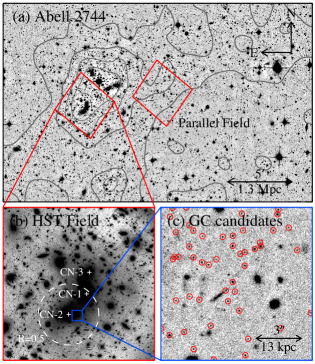
Figure 1(a) displays a finding chart for the HST Abell 2744 field and its parallel field based on the CFHT/MegaCam -band image of Abell 2744 in the CFHT archive. We overlaid the number density contours of galaxies we derived from the MegaCam image in the same figure. The Abell 2744 field is located in the highest number density region of galaxies in the cluster. On the other hand, the parallel field is in the region with a number density that is much lower than that of the cluster region, but is slightly higher than that of the background field region.
The effective wavelengths of the F814W and F105W filters for the redshift () of Abell 2744 (6220 Å and 8030 Å) correspond approximately to SDSS and Cousins (or SDSS ) in the rest-frame, respectively. The total exposure time is for F814W and for F105W. We used the drizzled science images with a pixel scale of in the released data. One pixel corresponds to pc at the distance to Abell 2744. The full width at half-maximum (FWHM) values of the point sources in the images are pixels ( to , and 380 to 393 pc). It is expected that GCs ( pc) and UCDs ( pc) at the distance to Abell 2744 appear as point sources in these images.
2.2. Detection of Point Sources
Figure 1(b) shows that diffuse light in and around bright galaxies occupies a significant fraction of the field. We removed diffuse light from the images before source detection. We made a smooth background image for each filter using ring median filters, and subtracted them from the original images in Figure 1(b). These background-subtracted images (a small section of which is shown in Figure 1(c)) were used for the detection of point sources. Many point sources (marked with red circles) are clearly seen in the background-subtracted images (Figure 1(c)), with most being GC and UCD candidates. A small number of extended sources are also seen in the same image, and these are galaxies.
We used DAOPHOT (Stetson, 1987, 1994) to find point sources and derive the point spread function fitting photometry of all detected point sources. We selected the point sources among the detected sources using the DAOPHOT sharpness parameters. Then we calibrated the instrumental magnitudes of these sources to the Vega system following the STScI webpage111http://www.stsci.edu/hst/acs/analysis/zeropoints,222http://www.stsci.edu/hst/wfc3/phot_zp_lbn. Note that Alamo-Martínez et al. (2013) adopted AB magnitudes for their photometry of the point sources in Abell 1689. Vega magnitudes for F814W are 0.424 mag brighter than AB magnitudes: F814W(Vega) = F814W(AB).
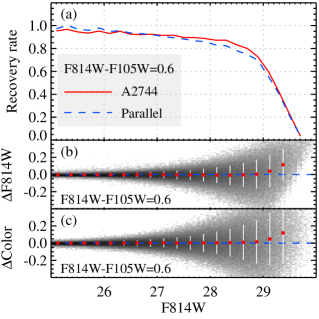
We performed artificial star experiments to estimate the completeness of our photometry for the point sources. We added a number of artificial star images to the HST images using IRAF/ADDSTAR, and carried out detection and photometry of the sources using the same procedures as done for the original images. We set the color of the artificial stars to be (F814W–F105W). Then we calculated the ratio of the number of the detected stars and the number of the added star to estimate the recovery rate. Figure 2 displays the results of the artificial star experiments. This figure shows that the completeness of the point source photometry is 50% at F814W mag for both the Abell 2744 field and the parallel field. It also shows that the mean differences in F814W magnitudes and (F814W–F105W) colors between input and output artificial stars are smaller than 0.05 mag for F814W mag.
2.3. Detection of Galaxies
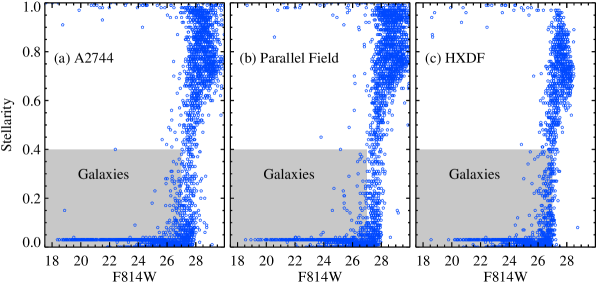
For the study of galaxies in Abell 2744, we used SExtractor (Bertin & Arnouts, 1996) to detect extended sources and derive their photometry in the original images. Stellarity parameters provided by SExtractor are an excellent criterion to distinguish extended sources from point sources in the images. Figure 3(a) displays stellarity values versus F814W magnitudes of all detected sources in the Abell 2744 field. We selected the extended sources with stellarity smaller than 0.4 in the SExtractor photometry catalog, to produce a sample of galaxies. For analysis of galaxies, we used only the sources brighter than F814W mag for which point sources and extended sources are clearly separated by stellarity values. We adopted AUTO magnitudes of the sources provided by SExtractor. These extended sources are thought to be mostly galaxies.
For estimating the background contribution to the Abell 2744 field, we used two sets of data: data for the parallel field of Abell 2744 and data for the the Hubble Extreme Deep Field (HXDF) provided by Illingworth et al. (2013). We performed similar analysis of the images of the parallel field west of the Abell 2744 field, as shown in Figure 1(a), in the same released data. The data for the parallel field were obtained with similar exposure times, reaching the similar depth of photometry as the Abell 2744 field. Similarly, we analyzed also the F814W and F105W images of the HXDF. Basic information of the HST data for the HXDF is also included in Table 2. The HXDF is located far from the Abell 2744 field in the sky, while the parallel field is much closer to the Abell 2744 field. Thus, the HXDF images can be used to estimate the background contribution to the Abell 2744 field. The parallel field may contain a small number of the Abell 2744 cluster members, which can be checked with the results of the HXDF. The exposure times for the HXDF images are about a half of those for Abell 2744 images, but the source crowding and diffuse light level of large galaxies in the HXDF images are much less than those in the Abell 2744 images.
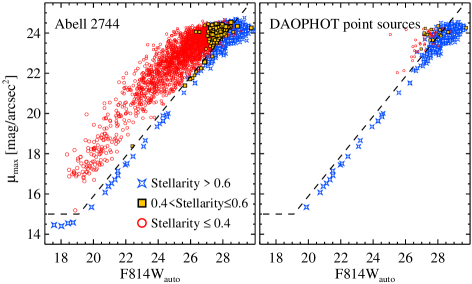
The relation between surface brightness and integrated magnitudes has been sometimes used to distinguish between the point sources and the extended sources in the study of distant galaxies (Bañados et al., 2010; Ferrarese et al., 2012; De Propris et al., 2013). In Figure 4(a), we plotted the maximum surface brightness (, at the center of each source) versus F814W magnitudes of the sources derived using SExtractor. We marked the extended sources selected using the condition of stellarity with open red circles, 0.4 to 0.6 with yellow squares, and with blue starlet symbols. This figure shows that point sources (with stellarity ) follow a narrow sequence up to the faint magnitude at F814W mag, while extended sources (with stellarity ) follow another sequence with lower surface brightness and larger scatter. These two sequences overlap in the faint end at F814W mag. Thus, the stellarity parameter is found to be very efficient at distinguishing between extended sources and point sources, as shown by the dashed line in the figure. In the following analysis we use the stellarity condition () to select the extended sources for the study of galaxies. In Figure 4(b), we plotted a diagram similar to Figure 4(a), but for the point sources selected using DAOPHOT. This figure shows that the position of the DAOPHOT point sources follows well the relation for the SExtractor point sources with stellarity . A small number of the faint DAOPHOT point sources with 2728.0 mag have stellarity, and some with 2628.0 mag have stellarity. The stellarity values show a large spread at the faint level close to the detection limit so that sensitivity of the stellarity used for classification decreases significantly. Thus we use the DAOPHOT point sources for the analysis in the following.
3. RESULTS
3.1. CMDs of the Galaxies
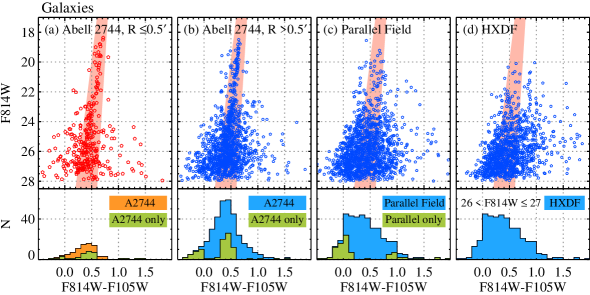
The point sources detected in the HST images are mostly unresolved GCs and UCDs, and the extended sources are mainly galaxies. We present the CMDs of the extended sources to study galaxies in this section, and those of the point sources to investigate the GCs and UCDs in Abell 2744 in the following section. Figure 5 displays F814W–(F814W–F105W) CMDs of the extended sources (having stellarity ) brighter than F814W mag ( mag) detected in the images of the Abell 2744 field, the parallel field, and the HXDF. In Figure 5(a,b) we plotted, with red and blue symbols, respectively, the sources in the inner region at (= 131 kpc at ) and those in the outer region at , where is the projected distance from the center of the brightest galaxy, CN-2.
The most remarkable feature in the CMD of the extended sources in Abell 2744 is the existence of a narrow red sequence, the brightest of which extends to F814W mag and (F814W–F105W) ( mag, mag). The bright part of this sequence is consistent with the old findings based on ground-based data by Couch & Sharples (1987), but the sequence in this study goes much fainter. This red sequence is more distinguishable in the inner region than in the outer region, indicating that most of the galaxies in this sequence are the members of Abell 2744. This sequence becomes broader as the sources become fainter, due to increasing photometric errors and the increasing fraction of blue galaxies. This red sequence is fit well by a linear relation, F814W F814W–F105W for the bright range (F814W mag). The faint part of this red sequence becomes almost vertical at (F814W–F105W). There are a number of sources in the blue side of the red sequence of Abell 2744, showing the Butcher-Oemler effect. The red sequence is not obvious in the CMDs of the parallel field and the HXDF, showing again that the red sequence galaxies in the Abell 2744 field are mostly the members of the cluster.
To investigate the properties of faint galaxies in Abell 2744, we derived the color distributions of the faint extended sources with F814W mag ( mag) in each field, plotting them with the orange and cyan histograms in Figure 5 (lower panels). We subtracted the background contribution using the data from the HXDF, plotting the results with the green histograms. Two interesting features can be found in this figure. First, the background-subtracted color distribution of the Abell 2744 field shows a narrow red component with (F814W–F105W) whose peak is at (F814W–F105W). This is not seen in the case of the parallel field. This shows that most of these red faint galaxies must be the members of Abell 2744, and that the parallel field contains few red sequence galaxies. The colors of these faint galaxies in Abell 2744 are similar to those of red dwarf galaxies found in the local universe. Second, both the Abell 2744 field and the parallel field show an excess of faint blue galaxies at (F814W–F105W). The number of these sources in the Abell 2744 field is , which is about a half of that in the parallel field, . Thus the number density of these galaxies is higher in the parallel field than in the Abell 2744 field. We checked the images of these blue faint sources, finding that most of them are star-forming dwarf galaxies. Thus these blue faint galaxies are probably star-forming galaxies that are located in the outskirts of Abell 2744, falling toward the cluster center.
We marked the boundary of the red sequence following the position of the red galaxies in the inner region of Abell 2744 in the CMD by the shaded region. The sources located within the red sequence boundary are most likely the members of Abell 2744. We selected these red sequence galaxies to investigate the properties of the cluster member galaxies in the following section.
3.2. CMDs of the GCs and UCDs
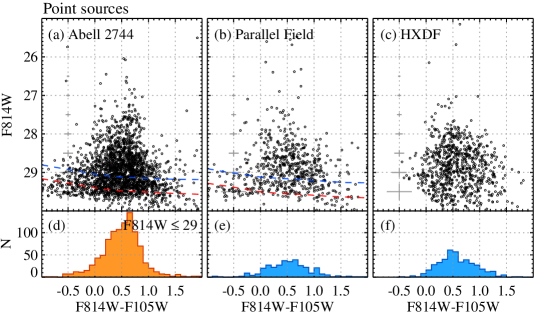
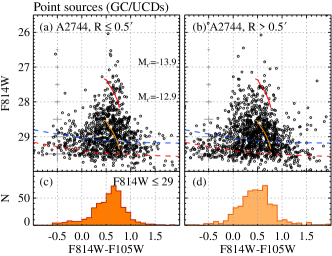
The CMDs of the point sources in each field are displayed in Figure 6, which includes also the color histograms of the sources brighter than F814W mag. We also plotted the CMDs of the point sources in the inner () and outer () regions of the Abell 2744 field in Figure 7. A remarkable feature in the CMDs of Abell 2744 is the presence of a rich population of point sources in the broad vertical feature at (F814W–F105W) and F814W mag ( mag). These sources are mostly fainter than F814W = 27.5 () mag, and their color distribution shows a strong peak at (F814W–F105W) .
In Figure 7, we also plotted simple stellar population (SSP) models for an age of 10 Gyr, masses of and , and metallicity [Fe/H] = –2.4 to 0.0 (from blue to red), based on the Padova models (Girardi et al., 2000). The peak color in the color distribution of the point sources in Figure 7 is consistent with the SSP models for low metallicity (Fe/H]). The magnitudes and colors of these point sources (F814W mag and (F814W–F105W) ) are, on average, consistent with models for low metallicity. This indicates that these point sources are mostly UCDs and massive GCs that have much higher masses than the massive GCs in the Milky Way Galaxy, and that they are metal-poor.
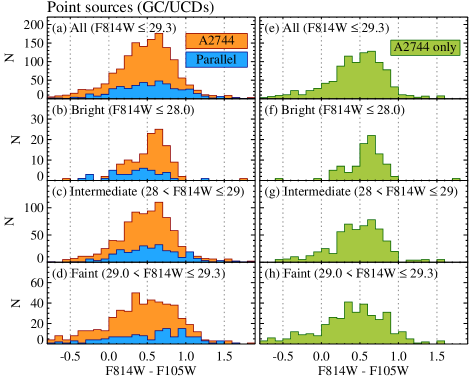
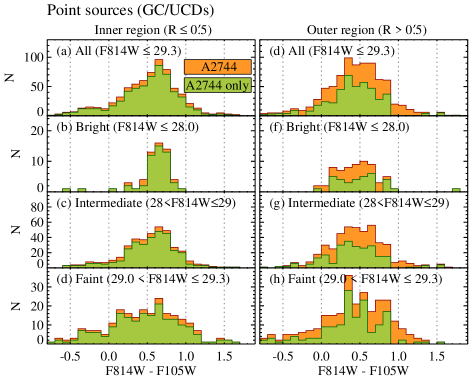
We divided all point sources with F814W mag into three groups according to their magnitudes: a bright group (F814W mag, mag), an intermediate-luminosity group (F814W mag, mag), and a faint group (F814W mag, mag). The color distributions for these groups in each field are plotted in Figure 8. The color distributions for Abell 2744 (orange histograms) in the left panels of the figure follow a Gaussian distribution, while those for the parallel field (blue histograms) are relatively flat. This shows that the point sources in the parallel field are mostly background sources. Thus, the contribution of the point source members of Abell 2744 is minor in the parallel field. The HXDF data is not as deep as the data for Abell 2744 for the study of the point sources. Therefore, we subtracted the contribution due to the background using the color distribution for the parallel field, and plotted the results with green histograms in Figure 8(right panels). The background-subtracted color distribution of all point sources shows a strong concentration with a peak at (F814W–F105W). The color distribution of the bright group shows a strong concentration at (F814W–F105W) with a peak at (F814W–F105W), while that of the intermediate-luminosity group shows a peak at a slightly bluer color, (F814W–F105W).
We display the color distributions of the point sources in the inner () and outer () regions of Abell 2744 before and after background subtraction with the parallel field data in Figure 9. The peak colors of the inner region are slightly redder than those of the outer region. The peak color for the inner region is (F814W–F105W) mag, which is 0.1 mag redder than that for the outer region.
These results imply that the bright sources (UCDs) are, on average, redder (more metal-rich) than the intermediate-luminosity group sources (bright GCs), and that the fraction of redder GCs/UCDs is higher in the inner region than that in the outer region. This trend has been seen also in the CMDs of the local galaxy clusters like the Coma cluster (see Chiboucas et al. (2011) and their Figure 8). The color distribution of the faint group is broader than those of the brighter groups, which is mainly due to increasing photometric errors.
The faint group and the intermediate-luminosity group show also a small population of blue sources with (F814W–F105W). We checked the morphology of these sources in the images. These faint blue point sources are mostly compact star-forming dwarf galaxies like blue compact dwarfs (BCDs), and a few of them are considered to be lensed images of background blue galaxies.
3.3. Spatial Distributions of the GCs and UCDs
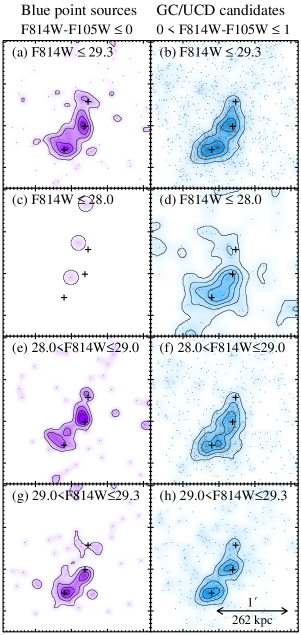
We selected, for the GC and UCD candidates, the point sources with F814W () mag and (F814W–F105W) in the DAOPHOT photometry catalog of Abell 2744 for further analysis. We divided the GC/UCD sources into three subgroups according to their magnitudes as in the previous section. We also selected a blue group of the point sources that have (F814W–F105W).
Figure 10 shows the spatial distribution of the selected sources in Abell 2744, and their number density maps in contours (the blue sources in the left panels and the GC/UCDs in the right panels). This figure shows two notable features. First, it is seen clearly that the spatial distribution of the GCs and UCDs shows a strong central concentration around bright galaxies close to the center of the southern core in Abell 2744. The peak with the highest number density is close to the center of the brightest galaxy, CN-2. The central concentration is seen in both the bright and faint groups. It is noted that the extent of their spatial distribution reaches out to ( kpc) and further, indicating that they include not only galaxy GCs but also intracluster GCs. Second, the spatial distribution of the blue faint sources also shows a central concentration around bright galaxies, although their number density is much lower than that of the GC/UCDs. These blue sources are mostly star-forming galaxies, and some of them are gravitationally-lensed sources of background star-forming galaxies.
| All GC/UCDs | |||
| Bright GC/UCDs | |||
| Faint GC/UCDs (outer) | |||
| Faint GC/UCDs (inner) |
3.4. Radial Number Density Profiles of the GCs and UCDs
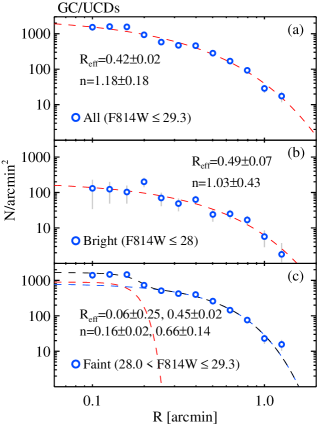
Figure 11 displays the radial number density profiles of the GCs and UCDs in Abell 2744. We adopted the center of CN-2, which is close to the position of the highest number density, as a reference center for deriving the radial number density profiles. We subtracted the contribution due to background sources using the number density of the point sources in the outermost region at (367 kpc). The radial number density profile of the GCs and UCDs in Figure 11(a) shows a slight drop in the central region at (52 kpc), decreases slowly as the clustercentric distance increases until at (183 kpc), and decreases more rapidly thereafter until the outer boundary of Abell 2744, at (341 kpc). A break at indicates that the radial profiles consist of two components: a narrow one in the central region and a broad one in the outer region.
We divided the sample of GCs and UCDs into two subgroups according to their magnitudes: a bright group with F814W mag (UCDs), and a faint group with F814 mag (GCs). Figure 11(b,c) show little difference in the shapes of the radial density profile between the bright group and the faint group except for the central region where the faint group shows a slight excess. These radial profiles do not follow a power law. Instead, they are described well by a Sérsic law (Sérsic, 1963; Graham & Driver, 2005), as in the case of NGC 6166, a cD galaxy in Abell 2199 (Harris et al., 2016). Fitting the data for the region at with a Sérsic law with an index and effective radius , we obtain the results as follows and as listed in Table 3: and for the entire sample; and for the bright group. The data for the faint group is better fit with a double Sérsic law: and for the outer component, and and for the central component. The central component represents mostly galaxy GCs belonging to CN-2, while the latter contains intracluster GCs in Abell 2744. Thus, the values of the Sérsic index derived for the entire radial range are similar to those of the exponential disk law, and their differences between the bright and faint groups are not significant except for in the central region.
3.5. Spatial Distributions of the Galaxies
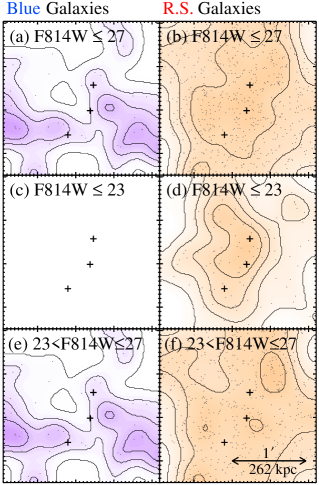
We selected two groups based on the location of the extended sources in the CMD. We chose, as the cluster member red sequence galaxy candidates, the extended sources located inside the red sequence boundary as marked in the CMD. Then we selected a blue group including the extended sources with blue colors, (F814W–F105W). These blue galaxies are mostly fainter than F814W () mag. This blue group may contain mostly star-forming dwarf galaxies in Abell 2744, while those in the red sequence group are mostly early-type members.
Figure 12 shows the spatial distribution of the selected sources, and their number density maps in contours. The spatial distribution of the red sequence galaxies shows a weak central concentration toward the center of the Abell 2744 field. The degree of central concentration is stronger for the bright galaxies with F814W mag. The number density of the faint galaxies varies much more slowly than that of the bright group. It is noted that the central concentration of the red faint galaxies is much weaker than that of the GCs and UCDs seen in Figure 10. On the other hand, the spatial distribution of the blue galaxies show little central concentration, indicating no relation with the brightest galaxies in Abell 2744. However their number density is too low to have any statistical significance.
3.6. LFs of the GCs and UCDs
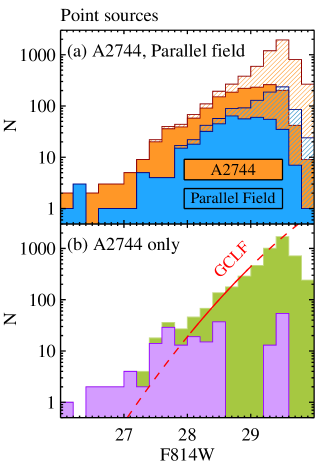
We selected red point sources with (F814W–F105W) (corresponding to the color range of the GCs) in Abell 2744 and the parallel field. Then we derived F814W-band LFs of these sources, as displayed in Figure 13(a). The filled histograms and hatched histograms in the figure denote the LFs before and after completeness correction, respectively. The completeness-corrected LF of these point sources increases as the magnitude gets fainter until F814W mag, and decreases significantly at F814W mag. The completeness is only 20% at F814W mag. Thus the turnover at F814W mag is probably due to incompleteness in our completeness correction for this faint level. The LF of the red point sources in the parallel field shows a similar trend, but in a lower fraction compared with that of the Abell 2744 field.
We subtracted the contribution due to background sources using the LFs of the point sources in the parallel field, and plotted the net completeness-corrected LF by the green histogram in Figure 13(b). This net LF can be considered to be the LF of the GCs and UCDs in Abell 2744. The net LF of the GCs and UCDs increases rapidly from F814W mag ( mag) as the sources get fainter, becoming almost flat at F814W mag ( mag). Then it increases again, reaching a maximum at F814W mag ( mag). Then it shows a turnover, which is due to the incompleteness of our completeness correction. Thus, the net LF of the GCs and UCDs shows a break at F814W mag ( mag). This break indicates that the net LF of the GCs and UCDs consists of two distinguishable components: a flat one at the bright side, F814W mag, and a steep one at the faint end, F814W mag. The bright component is dominated by the UCDs, while the faint component may show the bright part of the GC LF.
As a reference for the LF of the GCs in the Milky Way Galaxy (Rejkuba, 2012; Lee & Jang, 2016), we overlaid, by a red line in Figure 13(b), a Gaussian function with and F814W (), arbitrarily shifted vertically to match the data for F814W mag in the net LF where photometric incompleteness is not significant. It is noted that the LF for F814W mag is well matched by the Gaussian function. Then we subtracted the contribution of the normal GCs from the net LF using this Gaussian function, and plotted the resulting LF by the violet histogram in Figure 13(b). This LF represents the LF of the UCDs only. While a small number of the UCDs () are brighter than F814W = 27.4 () mag, most of them have magnitudes F814W () mag. The number of sources with F814W mag in the UCD LF is . From the integration of the GCLF, we obtained a value of , which is a rough estimate of the total number of the GCs in the Abell 2744 field. This value is even larger than that for Abell 1689, , given by Alamo-Martínez et al. (2013). Thus Abell 2744 hosts the largest number of GCs among the known systems. Note that this conclusion is based on the assumption the LF of the GCs in Abell 2744 is the same as in the Milky Way.
| Schechter function | ||||||
| Schechter function plus Power lawb | ||||||
| Power law |
3.7. LFs of the Red Sequence Galaxies
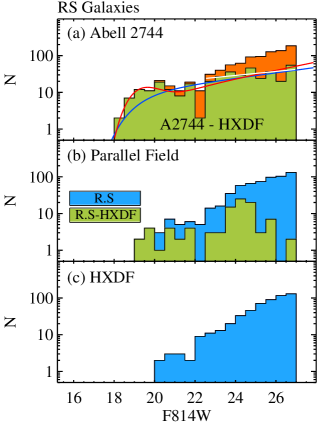
Figure 14 displays the F814W-band LFs of the galaxies inside the red sequence boundaries in Abell 2744 (orange histogram), the parallel field (cyan histogram), and the HXDF (cyan histogram). We subtracted the contribution due to background sources using the LFs of the extended sources in the HXDF that were selected using the same criteria as for Abell 2744, plotting the resulting LFs by the green histograms. The net LF of the red sequence galaxies in the parallel field shows only a small population of the member galaxies, which is negligible compared with that of the Abell 2744 field.
The net Lf of the red sequence galaxies in Abell 2744 shows a dip at F814W () mag, indicating a presence of two major components: a bright one and a faint one. The bright component appears to be approximately Gaussian with a peak at F814W () mag. The faint component follows a relatively flat power law, covering F814W () mag. The faint component represents a population of dwarf galaxies.
For the analysis of the galaxy LFs, either a single Schechter function or a combination of two functions has been used traditionally (Schechter, 1976; Loveday, 1997; Hilker et al., 2003; Popesso et al., 2006; Barkhouse et al., 2007; Bañados et al., 2010; Moretti et al., 2015). The Schechter function, exp, is given in terms of magnitude by
exp
where , , and are fitting parameters to be derived from data (Schechter, 1976).
We fit the galaxy LF with a Schechter function with a fixed value for F814W () mag, deriving a power law index , and , as plotted by the blue line in Figure 14(a). However, the bright part of the LF is not fit well by the single Schechter function, although the faint part is fit relatively well. If we use a simple power law (Log constant, as used for Coma in Yamanoi et al. (2012)) for fitting the faint component (with F814W) only, we get (as plotted by the white line in the figure), which is very similar to the value from the single Schechter function fitting.
We also tried a modified form of Schecher function with a double power law form (with a power law index for the bright part and a power law index for the faint part). This function was used to fit the double component LFs where the transition between the two components starts at in the previous studies (Loveday, 1997; Popesso et al., 2006; Barkhouse et al., 2007; Bañados et al., 2010; Moretti et al., 2015):
exp
which is given in terms of ,
exp.
Fitting the net LF with this function, we obtain , , , and , as plotted by the red line in the figure. The value of the power law index for the faint component is also similar to those derived above. Table 4 lists a summary of fitting for the galaxy LFs of Abell 2744.
In summary, the LF of Abell 2744 shows a dip at F814W () mag, and the LF of the faint component of Abell 2744 is relatively flat, described with a power law index, .
4. DISCUSSION
4.1. Comparison of the Galaxy LFs
The study of the galaxy LFs has a long history (Schechter (1976); Johnston (2011); Boselli & Gavazzi (2014); Lan et al. (2016); Lee et al. (2016) and references therein). The faint end of the galaxy LFs provides strong constraints to the modeling of the formation and evolution of low mass galaxies (e.g, Schaeffer & Silk (1988); Lu et al. (2015); Cerulo et al. (2016)). However, whether the slope for the faint end of the cluster galaxy LF is steep or flat has been controversial (Milne et al. (2007); Harsono & De Propris (2009); De Propris et al. (2013); Boselli & Gavazzi (2014); Martinet et al. (2015) and references therein). Several studies suggested that the LFs of red dwarf galaxies in galaxy clusters at low to high redshifts are relatively flat, with a power law index to –1.4 (Virgo and Fornax (Jerjen & Tammann, 1997; Hilker et al., 2003; Rines & Geller, 2008; Lieder et al., 2012; Davies et al., 2016; Giallongo et al., 2015), and clusters at (Harsono & De Propris, 2009)) or with to –1.1 (the Hydra I and the Centaurus (Misgeld et al., 2008, 2009), and several clusters at (Crawford et al., 2009; De Propris et al., 2013)).
On the other hand, Popesso et al. (2006) presented a much steeper LF for SDSS galaxy clusters. They derived composite LFs of blue () and red () galaxies ( mag) in the SDSS galaxy clusters at low redshift. The blue galaxy LF is fit well by a single Schechter function with a steep faint end ( and mag). However, the red galaxy LF becomes flat in the bright part and rises again at mag so that it can be described better by a sum of double Schechter components (see their Figure 9 and Table 2). The parameters for the fainter component are and mag, and those for the brighter component are and mag. Later Barkhouse et al. (2007) presented, from the analysis of the galaxy LFs of nearby Abell clusters, the LFs of red galaxies show even steeper faint ends (). They also found that the faint ends ( mag) of the LFs for red galaxies are steeper in the outer region than in the inner region of the clusters. However their data are more than one magnitude shallower than the Popesso et al. (2006) sample so that the uncertainties for the faint ends are larger. In addition, Bañados et al. (2010) presented an LF of the galaxies in Abell 1689 derived from the F606W and F814W WPFC2 images, which shows an upturn at F814W(AB) mag. The faint end at F814W(AB) mag (F814W(Vega) mag, mag) of the red sequence galaxies in this cluster shows a steep LF with ( for all galaxies). To make the story more interesting, Milne et al. (2007) and Yamanoi et al. (2012) presented a very steep LF of the faintest compact dwarf galaxies with mag in Coma, with a logarithmic slope, (derived using ). In contrast, Agulli et al. (2014) and Agulli et al. (2016) found recently, using spectroscopic members of Abell 85 (at ), no evidence for a steep upturn of the faint-end slope in the LF of red dwarf galaxies, obtaining for .
The LF of the faint end in Abell 2744 derived in this study is relatively flat with , showing no evidence for faint upturn. De Propris et al. (2013) used shallower images of Abell 2744 (PI:Dupke, PID: 11689)), obtaining () for mag from single Schechter function fitting (see their Fig. 11 for the CMD of Abell 2744). Our data go much deeper than those used in De Propris et al. (2013), and our result for the slope of the faint end, derived from the single Schechter function fitting, is slightly steeper than the value given by De Propris et al. (2013).
The LF of the faint end for Abell 2744 is in strong contrast to the result for Abell 1689 given by Bañados et al. (2010). Note that the LF of galaxies in Abell 1689 presented by Bañados et al. (2010) shows, in their Fig. 2(f), an upturn at the faint end F814W(AB) mag (F814W(Vega) mag), with a slope . Our LF of Abell 2744 goes much deeper (F814W(Vega) mag) than that given by Bañados et al. (2010).
The -band LFs of faint galaxies in Virgo and Fornax given by Jerjen & Tammann (1997) (see also a compilation in Fig. 4 of Ferrarese et al. (2012)) keep increasing until at the current completeness limits, mag and mag, respectively. These correspond to mag and mag, respectively, for . The LFs decrease thereafter until at mag, which is the faintest limit in the cluster galaxy sample. Recently Giallongo et al. (2015) found 11 ultra-faint low surface brightness galaxies with mag in a 576 arcmin2 field in Virgo using the Large Binocular Telescope. These galaxies are much fainter than the previous survey limits, but the covered field is only a small fraction of the Virgo cluster. Thus the detection limit of the faint galaxies in Abell 2744 in this study, F814W mag ( mag), is somewhat fainter than those for wide field surveys of Virgo and Fornax. The faint end slope for Abell 2744, is even slightly flatter than those for Virgo and Fornax, to –1.4, given by Jerjen & Tammann (1997); Rines & Geller (2008); Lieder et al. (2012); Davies et al. (2016); Giallongo et al. (2015), but is similar to the value, , for dwarf galaxies with mag in Fornax given by Hilker et al. (2003).
The LF of the red sequence galaxies in Abell 2744 shows a dip at F814W () mag. The presence of this dip in the galaxy LF has been known in the low density regions of galaxy clusters, while it is rarely seen in the high density regions of galaxy clusters (Mercurio et al., 2006; Popesso et al., 2006; Bañados et al., 2010; Agulli et al., 2016; Lee et al., 2016). The dip magnitude of Abell 2744 is similar to the values in the previous studies, mag. It has been suggested that the presence of this gap can be explained by the efficiency of merging of intermediate luminosity galaxies depending on the galaxy density (Miles et al., 2004; Mercurio et al., 2006; Agulli et al., 2016; Lee et al., 2016). Low density regions like the galaxy groups, poor galaxy clusters, or outskirt of rich galaxy clusters have a higher efficiency of galaxy merging than that of the high density regions, because they have lower velocity dispersion. Merging of intermediate luminosity galaxies (with a dip magnitude) produce brighter galaxies, while the LF of the faint galaxies changes little. It results in a dip in the LF of galaxies, showing two components in the galaxy LF. It is noted that the region of Abell 2744 used in this study is located at with relatively high density of galaxies, but it shows clearly a dip. This may be related with the dynamical status of Abell 2744, which is still involved with merging of substructures.
4.2. Comparison of Distributions of GC/UCDs and Dwarf Galaxies, and the Mass Map based on Gravitational Lensing Models
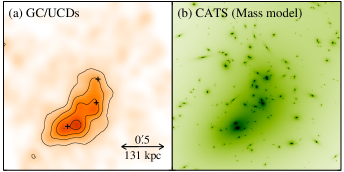
In Figure 15 we compare the spatial distribution of the GC/UCDs with the mass map for the same field derived from the gravitational lensing models by the CATS team, which is provided in the HFF (Jauzac et al., 2015). The mass map derived from the lensing model shows a strong concentration around the two BCGs (see also Wang et al. (2015)). Thus the spatial distribution of the GCs and UCDs is similar to the mass map. However, the degree of central concentration of the GCs and UCDs is much stronger than that of the mass density, as shown below.
For comparison with the radial number density profiles of the UCDs and GCs, we derived the radial number density profiles of the red sequence galaxies in Abell 2744, plotting them in Figure 16. We subtracted the background contribution using the HXDF data. We divided the red sequence galaxy sample into two groups according to their magnitude: a bright group (bright galaxies with F814W () mag), and a faint group (dwarf galaxies with F814W () mag). The number of galaxies detected in the innermost region ( 52 kpc) is too small for analysis so that only the number density profiles of the galaxies at are useful for analysis. In addition, we derived the radial mass density profile of Abell 2744 from the CATS model image (Jauzac et al., 2015) provided in the HFF. As the center for deriving the radial profiles, we adopted the center of CN-2 as in the case of the GC/UCDs.
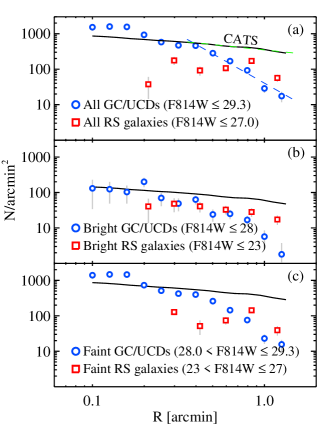
Figure 16 shows a few distinguishable features as follows. First, the radial number density profiles of the red sequence galaxies are almost flat in the outer region at , while the profile of the bright group decreases slowly as the clustercentric distance increases. It is noted that the radial number density profile of the GC/UCDs is much steeper than the profile of the red sequence galaxies. Second, the mass density radial profile of Abell 2744 derived from the CATS gravitational lensing models decreases slowly as the clustercentric distance increases. The slope of the mass density profile is much flatter than that of the radial number density profiles of the GC/UCDs. The logarithmic slope of the mass density profile for the outer region at is derived from the power fits to be . On the other hand, we derive from the number density profile of the GC/UCDs, which is 6 times steeper than that of the mass density profile. However, the mass density profile is consistent with that of the radial number density profiles of the red sequence galaxies in the outer region at . It is noted that, although the spatial distribution of the GC/UCDs shows a strong correlation with the mass density map (see Figure 15), the GC/UCDs show a significant difference in the radial distribution in the sense that the GC/UCDs show a much stronger central concentration. These results show that the radial distribution of the GC/UCDs in Abell 2744 is much steeper than the distribution of dark matter, which is consistent with the case of Abell 1689 (Alamo-Martínez et al., 2013). The radial distribution of the dwarf galaxies follows well that of dark matter.
4.3. The Origin of the UCDs
Since the discovery of UCDs, the origin of the UCDs has been controversial (Hilker, 2011; Norris et al., 2015; Norris & Kannappan, 2011; Bekki, 2015; Zhang et al., 2015; Liu et al., 2015; Janz et al., 2016). There are three types of scenarios suggested to explain the origin of the UCDs. First, the UCDs are just the massive end of the normal GCs (Murray, 2009; Chiboucas et al., 2011; Renaud et al., 2015). Second, they are the nuclei of dwarf galaxies that were stripped due to the tidal interaction with their host galaxies (Bekki et al., 2003; Pfeffer & Baumgardt, 2013; Pfeffer et al., 2014, 2016; Janz et al., 2016). Direct evidence for this scenario has been found recently by detection of the existence of supermassive black hole in some UCDs (Seth et al., 2014), and by finding that some UCDs show an extended star formation history (Norris et al. (2014), Ko et al. (2016, in preparation)). Metal-rich UCDs with young populations may be the remnants of a dissipative merger of two gas-rich dwarf galaxies (Bekki, 2015). Third, the UCDs are the remnants of primordial compact galaxies that have formed early around their host galaxies (Drinkwater et al., 2004). This was suggested to explain the fact that the spatial distribution of the UCDs in the Fornax cluster show a stronger central concentration than than of the dE galaxies. The origin of the UCDs may be a combination of these, rather than a single scenario (Norris et al., 2015; Norris & Kannappan, 2011; Pfeffer et al., 2016; Janz et al., 2016).
Recently Zhang et al. (2015) and Liu et al. (2015) studied the properties of 97 UCDs (with pc, mag, mag) in M87, a cD galaxy in Virgo, This is the largest sample of UCDs in a single galaxy. They found that there are significant differences in the radial number density profiles and the kinematics between the UCDs and the GCs in Virgo and that the mean color of the UCDs is consistent with that of the blue GCs. From this they concluded that the origin of most UCDs in Virgo is close to the nuclei of stripped dwarf galaxies, rather than to the massive end of the GCs. This conclusion is in strong contrast to the result for the UCDs in Coma that Chiboucas et al. (2011) concluded, that most UCDs in Coma are of the star cluster-origin, noting the similarity in the properties and spatial distribution of UCDs and GCs. Their sample of UCDs covers a similar magnitude range, mag.
In the discussion of compact stellar systems (with pc and ) in various galaxies and galaxy clusters, Norris et al. (2015) and Norris & Kannappan (2011) pointed out that there are two types of UCDs: star cluster-type UCDs and galaxy-type UCDs. The upper magnitude limit of star cluster type UCDs is mag (or ) . They noted that the LF of the UCDs and compact galaxies shows a break at mag. It is almost flat at the bright range ( mag), but it increases suddenly at the faint end ( mag) (see Figure 12 in Norris & Kannappan (2011)). The bright component represents galaxy-origin UCDs, while the faint one does star cluster-type UCDs. However, this is based on the sample made of heterogeneous data and the number of the sources brighter than mag is only a handful, as described by Norris & Kannappan (2011), so that it is only indicative, requiring further confirmation.
The LFs of GC/UCDs in Abell 2744 in this study (Figure 13) show a break at F814W mag, which corresponds to () mag. Thus this value is 0.6 magnitude fainter than mag, noted for the UCDs in the local universe (Norris et al., 2015; Norris & Kannappan, 2011). Our result based on the large sample of homogeneous data for Abell 2744 confirms the presence of the break, but at a 0.6 magnitude fainter value, mag. In addition, it is noted that the mean color of the faint dwarf galaxies with mag in Abell 2744 is similar to that of the UCDs/GCs.
In summary, there are three clues useful to understand the origin of the UCDs in Abell 2744 found in this study: (a) the presence of a break at mag in the LF of the UCD/GCs, (b) the radial number density profiles of the UCDs that are much steeper than those of the red sequence galaxies, and (c) the mean color of the faint red sequence galaxies that is similar to that of the UCDs. These clues support the hypothesis for the dual origin of the UCDs: bright UCDs are the nuclei of dwarf galaxies that were stripped when they passed the inner region of a galaxy cluster, while faint UCDs are the upper end of mass functions of the GCs.
5. SUMMARY AND CONCLUSION
We detected a large population of GCs, UCDs, and dwarf galaxies in the deep high resolution F814W and F105W images of the sourthern core of Abell 2744 in the HFF. We could estimate the background field contribution using photometry of the parallel field and the HXDF. Then we investigated the photometric properties of these sources in comparison with the results for the parallel field and the HXDF. To date, Abell 2744 at the redshift of is the most distant system where GCs and UCDs are studied in detail. Primary results are summarized as follows.
-
•
CMDs of the extended sources derived from deep F814W (restframe ) and F105W (restframe ) images of Abell 2744 show a red sequence reaching down to mag.
-
•
CMDs of the point sources in Abell 2744 show a rich population of point sources whose colors are similar to those of typical GCs. They are as bright as F814W () mag, and their color distribution shows a peak at (F814W-F105W). They are mostly bright GCs and UCDs in Abell 2744.
-
•
Th spatial distribution of the GCs and UCDs shows a strong central concentration to the brightest galaxies. This is consistent with the mass map based on gravitational lensing analysis (Jauzac et al., 2015; Wang et al., 2015). However, the radial number density profile of the GCs and UCDs is much steeper than the radial mass density profile based on gravitational lensing models (Jauzac et al., 2015; Wang et al., 2015). The mass density profile is consistent with the radial number density profile of the dwarf galaxies in Abell 2744.
- •
-
•
The number of UCDs with F814W mag in Abell 2744 is estimated to be . The number of GCs is derived to be , This value is even larger than that for Abell 1689, , given by Alamo-Martínez et al. (2013). Thus Abell 2744 hosts the largest number of GCs among the known systems.
-
•
The LF of the red sequence galaxies for a large range of magnitudes F814W () mag shows double components, with a dip at F814W () mag. The faint end of the red galaxy LF is fit well by a flat power law with , showing no faint upturn.
-
•
These results support the hypothesis for the dual origin of the UCDs: bright UCDs are nuclei of dwarf galaxies that were stripped when they passed the inner region of a galaxy cluster, while faint UCDs are massive GCs at the upper end in the mass function of the GCs.
The authors are grateful to John Blakeslee for providing their results on Abell 2744 presented at the AAS meeting, and to Brian Cho for his help in improving the English in the draft. This work was supported by the National Research Foundation of Korea (NRF) grant funded by the Korea Government (MSIP) (No. 2013R1A2A2A05005120). This work based on observations obtained with the NASA/ESA Hubble Space Telescope, retrieved from the Mikulski Archive for Space Telescopes (MAST) at the Space Telescope Science Institute (STScI). STScI is operated by the Association of Universities for Research in Astronomy, Inc. under NASA contract NAS 5-26555. This work also utilizes gravitational lensing models produced by PIs Bradac, Natarajan & Kneib (CATS), Merten & Zitrin, Sharon, and Williams, and the GLAFIC and Diego groups. This lens modeling was partially funded by the HST Frontier Fields program conducted by STScI. STScI is operated by the Association of Universities for Research in Astronomy, Inc. under NASA contract NAS 5-26555. The lens models were obtained from the Mikulski Archive for Space Telescopes (MAST).
References
- Agulli et al. (2014) Agulli, I., Aguerri, J. A. L., Sánchez-Janssen, R., et al. 2014, MNRAS, 444, L34
- Agulli et al. (2016) Agulli, I., Aguerri, J. A. L., Sánchez-Janssen, R., et al. 2016, MNRAS, 458, 1590
- Alamo-Martínez et al. (2013) Alamo-Martínez, K. A., Blakeslee, J. P., Jee, M. J., et al. 2013, ApJ, 775, 20
- Bañados et al. (2010) Bañados, E., Hung, L.-W., De Propris, R., & West, M. J. 2010, ApJ, 721, L14
- Barkhouse et al. (2007) Barkhouse, W. A., Yee, H. K. C., & López-Cruz, O. 2007, ApJ, 671, 1471
- Bekki et al. (2003) Bekki, K., Couch, W. J., Drinkwater, M. J., & Shioya, Y. 2003, MNRAS, 344, 399
- Bekki (2015) Bekki, K. 2015, ApJ, 812, L14
- Bertin & Arnouts (1996) Bertin, E., & Arnouts, S. 1996, A&AS, 117, 393
- Blakeslee et al. (2015) Blakeslee, J. P., Alamo-Martinez, K., Toloba, E., Barro, G., & Peng, E. W. 2015, American Astronomical Society Meeting Abstracts, 225, 252.09
- Boschin et al. (2006) Boschin, W., Girardi, M., Spolaor, M., & Barrena, R. 2006, A&A, 449, 461
- Boselli & Gavazzi (2014) Boselli, A., & Gavazzi, G. 2014, A&A Rev., 22, 74
- Cerulo et al. (2016) Cerulo, P., Couch, W. J., Lidman, C. et al. 2016, MNRAS, 457, 2209
- Chiboucas et al. (2011) Chiboucas, K., Tully, R. B., Marzke, R. O., et al. 2011, ApJ, 737, 86
- Couch & Newell (1984) Couch, W. J., & Newell, E. B. 1984, ApJS, 56, 143
- Couch & Sharples (1987) Couch, W. J., & Sharples, R. M. 1987, MNRAS, 229, 423
- Crawford et al. (2009) Crawford, S. M., Bershady, M. A., & Hoessel, J. G. 2009, ApJ, 690, 1158
- Davies et al. (2016) Davies, J. I., Davies, L. J. M., & Keenan, O. C. 2016, MNRAS, 456, 1607
- De Propris et al. (2013) De Propris, R., Phillipps, S., & Bremer, M. N. 2013, MNRAS, 434, 3469
- Drinkwater et al. (2004) Drinkwater, M. J., Gregg, M. D., Couch, W. J., et al. 2004, PASA, 21, 375
- Durrell et al. (2014) Durrell, P. R., Côté, P., Peng, E. W., et al. 2014, ApJ, 794, 103
- Ferrarese et al. (2012) Ferrarese, L., Côté, P., Cuillandre, J.-C., et al. 2012, ApJS, 200, 4
- Geisler et al. (1996) Geisler, D., Lee, M. G., & Kim, E. 1996, AJ, 111, 1529
- Giallongo et al. (2015) Giallongo, E., Menci, N., Grazian, A., et al. 2015, ApJ, 813, 68
- Girardi et al. (2000) Girardi, L., Bressan, A., Bertelli, G., & Chiosi, C. 2000, A&AS, 141, 371
- Govoni et al. (2001) Govoni, F., Feretti, L., Giovannini, G., et al. 2001, A&A, 376, 803
- Graham & Driver (2005) Graham, A. W., & Driver, S. P. 2005, PASA, 22, 118
- Harris et al. (2009) Harris, W. E., Kavelaars, J. J., Hanes, D. A., Pritchet, C. J., & Baum, W. A. 2009, AJ, 137, 3314
- Harris et al. (2014) Harris, W. E., Morningstar, W., Gnedin, O. Y., et al. 2014, ApJ, 797, 128
- Harris et al. (2016) Harris, W. E., Blakeslee, J. P., Whitmore, B. C., et al. 2016, ApJ, 817, 58
- Harsono & De Propris (2009) Harsono, D., & De Propris, R. 2009, AJ, 137, 3091
- Hilker et al. (2003) Hilker, M., Mieske, S., & Infante, L. 2003, A&A, 397, L9
- Hilker (2011) Hilker, M. 2011, EAS Publications Series, 48, 219
- Illingworth et al. (2013) Illingworth, G. D., Magee, D., Oesch, P. A., et al. 2013, ApJS, 209, 6
- Janz et al. (2016) Janz, J., Norris, M. A., Forbes, D. A., et al. 2016, MNRAS, 456, 617
- Jauzac et al. (2015) Jauzac, M., Richard, J., Jullo, E., et al. 2015, MNRAS, 452, 1437
- Jerjen & Tammann (1997) Jerjen, H., & Tammann, G. A. 1997, A&A, 321, 713
- Johnston (2011) Johnston, R. 2011, A&A Rev., 19, 41
- Koekemoer et al. (2014) Koekemoer, A. M., Avila, R. J., Hammer, D., et al. 2014, American Astronomical Society Meeting Abstracts #223, 223, 254.02
- Lam et al. (2014) Lam, D., Broadhurst, T., Diego, J. M., et al. 2014, ApJ, 797, 98
- Lan et al. (2016) Lan, T.-W., Ménard, B., & Mo, H. 2016, MNRAS, 695
- Lee & Geisler (1993) Lee, M. G., & Geisler, D. 1993, AJ, 106, 493
- Lee et al. (2010) Lee, M. G., Park, H. S., & Hwang, H. S. 2010, Science, 328, 334
- Lee & Jang (2016) Lee, M. G., & Jang, I. S. 2016, ApJ, in press
- Lee et al. (2016) Lee, Y., Rey, S.-C., Hilker, M., Sheen, Y.-K.; Yi, S.K. 2016, ApJ, in press (arXiv16031556)
- Lieder et al. (2012) Lieder, S., Lisker, T., Hilker, M., Misgeld, I., & Durrell, P. 2012, A&A, 538, A69
- Liu et al. (2015) Liu, C., Peng, E. W., Côté, P., et al. 2015, ApJ, 812, 34
- Lotz et al. (2014) Lotz, J., Mountain, M., Grogin, N. A., et al. 2014, American Astronomical Society Meeting Abstracts #223, 223, 254.01
- Loveday (1997) Loveday, J. 1997, ApJ, 489, 29
- Lu et al. (2015) Lu, Z., Mo, H. J., Lu, Y., et al. 2015, MNRAS, 450, 1604
- Martinet et al. (2015) Martinet, N., Durret, F., Guennou, L., et al. 2015, A&A, 575, A116
- Medezinski et al. (2016) Medezinski, E., Umetsu, K., Okabe, N., et al. 2016, ApJ, 817, 24
- Mercurio et al. (2006) Mercurio, A., Merluzzi, P., Haines, C. P. et al. 2006, MNRAS, 368, 109
- Merten et al. (2011) Merten, J., Coe, D., Dupke, R., et al. 2011, MNRAS, 417, 333
- Mieske et al. (2004) Mieske, S., Infante, L., Benítez, N., et al. 2004, AJ, 128, 1529
- Miles et al. (2004) Miles, T. A., Raychaudhury, S., Forbes, D. A. et al. 2004, MNRAS, 355, 785
- Milne et al. (2007) Milne, M. L., Pritchet, C. J., Poole, G. B., et al. 2007, AJ, 133, 177
- Misgeld et al. (2008) Misgeld, I., Mieske, S., & Hilker, M. 2008, A&A, 486, 697
- Misgeld et al. (2009) Misgeld, I., Hilker, M., & Mieske, S. 2009, A&A, 496, 683
- Montes & Trujillo (2014) Montes, M., & Trujillo, I. 2014, ApJ, 794, 137
- Moretti et al. (2015) Moretti, A., Bettoni, D., Poggianti, B. M., et al. 2015, A&A, 581, A11
- Murray (2009) Murray, N. 2009, ApJ, 691, 946
- Norris et al. (2015) Norris, M. A., Escudero, C. G., Faifer, F. R., et al. 2015, MNRAS, 451, 3615
- Norris & Kannappan (2011) Norris, M. A., & Kannappan, S. J. 2011, MNRAS, 414, 739
- Norris et al. (2014) Norris, M. A., Kannappan, S. J., Forbes, D. A., et al. 2014, MNRAS, 443, 1151
- Orrú et al. (2007) Orrú, E., Murgia, M., Feretti, L., et al. 2007, A&A, 467, 943
- Owers et al. (2011) Owers, M. S., Randall, S. W., Nulsen, P. E. J., et al. 2011, ApJ, 728, 27
- Owers et al. (2012) Owers, M. S., Couch, W. J., Nulsen, P. E. J., & Randall, S. W. 2012, ApJ, 750, L23
- Paraficz et al. (2012) Paraficz, D., Kneib, J.-P., Richard, J., et al. 2012, arXiv:1209.0384
- Peng et al. (2011) Peng, E. W., Ferguson, H. C., Goudfrooij, P., et al. 2011, ApJ, 730, 23
- Pfeffer & Baumgardt (2013) Pfeffer, J., & Baumgardt, H. 2013, MNRAS, 433, 1997
- Pfeffer et al. (2014) Pfeffer, J., Griffen, B. F., Baumgardt, H., & Hilker, M. 2014, MNRAS, 444, 3670
- Pfeffer et al. (2016) Pfeffer, J., Hilker, M., Baumgardt, H., & Griffen, B. F. 2016, MNRAS, 458, 2492
- Popesso et al. (2006) Popesso, P., Biviano, A., Böhringer, H., & Romaniello, M. 2006, A&A, 445, 29
- Rawle et al. (2014) Rawle, T. D., Altieri, B., Egami, E., et al. 2014, MNRAS, 442, 196
- Rejkuba (2012) Rejkuba, M. 2012, Ap&SS, 341, 195
- Renaud et al. (2015) Renaud, F., Bournaud, F., & Duc, P.-A. 2015, MNRAS, 446, 2038
- Richard et al. (2014) Richard, J., Jauzac, M., Limousin, M., et al. 2014, MNRAS, 444, 268
- Rines & Geller (2008) Rines, K., & Geller, M. J. 2008, AJ, 135, 1837
- Schaeffer & Silk (1988) Schaeffer, R., & Silk, J. 1988, A&A, 203, 273
- Schechter (1976) Schechter, P. 1976, ApJ, 203, 297
- Schlafly & Finkbeiner (2011) Schlafly, E. F., & Finkbeiner, D. P. 2011, ApJ, 737, 103
- Sérsic (1963) Sérsic, J. L. 1963, Boletin de la Asociacion Argentina de Astronomia La Plata Argentina, 6, 41
- Seth et al. (2014) Seth, A. C., van den Bosch, R., Mieske, S., et al. 2014, Nature, 513, 398
- Stetson (1987) Stetson, P. B. 1987, PASP, 99, 191
- Stetson (1994) Stetson, P. B. 1994, PASP, 106, 250
- Struble & Rood (1999) Struble, M. F., & Rood, H. J. 1999, ApJS, 125, 35
- Wang et al. (2015) Wang, X., Hoag, A., Huang, K.-H., et al. 2015, ApJ, 811, 29
- Yamanoi et al. (2012) Yamanoi, H., Komiyama, Y., Yagi, M., et al. 2012, AJ, 144, 40
- Zhang et al. (2015) Zhang, H.-X., Peng, E. W., Côté, P., et al. 2015, ApJ, 802, 30