Small-World Brain Networks Revisited
Abstract
It is nearly 20 years since the concept of a small-world network was first quantitatively defined, by a combination of high clustering and short path length; and about 10 years since this metric of complex network topology began to be widely applied to analysis of neuroimaging and other neuroscience data as part of the rapid growth of the new field of connectomics. Here we review briefly the foundational concepts of graph theoretical estimation and generation of small-world networks. We take stock of some of the key developments in the field in the past decade and we consider in some detail the implications of recent studies using high-resolution tract-tracing methods to map the anatomical networks of the macaque and the mouse. In doing so, we draw attention to the important methodological distinction between topological analysis of binary or unweighted graphs, which have provided a popular but simple approach to brain network analysis in the past, and the topology of weighted graphs, which retain more biologically relevant information and are more appropriate to the increasingly sophisticated data on brain connectivity emerging from contemporary tract-tracing and other imaging studies. We conclude by highlighting some possible future trends in the further development of weighted small-worldness as part of a deeper and broader understanding of the topology and the functional value of the strong and weak links between areas of mammalian cortex.
Small-worlds, Watts and Strogatz
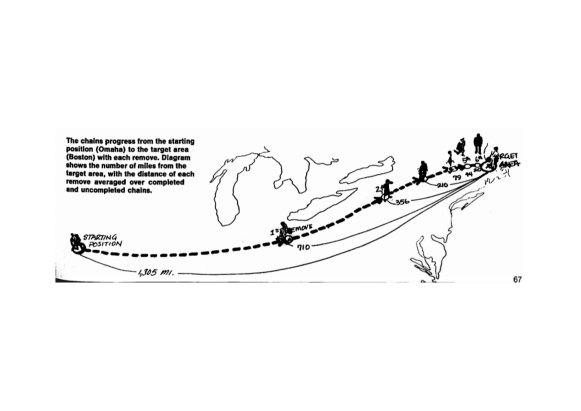
Small-worldness now seems to be a ubiquitous characteristic of many complex systems; but its first, and still most familiar, appearance was in the form of social networks. We know that as individual agents (nodes) in a social network, we are connected by strong familial and friendship ties (edges) to a relatively few people who are likely also strongly connected to each other, forming a social clique, family or tribe. Yet we also know that we can travel far away from our tribal network, to physically remote cultures and places, and sometimes be surprised there to meet people – often “friends-of-friends” – who are quite closely connected to our home tribe: “it’s a small world”, we say. This common intuition was experimentally investigated by Milgram, who asked people in the mid-West of the US (Omaha, Nebraska) to forward a letter addressed to an unknown individual in Boston by posting it to the friend or acquaintance in their social network that they thought might know someone else who would know the addressee Milgram1967 (Fig. 1). It was discovered, on average over multiple trials of this procedure, that the letters successfully reaching Boston had been passed through 6 intermediate postings, which was considered much less than expected given the geographical distance between source and target addresses. In the language of graph theory, the characteristic path length of Milgram’s social networks was short.
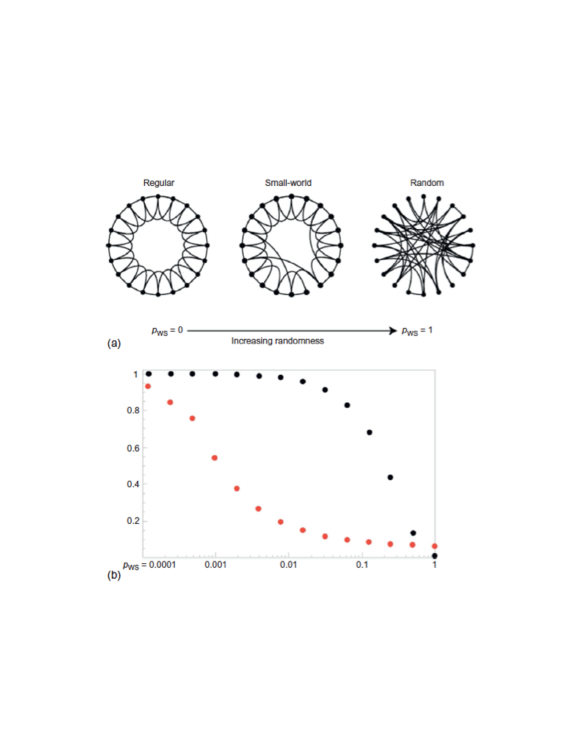
Famously, Watts & Strogatz (1998) watts1998collective combined this concept of path length (the minimum number of edges needed to make a connection between nodes) with a measure of topological clustering or cliquishness of edges between nodes (Fig. 2). More formally, clustering measures the probability that the nodes and , which are both directly connected to node , are also directly connected to each other; this is equivalent to measuring the proportion of closed triangular 3-node motifs in a network sporns2004 . Watts & Strogatz (WS) explored the behaviour of path length and clustering in a simple generative model (henceforth the WS model) (Fig. 3). Starting with a binary lattice network of nodes each connected to the same number of nearest neighbors, by edges of identical weight (unity), the WS model iteratively re-wires the lattice by randomly deleting an existing edge, between nodes and , and replacing it by a new edge between node and any node . They found that as the probability of random rewiring was incrementally increased from zero, so that the original lattice was progressively randomised, sparsely rewired networks demonstrated both high clustering (like a lattice) and short path length (like a random graph). By analogy to social networks, these algorithmically generated graphs were called small-world networks.
In addition to introducing this generative model, Watts & Strogatz also showed how small-worldness could be estimated in naturally occurring networks watts1998collective . The hybrid combination of high clustering and short path length that emerged in sparsely re-wired WS networks was proposed as a general quantitative measure of small-worldness (SW) in other networks. It was shown immediately that a nervous system was among the real-world networks that shared the SW pattern of topological organisation. Using data on the synaptic and gap junction connectivity between all neurons in the nervous system of Caenorhabditis elegans white1986structure , a binary undirected graph was constructed representing each neuron as an identical node and each synapse () or gap junction () as an identical, unweighted and undirected edge between nodes. This graph of about 5600 edges between 302 nodes was sparsely connected: only about 12% of the maximum possible number of synaptic connections, , actually existed. Compared to a random graph of nodes, C elegans had high clustering and short path length . Thus the C. elegans connectome was small-world, in the same quantitative sense as the networks generated by the WS model at low re-wiring probabilities, less than 10%. But note that does not necessarily mean that the C. elegans connectome was biologically generated by the WS algorithm of random rewiring of established connections (axonal projections) between neurons. To put it another way, the WS model can generate SW networks but not all SW networks were generated by a WS model. (And the WS model does not seem like a biologically plausible generative model for brain networks vertes2012simple ; vertes2014generative ; betzel2016generative .)
Small-world brain graphs
Following the small-world analysis of C elegans, pioneering topological studies of mammalian cortical networks used databases of tract-tracing experiments to demonstrate that the cat and macaque inter-areal anatomical networks shared similar small-world properties of short path length and high clustering sporns2004small ; hilgetag2004clustered . The first graph theoretical studies of neuroimaging data demonstrated that large-scale inter-areal networks of functional and structural connectivity in the human brain also had small-world properties salvador2005neurophysiological ; bassett2006adaptive ; vaessen2010effect . These and other seminal discoveries were central to the emergence of connectomics as a major growth point of network neuroscience sporns2005human .
About 10 years ago, we reviewed these and other data in support of the idea that the brain is a small world network bassett2006small . Here, we aim to take another look at the concept of small-worldness, about one or two decades since it was first formulated quantitatively and applied to brain network analysis at microscopic and macroscopic scales of anatomical resolution. First, we review some of the key questions about small-worldness that have been a focus of work in the period 2006–2016; then we review the technical evidence for small-worldness in high resolution tract-tracing data from the macaque and the mouse; finally, we highlight some likely trends in the further evolution of small-worldness as part of a deeper understanding of the topology of weighted brain graphs.
What have we (not) learnt since 2006?
We have learnt a lot about complex topological organisation of nervous systems since 2006, as evidenced by rapid growth in research articles, reviews and citations related to“brain graphs” and “connectomes” bullmore2009complex ; bullmore2011brain ; pessoa2014understanding ; by the publication of several textbooks sporns2011networks ; fornito2016fundamentals ; and by the recent launch of new specialist journals for network neuroscience bassett2016network . This emerging field of brain topology has grown much bigger than the foundational concept of small-worldness. But what have we learnt more specifically about brain small-worldness since 2006, and what do we still have to learn?
Universality
There is no doubt that small-worldness – the combination of non-random clustering with near-random path length – has been very frequently reported across a wide range of neuroscience studies. Small-world topology has been highly replicated across multiple species and scales from structural and functional MRI studies of large scale brain networks in humans to multi-electrode array recordings of cellular networks in cultures bettencourt2007functional and intact animals van2016comparative . It seems reasonable to conclude that small-worldness is at least very common in network neuroscience; but is it a universal property of nervous systems? Universality is a strong claim and difficult to affirm conclusively. As Popper noted in his philosophy of science by hypothetical refutation popper1963 , the universal hypothesis that “all swans are white” can only be affirmed conclusively by a complete survey of every swan in the world. Whereas it can be immediately and decisively refuted by the observation of a single black swan. Similarly, the claim that all brains have small-world topology has not yet been (and never will be) affirmed by a complete connectomic mapping of every brain in the world. Some apparent counter-examples of brain networks that do not have small-world topology have been reported and deserve careful consideration as possible Popperian black swans (see below). However, we can provisionally conclude that enough evidence has amassed to judge that small-worldness is a nearly universal property of nervous systems. Indeed it seems likely that brains are only one of a large “universality class” of small-world networks comprising also many other non-neural or non-biological complex systems. Such near-universality of small-worldness, or any other brain network parameter, has a number of implications.
First, near-universality implies self-similarity. If the macro-scale inter-areal network of the human brain is small-world, as is the micro-scale inter-neuronal network of the worm or the fly, then we should expect also that the micro-scale inter-neuronal network of the human brain is small-world. Self-similarity of small-worldness would be indexed by scale invariance of network path length and clustering parameters as the anatomical resolution “zooms in” from macro- to micro-scales. Although there is abundant evidence for scaling, fractal or self-similar statistics in many aspects of brain network topology bullmore2009generic ; bassett2010efficient ; klimm2014resolving , experimental data do not yet exist that could support a multi-scale, macro-to-micro analysis of small-worldness (and other network properties) in the same (human or mammalian) nervous system bassett2013multiscale .
Second, near-universality suggests some very general selection pressures might be operative on the evolution and development of nervous systems across scales and species. This line of thinking has led to the formulation of generative models that can simulate brain networks by some probabilistic growth rule or genetic algorithm. It has been found that simple generative models, that add edges to a network based on the spatial distance and the topological relationships between nodes, can recapitulate small-worldness and many other properties of the connectome on the basis of two (spatial and topological) parameters vertes2012simple ; vertes2014generative ; betzel2016generative . This serves as a reminder that the network phenotype of small-worldness can be generated by many different mechanisms and the biological mechanisms controlling formation of small-world properties in brain networks currently remain unknown.
Third, and from a somewhat more controversial perspective, universality might seem tantamount to triviality. If the brain is everywhere small-world, and so are almost all other complex systems in real-life bassett2006small ; bullmore2009generic ; gaiteri2014beyond ; moslonka2011networks ; sizemore2016classification (for a few exceptions, see koschutzki2010structural ), then what is the small-worldness of the brain telling us that’s of any interest specifically to neuroscience? There are two main answers to this important question, as we discuss in more detail below: (i) studies have recently succeeded in linking network topological metrics to biological concepts, like wiring cost bullmore2012economy ; bassett2010efficient ; bassett2011conserved ; rubinov2015wiring , and to biological phenotypes, like neuronal density acimovic2015effects ; vandenheuvel2015bridging or gene expression fulcher2016transcriptional ; vertes2016philtrans; whitaker2016pnas; and (ii) small-worldness is not the whole story of brain network organisation wang2016brain .
Economical small-world networks
At the risk of stating the obvious, small-worldness is a purely topological quantity that tells us nothing about the physical layout of the nodes or edges that constitute the graph bassett2010efficient ; pessoa2014understanding . However, it is equally obvious that brain networks are embedded in anatomical space klimm2014resolving ; lohse2014resolving ; bassett2011conserved ; betzel2016modular. Somehow the abstract, dimensionless topology of small-worldness must be reconciled to the anatomy of the brain. It turns out that the small-world topology of brain networks is (almost) always economically embedded in physical space bullmore2012economy ; kaiser2006nonoptimal .
For both clustering and path length, the two topological metrics combined in the hybrid small-world estimator, there is a strong relationship with brain anatomical space bassett2010efficient ; bassett2011conserved ; rubinov2015wiring . The edges between clustered nodes tend to be shorter distance whereas the edges that mediate topological short cuts tend to traverse longer anatomical distances. Interpreting the Euclidean distance between brain regional nodes or neurons as a proxy for the wiring cost, i.e., the total biological cost of building a physical connection and maintaining communication between nodes, it has been argued that the brain is an economical small-world network latora2001efficient ; bullmore2012economy . Economical in this sense does not simply mean parsimonious or cheap; it is more closely related to the common-sense notion of “value for money”. Topologically clustered nodes are anatomically co-located and thereby nearly minimise wiring cost. But small-world brain networks are not naturally lattices and if they are computationally rewired strictly to minimise wiring cost then brain networks are topologically penalised, losing integrative capacity indexed by increased characteristic path length and thus reduced small-worldness scalar .
The economical idea is that brain networks have been selected by the competition between a pressure to minimise biological cost versus a pressure to maximise topological integration. More formally,
| (1) |
the probability of a connection between nodes and , , is a product of: a function of the physical distance in mm between nodes - often used as a proxy for wiring cost; and a function of the topological relationship between nodes - .
Typically the functions of cost and topology are each parameterised by a single parameter, for example, simple exponential and power law functions. Several variants of this approach have been published, exploring a range of different topological relationships between nodes, for example, clustering and homophily vertes2012simple ; vertes2014generative ; betzel2016generative . Economical models can generally reproduce the small world properties of brain networks quite realistically: clustering and path length are both increased as a function of the cost parameter avena2014using . In other words, as the cost penalty becomes the dominant factor predicting the probability of a connection between nodes, economical models generate increasingly lattice-like networks, with strong spatial and topological clustering of connected nodes, approximating in the limit the minimal cost configuration of the network. The emergence of more integrative network features – such as hubs mediating many inter-modular connections – typically depends on some degree of relaxation of the cost penalty (reduced distance parameter) relative to the parameter controlling the importance of (integrative) topological relationships between nodes in predicting their connectivity. Thus small world networks can be generated by economical models for a certain range of the two parameters controlling the competitive factors of (wiring) cost and (topological) value.
Small-worldness is not the whole story
Before getting further into the details of small-worldness, as we do below in relation to recent tract-tracing results, it is important to acknowledge that the specific metrics of path length and clustering introduced by Watts & Strogatz watts1998collective , and the small-worldness scalar derived from them humphries2006brainstem , are a few global topological metrics that have been of central importance to the growth of complex network science generally. But more than 15 years after the first discovery of small world properties in brain networks, the field of connectomics now extends into many other areas of topological analysis. There is much important recent work on topological properties like degree distribution and hubness achard2006resilient , modularity simon1962architecture ; meunier2009age ; chen2008revealing ; sporns2016modular ; bassett2011dynamic ; mattar2015functional ; stoop2013beyond , core/periphery organisation bassett2013task ; senden2014rich ; van2011rich , controllability gu2015controllability ; muldoon2016stimulation ; betzel2016optimally and navigability gulyas2015navigable that are not simply related to small-worldness. Outside neuroscience there continues to be strong growth in the more general field of network science barabasi2016book. It is nothing like a complete description of the brain to say it is small-world; we now turn to a more technical discussion of the evidence for small-worldness as a common property of nervous systems.
Challenges to small-worldness
About 3–4 years ago, an important series of papers began to be published that could be regarded as “black swans” refuting the general importance of small-worldness in an understanding of brain networks markov2012cerebcortex ; markov2013cortical ; song2014spatial ; knoblaugh2016 :
Previous studies of low density inter-areal graphs and apparent small-world properties are challenged by data that reveal high-density cortical graphs in which economy of connections is achieved by weight heterogeneity and distance-weight correlations. markov2013cortical
Recent connectomic tract tracing reveals that, contrary to what was previously thought, the cortical inter-areal network has high density. This finding leads to a necessary revision of the relevance of some of the graph theoretical notions, such as the small world property…, that have been claimed to characterise the inter-areal cortical network. knoblaugh2016
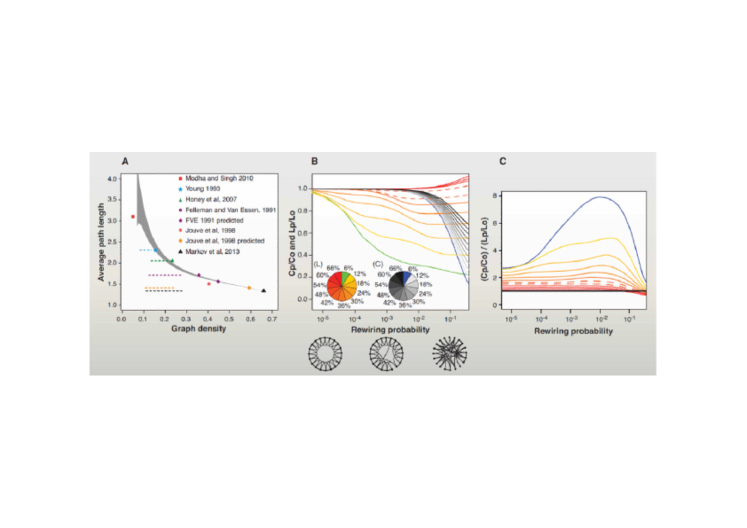
These remarks carried weight because they were based on sophisticated and highly sensitive measurements of mammalian cortical connectivity (Fig. 4). In each one of multiple carefully standardised experiments in the macaque monkey, a fluorescent tracer was injected into a (target) cortical region where it was taken up by synaptic terminals and actively transported to the cell bodies of neurons projecting to the target region. When the animal’s brain was subsequently examined microscopically, the retrograde transport of the tracer from the injection site resulted in a fluorescent signal in the (source) regions of cortex that were directly connected to the target region. The basic technology of anatomical tract-tracing had been used by neuroanatomists since the late 20th century; but in the first decades of the 21st century it was possible to increase the scale and precision of the measurements dramatically, enabling the construction of connectivity matrices that summarised the strength or weight of axonal projections between a large number of cortical areas. These next-generation tract-tracing data thus represented a new standard of knowledge about mammalian cortical connectivity, that was more continuously quantified than the binary or ordinal rating of connectivity from traditional tract-tracing experiments stephan2001cocomac , and much less ambiguously related to the cellular substrates of brain networks than the statistical measures of functional connectivity achard2006resilient ; zhang2016choosing and structural covariance bassett2008hierarchical ; alexander2013imaging used to build graphs from human neuroimaging data. It is clearly important to understand in some detail how the topology of brain networks can be modelled in contemporary tract-tracing data from the macaque (and subsequently the mouse oh2014mesoscale ; rubinov2015wiring ) and what these results tell us about the small-worldness of brain networks.
Binary graphs
In general, a node represents a component of a system and an edge represents a connection or interaction between two nodes. Mathematically, we can capture these ideas with a graph composed of a node set and an edge set bollobas1979graph ; bollobas1985random . We store this information in an association or weight matrix , whose element indicates the strength or weight of the edge between node and node . A simple way of building a graph from such an association matrix is to apply a threshold to each element of the matrix, such that if then an edge is drawn between the corresponding nodes, but if no edge is drawn achard2006resilient . This thresholding operation thus binarizes the weight matrix and converts the continuously variable edge weights to either 1 (supra-threshold) or 0 (sub-threshold). It was on this basis that almost all brain graphs were constructed in the 15 years or so following the seminal small-world analysis of a binary graph representing the cellular connectome of C. elegans watts1998collective . Most of the neuroimaging evidence for small-worldness in human brain networks, for example, is based on analysis of binary graphs constructed by thresholding a correlation coefficient or equivalent estimator of the weight of functional or structural connectivity or structural covariance between regions and wijk2010comparing . It is well recognised that construction of binary graphs represents an extreme simplification of brain networks; indeed a binary undirected graph of homogenous nodes is as simple as it gets in graph theory bassett2012altered . However, this approach has historically been preferred in neuroimaging because of limited signal-to-noise ratio in the data achard2006resilient .
By varying the threshold used to construct a binary graph from a continuous weight matrix, the connection density of the network is made denser or sparser. If the threshold is low and many weak weights are added to the graph as edges then the connection density will increase; if the threshold is high and only the strongest weights are represented as edges, then the connection density will decrease. The connection density is quantified by the number of edges in the graph as a proportion of the total number of edges in a fully connected network of the same number of nodes :
| (2) |
Often, this proportion is translated into a percentage. In many neuroimaging studies, the threshold is set to a large value to control for the high levels of noise in MRI data, resulting in connection densities in the range lynall2010functional . In many of the first generation tract tracing studies, the connectivity data were collected on a binary or ordinal scale, and not all possible connections had been been experimentally measured, so these data were naturally modelled as binary graphs with connection densities , a value that was constrained by the completeness and quality of the data bassett2006small .
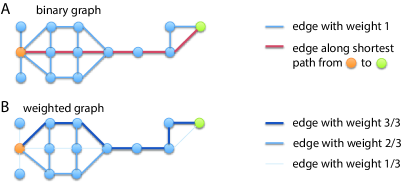
The small-world topology of a binary brain graph is defined by estimating two parameters in the data, path length and clustering (Fig. 2A), and comparing each of these observed parameters to their distributions under a specified null model humphries2006brainstem . More specifically,
| (3) |
is the global or characteristic path length, where is the shortest path (geodesic) between nodes and ; and
| (4) |
is the global clustering coefficient, where is the number of closed triangular motifs including node . Each of these parameters is normalised by its value in a binary graph representing the null hypothesis. For example, if the null hypothesis is that clustering of brain networks is no different from the clustering of a random graph, then it is reasonable to generate an Erdös-Renyí graph for nodes and connection density, measure the clustering coefficient in the random graph , and use the ratio between brain and random graph clustering coefficients as a test statistic for non-random clustering. We note that there are many other possible ways in which a null model could be sampled, besides using the classical Erdös-Renyí model, and this is an active area of methodological research muldoon2016small ; betzel2016modular. However, in general one can define the normalized clustering coefficient as
| (5) |
Likewise, the path length of the brain graph can be normalised by its value in a comparable random graph
| (6) |
A small-worldness scalar can then be simply defined as
| (7) |
With these definitions, small-world networks will have , and humphries2006brainstem .
Weighted graphs
Although binary graph analysis has predominated to date in analysis of brain networks, this certainly does not represent the methodological limit of graph theory for connectomics. For example, provided the data are of sufficient quality, there is no need to threshold the weight matrix to estimate topological properties like clustering, path length and small-worldness. Indeed, while the binarization procedure was common in early applications of graph theory to neural data wijk2010comparing , it remains fundamentally agnostic to architectural principles that may be encoded in edge weights rubinov2011weight . This realization has more generally motivated the field to develop methods that remain sensitive to the patterns of weights on the edges ginestet2011brain , and to the topologies present in weak versus strong weights rubinov2011weight . These efforts have included the development of alternative thresholding schemes bassett2012altered ; lohse2014resolving and fully weighted graph analysis rubinov2011weight ; bassett2011dynamic .
The mathematical tools exist to estimate and simulate the topological properties of weighted networks, and analysis of weighted networks is akin to studying the geometry of the graph, rather than simply its topology bassett2012influence ; bassett2013task . For example, weighted analogues of binary metrics of clustering, path length and small-worldness can be defined formally (Fig. 2B). First, the weighted clustering coefficient of node can be defined as
| (8) |
where is the number of edges connected to node , or degree of node Onnela:2005de (but see also Barrat:2004bk ; Zhang:2005er for other similar definitions). The weighted path length can be defined as
| (9) |
where the topological distance between two nodes is given by Newman:2001kc . These two statistics can be combined to construct a weighted metric of small-worldness bolanos2013weighted :
| (10) |
With these definitions, small-world networks will have , and , humphries2006brainstem .
The small-world propensity
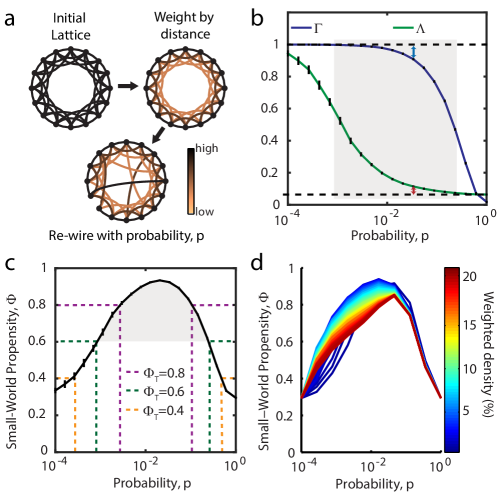
There are several important limitations to the definitions of small-worldness described in the previous sections. First, the small-world scalar (whether binary or weighted) can be greater than 1 even in cases when the normalized path-length is much greater than one; because it is defined as a ratio, if , the scalar . This means that a small-world network will always have , but not all networks with will be small-world. Second, the measure is strongly driven by the density of the graph, and denser networks will more naturally have smaller values of even if they are in fact generated from an identical small-world model. To address these and other limitations, Muldoon and colleagues recently developed a metric called the small-world propensity. Specifically, the small-world propensity, , reflects the deviation of a network’s clustering coefficient, , and characteristic path length, , from both lattice (, ) and random (, ) networks constructed with the same number of nodes and the same degree distribution:
| (11) |
where
| (12) |
and
| (13) |
The ratio represents the fractional deviation of the metric ( or ) from its respective null model (a lattice or random network). This quantity can be calculated for binary networks (using binary definitions of clustering and path length) or for weighted networks (using weighted definitions of clustering and path-length). Networks are considered small-world if they have small-world propensity . However, this metric should be viewed as a continuous metric of small-worldness rather than a hard threshold muldoon2016small .
Importantly, the small-world propensity overcomes several limitations of previous scalar definitions of small-worldness muldoon2016small . First, it can incorporate weighted estimates of both the clustering coefficient and path-length, thus being generally applicable to any neural data that can be represented as a weighted network. Second, it is density-independent, meaning that it can be used to compare the relative small-worldness between two networks that have very different densities from one another. Third, the metric is informed by spatially-constrained null models expert2011uncovering ; bassett2015extraction ; papadopoulos2016evolution in which nodes have physical locations and the edges that correspond to the smallest Euclidean distance between nodes are assigned the highest weights barthelemy2011spatial (Fig 5).
21st century tract-tracing
The scale and quality of contemporary tract-tracing data, in both the macaque and the mouse, represents a quantitative change in terms of sensitivity in detecting anatomical connections, or axonal projections, between cortical areas. Using retrograde tracer experiments it has proven possible to demonstrate reliably that pairs of regions in the macaque brain may be connected by one or a few axonal projections. Likewise anterograde tracer experiments in the mouse have demonstrated that the minimal detectable weight of connectivity between cortical regions, that just exceeds the noise threshold, is equivalent to the projection of one or a few axons ypma2016 . This high sensitivity has led immediately to the recognition of a large number of weak and previously unreported axonal connections. In the macaque, it was estimated that 36% of connections identified by contemporary tract tracing were so-called new found projections (NFP) that had not been described in the prior literature markov2014weighted . The existence of so many weak connections is reflected in the log normal distributions of connectivity weight, ranging over 5–6 orders of magnitude, in both the macaque and the mouse oh2014mesoscale ; ercsey2013predictive . In short, tract-tracing can now resolve connections approximately equivalent to a single axonal projection and approximately a million times weaker than the strongest anatomical connections or white matter tracts.
How can we use graph theory to model the network organisation of such highly sensitive, highly variable data? Perhaps the simplest approach, borrowing from prior studies of less high quality datasets, is to apply a threshold and convert the log-normal weight matrix into a binary adjacency matrix. If the threshold is defined by the noise distribution of the measurements then it will be very close to zero for these sophisticated experiments, and correspondingly the connection density of the binary graph will be high. In the macaque, the connection density of a binary graph of 29 visual cortical areas was estimated to be 66% markov2013cortical , considerably higher than historical estimates in the range felleman1991distributed . In the mouse, the connection density of a binary graph of 308 areas of the whole cortex was estimated to be 53% rubinov2015wiring .
In other words, the binary graphs generated from 21st century tract-tracing data are about twice as dense as the much sparser networks derived from human neuroimaging and 20th century tract-tracing. They are also considerably denser than brain networks constructed at a finer grained (ultimately cellular) resolution. For example, the connection density of the C elegans nervous system, which is still the only completely mapped synaptic connectome, is about 12%. It is easy to see that the connection density of a binary network depends on the number of neurons comprising each node. In the limit, if the nervous system is parcellated into two large nodes the connection density will certainly be 100%; as the same system is parcellated into a larger number of smaller nodes its connection density will monotonically decrease bassett2011conserved ; zaleksy2010whole . Thus the current interval estimate of mammalian cortical connection density is conditional both on the anatomical resolution of the parcellation scheme used to define the nodes and the sensitivity of the tract-tracing methods used to estimate the weights of the edges.
Small-worldness of binary tract-tracing networks
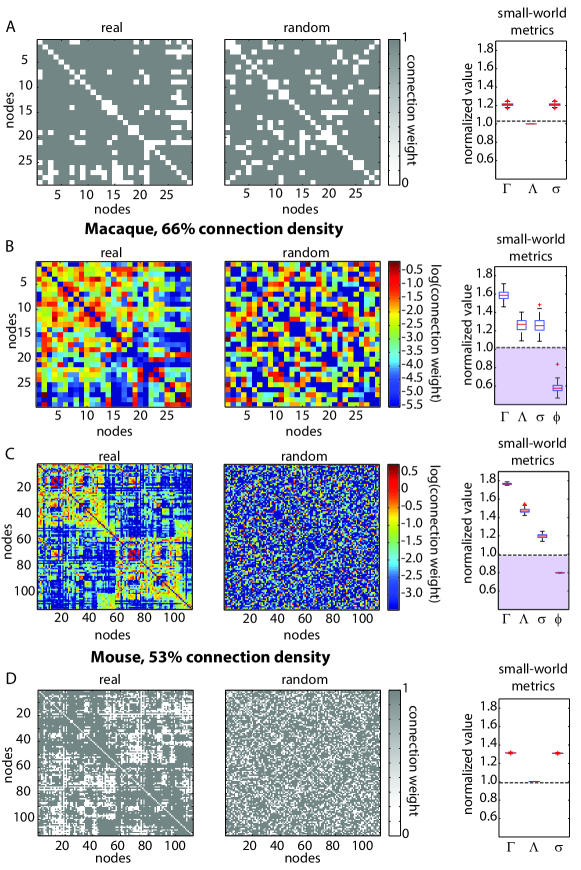
Having constructed a high density binary graph from tract-tracing data on mammalian cortex, it is straightforward to estimate its clustering and path length, using the same metrics as for sparser binary graphs. However, simply because there is a larger number of connections in the denser network, its clustering will be considerably higher (there will be more closed triangular motifs) and its path length will be shorter (there will be more direct, pair-wise connections) than a sparser network. Indeed the clustering and path length of any binary graph at connection density will be close to the maximal clustering and minimal path length of a fully connected graph; and therefore the clustering and path length of a 60% dense brain network will be very similar to the clustering and path length of a 60% random network bassett2009cognitive .
This means that when clustering and path length in brain networks are normalised by their corresponding values in equally dense random networks, the scaled metrics and will both be close to 1, and the small-world scalar will be close to its critical value of 1 markov2013cortical . For the macaque, at 66% connection density, , , and ; for the mouse, at 53% connection density, , , and (all given in mean standard deviation; Fig. 6A,C; Table 1). Since small-worldness has been traditionally defined as , these results suggest that dense binary graphs constructed from tract tracing data are small-world, although the macaque is more similar to a random network than the mouse.
| Macaque | Mouse | |||
| Binary | Weighted | Binary | Weighted | |
| N/A | N/A |
These results do not look like a “black swan” that refutes universal claims that the brain always embodies small-world network topology. Nor do they undermine the credibility of previous studies demonstrating small-worldness in sparser brain graphs. However, our view is that binary graph models are very unlikely to be an optimal strategy for network analysis of tract-tracing data, because they fail to take account of the extraordinary range of connectivity weights, distributed log normally over 6 orders of magnitude, that has been discovered in mammalian cortical networks ercsey2013predictive . The weakest connection between cortical areas is about a million times less weighted than the strongest connection: does it really make sense to set all these weights equivalently to 1 as edges in a binary graph? To ask the question is to answer it.
Small-worldness of weighted tract-tracing networks
A weighted small-world analysis is easily done for these data (Fig. 6B,D). The weighted clustering and weighted path length metrics (Eq. 8 and Eq. 9) are estimated directly from the weight matrices, and the ratio of weighted clustering to weighted path length is the scalar summary of weighted small-worldness . In Fig. 6, we directly compare binary and weighted graph theoretical results for the mouse oh2014mesoscale ; rubinov2015wiring and macaque markov2013cortical connectomes. Compared to the results of binary graph analysis, both mouse and macaque networks have increased clustering for the weighted graph analysis, and is increased for the macaque (see Table 1).
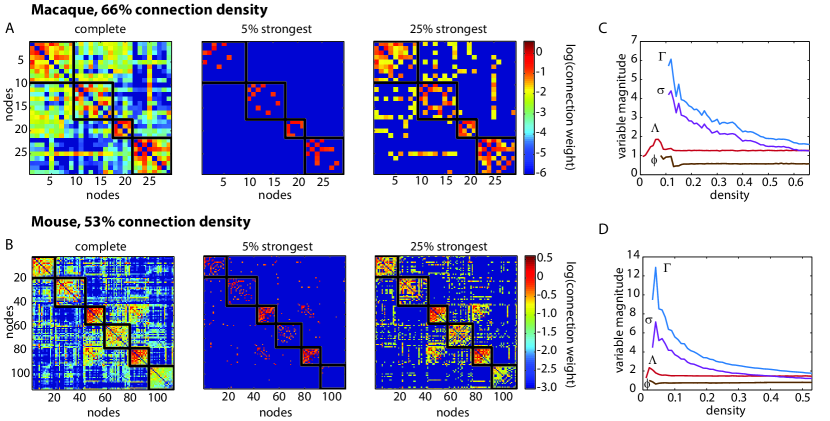
The weighted graph of the mouse connectome is similarly small-world compared to the weighted macaque graph, as measured by , but is significantly more small-world as measured by the small-world propensity . However, classical estimates of small-worldness may depend in a non-trivial way on the density of the graph. This relationship becomes obvious if we estimate the topology of both weighted graphs as a function of connection density (Fig. 7). The classical small-world scalar is greatest when it is estimated for a sparse graph comprising less than 20-30% of the most strongly connected edges, and decreases progressively as the graph becomes denser. This might suggest that the macaque connectome seems less small-world than the mouse simply because it is denser. However, the small world propensity has the useful property that it is independent of network density and it is significantly greater, indicating more small-worldness, for the mouse than the macaque. This could be related to differences between the datasets in number of cortical areas and completeness of cortical coverage: the macaque dataset comprises fewer nodes of mostly visual cortex than the larger number of nodes across the whole mouse cortex.
Weighted small-worldness and the role of edge weights
Why does a weighted graph analysis provide stronger evidence for non-random clustering than a binary graph analysis applied to the same tract-tracing data? The most strongly weighted connections generally span the shortest physical distances between cortical areas klimm2014resolving ; ercsey2013predictive ; rubinov2015wiring . This is not surprising based on what we know about the importance of cost constraints on brain organisation bassett2010efficient ; bullmore2012economy ; bassett2009cognitive ; fornito2011genetic . Strong connectivity weights indicate a large number of axonal projections, a big bandwidth bundle, perhaps macroscopically visible as a white matter tract. Building and resourcing a high bandwidth axonal signalling bundle is a significant biological cost that will increase as a function of connection distance: it is parsimonious to wire high bandwidth over short distances. Short distance connections are not only strongly weighted but also topologically clustered. So the strongest weights in both cortical networks define a topologically segregated and anatomically localised organisation. A map of the sub-network formed by the strongest weights shows spatial and topological clusters of regions (Fig. 8). In the mouse, the strongly weighted clusters each comprise functionally specialised areas of cortex (visual, motor, etc.) that are known to be densely inter-connected and anatomically localised rubinov2015wiring ; ypma2016 . Thus it is not surprising that weighting the topological analysis of mammalian cortical networks will provide stronger evidence for non-random clustering than unweighted analysis of binary graphs.
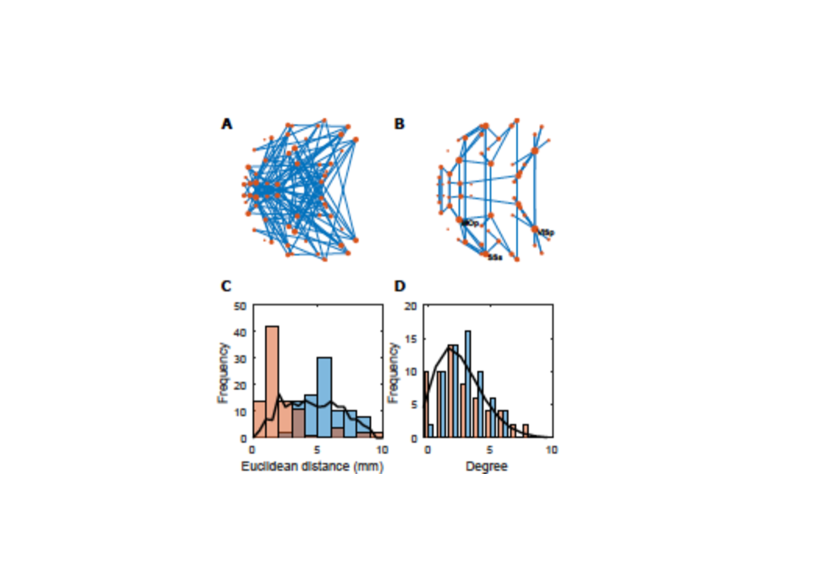
The most weakly weighted connections are an area of active, ongoing research (discussed in more detail below) and it is inevitable that there is still much to learn about a feature of network organisation – replicable but very weak connections between large cortical areas – that had not been measurable until recent advances in tract-tracing methodology. However, it is clear that weaker connections tend to subtend longer distances, and can be either more topologically random than ypma2016 or similarly topologically organized to bassett2012altered strong connections.
We conclude that graph theoretical analysis of tract-tracing connectomes should respect the quality of the data and use weighted topological metrics to reflect the wide ranging variation in anatomical connectivity, from single fibres to major tracts, that is now measurable in the mammalian brain wang2016brain . Weighted graph analysis demonstrates clearly that both the macaque and mouse connectomes are small-world networks, as are the human, cat, and nematode muldoon2016small . Binary graph analysis has usefully measured high connection density, due to the existence of many new anatomical connections, but binarization of these data is not the best way to understand their complex topology and its economical embedding in anatomical space rubinov2011weight ; bassett2011conserved ; klimm2014resolving ; bassett2012altered ; rubinov2015wiring . Future studies will likely also pay more attention to the fact that most tract-tracing markers are axonally transported only in one direction: anterograde or retrograde. This means that the weight matrix could be modelled more completely as a weighted and directed graph, representing a further evolution in the use of graph theoretical methods to capture a richer and biologically more meaningful model of brain network organisation than can be provided by binary graphs of unweighted and undirected edges.
The utility of weak connections
At this juncture, one might naturally ask: “From a neuroscientific perspective, do we need techniques that account for edge weights? Do these weights indeed capture information of relevance for cognition and behavior?” Neuroanatomical data suggest that the weights of structural connections may be driven by developmental growth rules klimm2014resolving ; lohse2014resolving ; kaiser2006nonoptimal ; ercsey2013predictive ; markov2013cortical , energetic and metabolic constraints bassett2010efficient , and physical limitations on the volume of neural systems, particularly brains encapsulated by bone sherbondy2009think . Yet the role of these edge weights in neural computations schneidman2006weak and higher order cognition has been less well studied.
Recent studies have begun to elucidate the role of edge weights – and particularly of weak connections – in human cognition. In resting state fMRI data, weak functional connections from lateral prefrontal cortex to regions within and outside the frontoparietal network have been shown to display individual differences in strength that predict individual differences in fluid intelligence cole2012global . The same general relationship was observed in a separate study in which individual differences in moderately weak, long-distance functional connections at rest were strongly correlated with full scale, verbal, and performance IQ santarnecchi2014efficiency . Neither of these correlations were observed when considering strong connections. Indeed the utility of weak edges appears to extend to psychiatric illness, where the highly-organized topology of weak functional connections – but not strong functional connections – in resting state fMRI were able to classify people with schizophrenia from healthy controls with high accuracy and specificity bassett2012altered . Interestingly, individual differences in these weak connections were significantly correlated with individual differences in cognitive scores and symptomatology. Together these results demonstrate that, indeed, methods that are sensitive to the strength (or weakness) of individual connections are imperative for progress to be made in understanding individual differences in cognitive abilities, and their alteration in psychiatric disease.
Importantly, the utility of weak connections is not only evident at the large scale in human brains, but also at the neuronal scale as measured in non-human species. In an influential paper published in 2006 with Bialek and colleagues, Schneidman demonstrated that weak pairwise correlations implied strongly correlated network states in a neural population, suggesting the presence of strong collective behaviour schneidman2006weak . This result was initially counter-intuitive as one might expect that weak correlations would be associated with the lack of collective behavior. However, the original observation has withstood the test of time, and has been validated in several additional studies including work at the level of tract tracing in macaque monkeys goulas2015strength . Intuitively, the juxtaposition of weak correlations and cohesive, collective behavior is thought to be driven by the underlying sparsity of neuronal interactions ganmor2011architecture , which contain a few non-trivial higher-order interaction terms ganmor2011sparse . Indeed, these higher-order interactions are the topic of some interest both from a computational neuroscience perspective giusti2016twos ; sizemore2016classification , and from the perspective of neural coding giusti2015clique .
But perhaps the claim that weak connections are critically important for our understanding of neural systems should not be particularly surprising. Indeed, it is in fact an old story, first published at the inception of network science. In 1973, Granovetter wrote a seminal paper, titled “The strength of weak ties”, which highlighted the critical importance of weakly connected components in global system dynamics granovetter1973strength . Such weak connections are ubiquitous in many systems, from physician interactions bridewell2011social to ecosystem webs ulanowicz2014limits and atmospheric pathways lee2014tracking . Looking forward, critical open questions lie in how these weak connections drive global dynamics, and how one can intervene in a system to manipulate those processes gu2015controllability ; betzel2016optimally ; muldoon2016stimulation .
Acknowledging the role of weak connections, weighted small-world organization plays a critical role in system functions that are particularly relevant to neural systems: including coherence, computation, and control and robustness novkovic2016topological . Perhaps the most commonly studied function afforded by small-world architecture is the ability to transmit information, a characteristic that is common in networks of coupled oscillators barahona2002synchronization ; hong2002synchronization ; nishikawa2003heterogeneity (although see atay2006synchronization for a few notable exceptions). This capability supports enhanced computational power lago2000fast , via swift flow and transport hwang2010spectral . In dynamic networks, oscillators coupled on small-world networks are much more sensitive to link changes than their random network counterparts kohar2014synchronization , the time taken to reach synchronization is lowered, and the synchronized state is less stable over time, potentially enabling greater diversity of function. When such a system has both small-world topology and geometry, it directly impacts the network’s ability to speed or slow spreading karsai2011small , a potentially useful characteristic for resilience to dementia which is thought to be caused by the spread of prions raj2012network ; raj2015network .
The value of small-world architecture is not limited to its support of synchronization and information flow. Instead, it also supports a wide-range of computations in neural circuits. From early neural network studies, it is clear that the exact topology of connectivity patterns between network elements directly supports tradeoffs in the network’s ability to learn new information versus retain old information in memory hermundstad2011learning . When these patterns are organized in a small-world manner, evidence suggests that local computations can be integrated across distributed cell assemblies to support functions as diverse as somatosensation zippo2013neuronal and olfaction imam2012implementation . The mechanism by which small-worlds support these computations may stem from the fact that their topological structure tends to contain both large cavities and high-dimensional cliques sizemore2016classification , which when embedded in a physical space can strongly constrain the geometric properties of the computation giusti2015clique .
While small-world structure can offer non-trivial advantages in terms of both communication and computation, it also directly informs the sorts of interventions that one could use to guide network dynamics and by extension system function. Indeed, computational studies have demonstrated that small-world network architecture requires specific control strategies if one wishes to stem the propagation of seizure activity ching2012distributed , control the spread of viruses kleczkowski2012searching , or enhance recovery following injury hubler2008mathematical . To gain an intuition for how topology impacts control, we can consider the broad-scale degree distribution also characteristic of brain networks. Based on the Laplacian spectrum, one can observe that weakly connected nodes have the greatest potential to push the system into distant states, far away on an energy landscape pasqualetti2014controllability ; conversely, strongly connected hubs have the greatest potential to push the system into many local states, nearby on the energy landscape gu2015controllability . Thus, control energy (such as that provided by brain stimulation) may be targeted to different locations in a small-world brain network to affect a specific change in brain dynamics muldoon2016stimulation .
Conclusions
Small-worldness remains an important and viable concept in network neuroscience. Nearly twenty years on from the first analysis of the complex topology of a binary graph representing the nervous system of C. elegans, it has been established that small-worldness is a nearly-universal and functionally valuable property of nervous systems economically embedded in anatomical space. Recent advances in tract tracing connectomics do not refute small-worldness; rather they considerably enrich and deepen our understanding of what it means in the brain. The extraordinary precision of contemporary tract tracing, and the important discovery that mammalian cortical networks are denser than expected, mandates the adoption of more sophisticated techniques for weighted graph theoretical modelling of inter-areal connectomes. On this basis, we expect the next ten years to yield further insights into the functional value of weak as well as strong connections in brain networks with weighted small-worldness.
Acknowledgements and disclosures
We thank Rolf Ypma and Evelyn Tang for comments on an earlier draft of this manuscript, and for Jonathan Soffer for assistance. ETB is employed half-time by the University of Cambridge and half-time by the University of Cambridge; he holds stock in GSK. DSB acknowledges support from the John D. and Catherine T. MacArthur Foundation, the Alfred P. Sloan Foundation, the Army Research Laboratory and the Army Research Office through contract numbers W911NF-10-2-0022 and W911NF-14-1-0679,the National Institute of Mental Health (2-R01-DC-009209-11), the National Institute of Child Health and Human Development (1R01HD086888-01), the Office of Naval Research, and the National Science Foundation (BCS-1441502, BCS-1430087, PHY-1554488, and BCS-1631550).
References
- (1) Milgram, S. The small world problem. Psychology Today 2, 60–67 (1967).
- (2) Watts, D. J. & Strogatz, S. H. Collective dynamics of ’small-world’ networks. Nature 393, 440–442 (1998).
- (3) Sporns, O. & Kötter, R. Motifs in brain networks. PLoS Biol 2, e369 (2004).
- (4) Li, X. & Cao, L. Largest laplacian eigenvalue predicts the emergence of costly punishment in the evolutionary ultimatum game on networks. Phys Rev E Stat Nonlin Soft Matter Phys 80, 066101 (2009).
- (5) Konishi, K. & Hara, N. Topology-free stability of a steady state in network systems with dynamic connections. Phys Rev E Stat Nonlin Soft Matter Phys 83, 036204 (2011).
- (6) Humphries, M. D., Gurney, K. & Prescott, T. J. The brainstem reticular formation is a small-world, not scale-free, network. Proc Biol Sci. 273, 503–511 (2006).
- (7) Toppi, J. et al. How the statistical validation of functional connectivity patterns can prevent erroneous definition of small-world properties of a brain connectivity network. Comput Math Methods Med 2012, 130985 (2012).
- (8) Telesford, Q. K., Joyce, K. E., Hayasaka, S., Burdette, J. H. & Laurienti, P. J. The ubiquity of small-world networks. Brain Connect 1, 367–375 (2011).
- (9) White, J. G., Southgate, E., Thomson, J. N. & Brenner, S. The structure of the nervous system of the nematode Caenorhabditis elegans. Philos Trans R Soc Lond B Biol Sci 314, 1–340 (1986).
- (10) Vertes, P. E. et al. Simple models of human brain functional networks. Proc Natl Acad Sci U S A 109, 5868–5873 (2012).
- (11) Vertes, P. E., Alexander-Bloch, A. & Bullmore, E. T. Generative models of rich clubs in Hebbian neuronal networks and large-scale human brain networks. Philos Trans R Soc Lond B Biol Sci 369, 1653 (2014).
- (12) Betzel, R. F. et al. Generative models of the human connectome. Neuroimage 124, 1054–1064 (2016).
- (13) Sporns, O. & Zwi, J. D. The small world of the cerebral cortex. Neuroinformatics 2, 145–162 (2004).
- (14) Hilgetag, C. C. & Kaiser, M. Clustered organization of cortical connectivity. Neuroinformatics 2, 353–360 (2004).
- (15) Salvador, R. et al. Neurophysiological architecture of functional magnetic resonance images of human brain. Cerebral cortex 15, 1332–1342 (2005).
- (16) reconfiguration of fractal small-world human brain functional networks, A. Proc Natl Acad Sci U S A 103, 19518–19523 (2006).
- (17) Vaessen, M. J. et al. The effect and reproducibility of different clinical DTI gradient sets on small world brain connectivity measures. Neuroimage 51, 1106–1116 (2010).
- (18) Sporns, O., Tononi, G. & Kötter, R. The human connectome: a structural description of the human brain. PLoS Comput Biol 1, e42 (2005).
- (19) Bassett, D. S. & Bullmore, E. Small-world brain networks. Neuroscientist 12, 512–523 (2006).
- (20) Bullmore, E. & Sporns, O. Complex brain networks: graph theoretical analysis of structural and functional systems. Nat Rev Neurosci 10, 186–198 (2009).
- (21) Bullmore, E. T. & Bassett, D. S. Brain graphs: graphical models of the human brain connectome. Annu Rev Clin Psychol 7, 113–140 (2011).
- (22) Pessoa, L. Understanding brain networks and brain organization. Phys Life Rev 11, 400–435 (2014).
- (23) Sporns, O. Networks of the Brain (MIT press, 2011).
- (24) Fornito, A., Zalesky, A. & Bullmore, E. T. Fundamentals of Brain Network Analysis (Academic Press, 2016).
- (25) Bassett, D. S. & Sporns, O. Network neuroscience. Nature Neuroscience In Press (2016).
- (26) Bettencourt, L. M., Stephens, G. J., Ham, M. I. & Gross, G. W. Functional structure of cortical neuronal networks grown in vitro. Phys Rev E Stat Nonlin Soft Matter Phys 75, 021915 (2007).
- (27) van den Heuvel, M. P., Bullmore, E. T. & Sporns, O. Comparative connectomics. Trends in Cognitive Sciences 20, 345–361 (2016).
- (28) Popper, K. R. Conjectures and Refutations: The growth of scientific knowledge (Routledge, 1963).
- (29) Bullmore, E. et al. Generic aspects of complexity in brain imaging data and other biological systems. Neuroimage 47, 1125–1134 (2009).
- (30) Bassett, D. S. et al. Efficient physical embedding of topologically complex information processing networks in brains and computer circuits. PLoS Comput Biol 6, e1000748 (2010).
- (31) Klimm, F., Bassett, D. S., Carlson, J. M. & Mucha, P. J. Resolving structural variability in network models and the brain. PLoS Computational Biology 10, e1003491 (2014).
- (32) Bassett, D. S. & Siebenhuhner, F. Multiscale network organization in the human brain (Wiley, 2013).
- (33) Gaiteri, C., Ding, Y., French, B., Tseng, G. C. & Sibille, E. Beyond modules and hubs: the potential of gene coexpression networks for investigating molecular mechanisms of complex brain disorders. Genes Brain Behav 13, 13–24 (2014).
- (34) Moslonka-Lefebvre, M. et al. Networks in plant epidemiology: from genes to landscapes, countries, and continents. Phytopathology 101, 392–403 (2011).
- (35) Sizemore, A., Giusti, C. & Bassett, D. S. Classification of weighted networks through mesoscale homological features. Journal of Complex Networks In Press (2016).
- (36) Koschutzki, D., Junker, B. H., Schwender, J. & Schreiber, F. Structural analysis of metabolic networks based on flux centrality. J Theor Biol 265, 261–269 (2010).
- (37) Bullmore, E. & Sporns, O. The economy of brain network organization. Nature Reviews Neuroscience 13, 336–349 (2012).
- (38) Bassett, D. S., Brown, J. A., Deshpande, V., Carlson, J. M. & Grafton, S. T. Conserved and variable architecture of human white matter connectivity. Neuroimage 54, 1262–1279 (2011).
- (39) Rubinov, M., Ypma, R., Watson, C. & Bullmore, E. Wiring cost and topological participation of the mouse brain connectome. Proceedings of the National Academy of Sciences of the USA doi/10.1073/pnas.1420315112 (2015).
- (40) Acimovic, J., Maki-Marttunen, T. & Linne, M. L. The effects of neuron morphology on graph theoretic measures of network connectivity: the analysis of a two-level statistical model. Front Neuroanat 9, 76 (2015).
- (41) van den Heuvel, M. P., Scholtens, L. H., Feldman Barrett, L., Hilgetag, C. C. & de Reus, M. A. Bridging cytoarchitectonics and connectomics in human cerebral cortex. J Neurosci 35, 13943–13948 (2015).
- (42) Fulcher, B. D. & Fornito, A. A transcriptional signature of hub connectivity in the mouse connectome. Proc Natl Acad Sci U S A 113, 1435–1440 (2016).
- (43) Wang, X. J. & Kennedy, H. Brain structure and dynamics across scales: in search of rules. Curr Opin Neurobiol 37, 92–98 (2016).
- (44) Lohse, C., Bassett, D. S., Lim, K. O. & Carlson, J. M. Resolving anatomical and functional structure in human brain organization: Identifying mesoscale organization in weighted network representations. PLoS Comput Biol 10, e1003712 (2014).
- (45) Kaiser, M. & Hilgetag, C. C. Nonoptimal component placement, but short processing paths, due to long-distance projections in neural systems. PloS Computational Biology 2, e95 (2006).
- (46) Latora, V. & Marchiori, M. Efficient behavior of small-world networks. Phys Rev Lett 87, 198701 (2001).
- (47) Avena-Koenigsberger, A. et al. Using Pareto optimality to explore the topology and dynamics of the human connectome. Philos Trans R Soc Lond B Biol Sci 369, 1653 (2014).
- (48) Achard, S., Salvador, R., Whitcher, B., Suckling, J. & Bullmore, E. A resilient, low-frequency, small-world human brain functional network with highly connected association cortical hubs. J Neurosci 26, 63–72 (2006).
- (49) Simon, H. The architecture of complexity. American Philosophical Society 106, 467–482 (1962).
- (50) Meunier, D., Achard, S., Morcom, A. & Bullmore, E. Age-related changes in modular organization of human brain functional networks. Neuroimage 44, 715–723 (2009).
- (51) Chen, Z. J., He, Y., Rosa-Neto, P., Germann, J. & Evans, A. C. Revealing modular architecture of human brain structural networks by using cortical thickness from MRI. Cereb Cortex 18, 2374–2381 (2008).
- (52) Sporns, O. & Betzel, R. F. Modular brain networks. Annu Rev Psychol 67 (2016).
- (53) Bassett, D. S. et al. Dynamic reconfiguration of human brain networks during learning. Proc Natl Acad Sci U S A 108, 7641–7646 (2011).
- (54) Mattar, M. G., Cole, M. W., Thompson-Schill, S. L. & Bassett, D. S. A functional cartography of cognitive systems. PLoS Comput Biol 11, e1004533 (2015).
- (55) Stoop, R., Saase, V., Wagner, C., Stoop, B. & Stoop, R. Beyond scale-free small-world networks: cortical columns for quick brains. Phys Rev Lett 110, 108105 (2013).
- (56) Bassett, D. S. et al. Task-based core-periphery organization of human brain dynamics. PLoS Comput Biol 9, e1003171 (2013).
- (57) Senden, M., Deco, G., de Reus, M. A., Goebel, R. & van den Heuvel, M. P. Rich club organization supports a diverse set of functional network configurations. Neuroimage 96, 174–182 (2014).
- (58) van den Heuvel, M. P. & Sporns, O. Rich-club organization of the human connectome. The Journal of neuroscience 31, 15775–15786 (2011).
- (59) Gu, S. et al. Controllability of structural brain networks. Nat Commun 6, 8414 (2015).
- (60) Muldoon, S. F. et al. Stimulation-based control of dynamic brain networks. PLoS Comp Biol In Press (2016).
- (61) Betzel, R. F., Gu, S., Medaglia, J. D., Pasqualetti, F. & Bassett, D. S. Optimally controlling the human connectome: the role of network topology. Scientific Reports In Press (2016).
- (62) Gulyas, A., Biro, J. J., Korosi, A., Retvari, G. & Krioukov, D. Navigable networks as nash equilibria of navigation games. Nat Commun 6, 7651 (2015).
- (63) Markov, N. et al. A weighted and directed interareal connectivity matrix for macaque cerebral cortex. Cereb Cortex (2012).
- (64) Markov, N. T. et al. Cortical high-density counterstream architectures. Science 342, 1238406 (2013).
- (65) Song, H. F., Kennedy, H. & Wang, X.-J. Spatial embedding of structural similarity in the cerebral cortex. Proceedings of the National Academy of Sciences USA 111, 16580–16585 (2014).
- (66) Knoblauch, K., Ercsey-Ravasz, M., Kennedy, H. & Toroczkai, Z. The brain in space. Micro- Meso- and Macro-Connectomics of the Brain H. Kennedy et al eds (2016).
- (67) Stephan, K. et al. Advanced database methodology for the collation of connectivity data on the macaque brain (cocomac). Phil Trans R Soc B 356, 1159–1186 (2001).
- (68) Zhang, Z., Telesford, Q. K., Giusti, C., Lim, K. O. & Bassett, D. S. Choosing wavelet methods, filters, and lengths for functional brain network construction. PLoS One 11, e0157243 (2016).
- (69) Bassett, D. S. et al. Hierarchical organization of human cortical networks in health and schizophrenia. J Neurosci 28, 9239–9248 (2008).
- (70) Alexander-Bloch, A., Giedd, J. N. & Bullmore, E. Imaging structural co-variance between human brain regions. Nat Rev Neurosci 14, 322–336 (2013).
- (71) Oh, S. W. et al. A mesoscale connectome of the mouse brain. Nature 508, 207–214 (2014).
- (72) Modha, D. S. & Singh, R. Network architecture of the long-distance pathways in the macaque brain. Proceedings of the National Academy of Sciences 107, 13485–13490 (2010).
- (73) Young, M. P. The organization of neural systems in the primate cerebral cortex. Proc. R. Soc. Lond. B Biol. Sci. 252, 13––18 (1993).
- (74) Honey, C. J., Kotter, R., Breakspear, M. & Sporns, O. Network structure of cerebral cortex shapes functional connectivity on multiple time scales. Proc. Natl. Acad. Sci. U.S.A. 104, 10240––10245 (2007).
- (75) Felleman, D. J. & Van Essen, D. C. Distributed hierarchical processing in the primate cerebral cortex. Cereb. Cortex. 1, 1––47 (1991).
- (76) Jouve, B., Rosenstiehl, P. & Imbert, M. A mathematical approach to the connectivity between the cortical visual areas of the macaque monkey. Cereb. Cortex. 8, 28––39 (1998).
- (77) Markov, N. T. et al. A weighted and directed interareal connectivity matrix for macaque cerebral cortex. Cereb Cortex 24, 17–36 (2014).
- (78) Bollobas, B. Graph Theory: An Introductory Course (Springer-Verlag, 1979).
- (79) Random Graphs (1985).
- (80) van Wijk, B. C., Stam, C. J. & Daffertshofer, A. Comparing brain networks of different size and connectivity density using graph theory. PLoS One 5, e13701 (2010).
- (81) Bassett, D. S., Nelson, B. G., Mueller, B. A., Camchong, J. & Lim, K. O. Altered resting state complexity in schizophrenia. Neuroimage 59, 2196–2207 (2012).
- (82) Lynall, M. E. et al. Functional connectivity and brain networks in schizophrenia. J Neurosci 30, 9477–9487 (2010).
- (83) Muldoon, S. F., Bridgeford, E. W. & Bassett, D. S. Small-world propensity and weighted brain networks. Sci Rep 6, 22057 (2016).
- (84) Rubinov, M. & Sporns, O. Weight-conserving characterization of complex functional brain networks. Neuroimage 56, 2068–2079 (2011).
- (85) Ginestet, C. E., Nichols, T. E., Bullmore, E. T. & Simmons, A. Brain network analysis: separating cost from topology using cost-integration. PLoS One e21570 (2011).
- (86) Bassett, D. S., Owens, E. T., Daniels, K. E. & Porter, M. A. Influence of network topology on sound propagation in granular materials. Phys Rev E Stat Nonlin Soft Matter Phys 86, 041306 (2012).
- (87) Onnela, J.-P., Saramäki, J., Kertész, J. & Kaski, K. Intensity and coherence of motifs in weighted complex networks. Physical Review E 71, 065103 (2005).
- (88) Barrat, A., Barthelemy, M., Pastor-Satorras, R. & Vespignani, A. The architecture of complex weighted networks. Proceedings of the National Academy of Sciences 101, 3747–3752 (2004).
- (89) Zhang, B. & Horvath, S. A General Framework for Weighted Gene Co-Expression Network Analysis. Statistical Applications in Genetics and Molecular Biology 4 (2005).
- (90) Newman, M. E. J. Scientific collaboration networks. II. Shortest paths, weighted networks, and centrality. Physical Review E 64, 016132 (2001).
- (91) A weighted small world network measure for assessing functional connectivity. J Neurosci Methods 212, 133–142 (2013).
- (92) Expert, P., Evans, T. S., Blondel, V. D. & Lambiotte, R. Uncovering space-independent communities in spatial networks. Proceedings of the National Academy of Sciences 108, 7663–7668 (2011).
- (93) Bassett, D. S., Owens, E. T., Porter, M. A., Manning, M. L. & Daniels, K. E. Extraction of force-chain network architecture in granular materials using community detection. Soft Matter 11, 2731–244 (2015).
- (94) Papadopoulus, L., Puckett, J., Daniels, K. E. & Bassett, D. S. Evolution of network architecture in a granular material under compression. axXiv 1603, 08159 (2016).
- (95) Barthélemy, M. Spatial networks. Physics Reports 499, 1–101 (2011).
- (96) Ypma, R. J. F. & Bullmore, E. T. Statistical analysis of tract-tracing experiments demonstrates a dense, complex cortical network in the mouse. PLoS Comput Biol in press (2016).
- (97) Ercsey-Ravasz, M. et al. A predictive network model of cerebral cortical connectivity based on a distance rule. Neuron 80, 184–197 (2013).
- (98) Zalesky, A. et al. Whole-brain anatomical networks: does the choice of nodes matter? Neuroimage 50, 970–983 (2010).
- (99) Bassett, D. S. et al. Cognitive fitness of cost-efficient brain functional networks. Proc Natl Acad Sci U S A 106, 11747–11752 (2009).
- (100) Fornito, A. et al. Genetic influences on cost-efficient organization of human cortical functional networks. J Neurosci 31, 3261–3270 (2011).
- (101) Sherbondy, A. J., Dougherty, R. F., Ananthanarayanan, R., Modha, D. S. & Wandell, B. A. Think global, act local; projectome estimation with BlueMatter. Med Image Comput Comput Assist Interv 12, 861–868 (2009).
- (102) Schneidman, E., Berry, M. J. n., Segev, R. & Bialek, W. Weak pairwise correlations imply strongly correlated network states in a neural population. Nature 440, 1007–1012 (2006).
- (103) Cole, M. W., Yarkoni, T., Repovs, G., Anticevic, A. & Braver, T. S. Global connectivity of prefrontal cortex predicts cognitive control and intelligence. J Neurosci 32, 8988–8999 (2012).
- (104) Efficiency of weak brain connections support general cognitive functioning. Hum Brain Mapp 35, 4566–4582 (2014).
- (105) Goulas, A., Schaefer, A. & Margulies, D. S. The strength of weak connections in the macaque cortico-cortical network. Brain Struct Funct 220, 2939–2951 (2015).
- (106) Ganmor, E., Segev, R. & Schneidman, E. The architecture of functional interaction networks in the retina. J Neurosci 31, 3044–3054 (2011).
- (107) Ganmor, E., Segev, R. & Schneidman, E. Sparse low-order interaction network underlies a highly correlated and learnable neural population code. Proc Natl Acad Sci U S A 108, 9679–9684 (2011).
- (108) Giusti, C., Ghrist, R. & Bassett, D. S. Two’s company, three (or more) is a simplex : Algebraic-topological tools for understanding higher-order structure in neural data. J Comput Neurosci 41, 1–14 (2016).
- (109) Giusti, C., Pastalkova, E., Curto, C. & Itskov, V. Clique topology reveals intrinsic geometric structure in neural correlations. Proc Natl Acad Sci U S A 112, 13455–13460 (2015).
- (110) Granovetter, M. S. The strength of weak ties. The American Journal of Sociology 78, 1360–1380 (1973).
- (111) Bridewell, W. & Das, A. K. Social network analysis of physician interactions: the effect of institutional boundaries on breast cancer care. AMIA Annu Symp Proc 2011, 152–160 (2011).
- (112) Ulanowicz, R. E., Holt, R. D. & Barfield, M. Limits on ecosystem trophic complexity: insights from ecological network analysis. Ecol Lett 17, 127–136 (2014).
- (113) Lee, C. S. & Su, P. J. Tracking sinks of atmospheric methane using small world networks. Chemosphere 117, 766–773 (2014).
- (114) Novkovic, M. et al. Topological small-world organization of the fibroblastic reticular cell network determines lymph node functionality. PLoS Biol 14, e1002515 (2016).
- (115) Barahona, M. & Pecora, L. M. Synchronization in small-world systems. Phys Rev Lett 89, 054101 (2002).
- (116) Hong, H., Choi, M. Y. & Kim, B. J. Synchronization on small-world networks. Phys Rev E Stat Nonlin Soft Matter Phys 65, 026139 (2002).
- (117) Nishikawa, T., Motter, A. E., Lai, Y. C. & Hoppensteadt, F. C. Heterogeneity in oscillator networks: are smaller worlds easier to synchronize? Phys Rev Lett 91, 014101 (2003).
- (118) Atay, F. M., Biyikoglu, T. & Jost, J. Synchronization of networks with prescribed degree distributions. IEEE Transactions on Circuits and Systems Part I: Regular Papers 53, 92–98 (2006).
- (119) Lago-Fernandez, L. F., Huerta, R., Corbacho, F. & Siguenza, J. A. Fast response and temporal coherent oscillations in small-world networks. Phys Rev Lett 84, 2758–2761 (2000).
- (120) Hwang, S., Yun, C. K., Lee, D. S., Kahng, B. & Kim, D. Spectral dimensions of hierarchical scale-free networks with weighted shortcuts. Phys Rev E Stat Nonlin Soft Matter Phys 82, 056110 (2010).
- (121) Kohar, V., Ji, P., Choudhary, A., Sinha, S. & Kurths, J. Synchronization in time-varying networks. Phys Rev E Stat Nonlin Soft Matter Phys 90, 022812 (2014).
- (122) Karsai, M. et al. Small but slow world: how network topology and burstiness slow down spreading. Phys Rev E Stat Nonlin Soft Matter Phys 83, 025102 (2011).
- (123) Raj, A., Kuceyeski, A. & Weiner, M. A network diffusion model of disease progression in dementia. Neuron 73, 1204–1215 (2012).
- (124) Raj, A. et al. Network diffusion model of progression predicts longitudinal patterns of atrophy and metabolism in alzheimer’s disease. Cell Rep S2211–1247, 01063–01068 (2015).
- (125) Hermundstad, A. M., Brown, K. S., Bassett, D. S. & Carlson, J. M. Learning, memory, and the role of neural network architecture. PLoS Comput Biol 7, e1002063 (2011).
- (126) Zippo, A. G. et al. Neuronal functional connection graphs among multiple areas of the rat somatosensory system during spontaneous and evoked activities. PLoS Comput Biol 9, e1003104 (2013).
- (127) Imam, N. et al. Implementation of olfactory bulb glomerular-layer computations in a digital neurosynaptic core. Front Neurosci 6, 83 (2012).
- (128) Ching, S., Brown, E. N. & Kramer, M. A. Distributed control in a mean-field cortical network model: implications for seizure suppression. Phys Rev E Stat Nonlin Soft Matter Phys 86, 021920 (2012).
- (129) Kleczkowski, A., Oles, K., Gudowska-Nowak, E. & Gilligan, C. A. Searching for the most cost-effective strategy for controlling epidemics spreading on regular and small-world networks. J R Soc Interface 9, 158–169 (2012).
- (130) Hubler, M. J. & Buchman, T. G. Mathematical estimates of recovery after loss of activity: II. Long-range connectivity facilitates rapid functional recovery. Crit Care Med 36, 489–494 (2008).
- (131) Pasqualetti, F., Zampieri, S. & Bullo, F. Controllability metrics, limitations and algorithms for complex networks. IEEE Transactions on Control of Network Systems 1, 40–52 (2014).