Stream-subhalo interactions in the Aquarius simulations
Abstract
Aims. We perform the first self-consistent measurement of the rate of interactions between stellar tidal streams created by disrupting satellites and dark subhalos in a cosmological simulation of a Milky-Way-mass galaxy.
Methods. Using a retagged version of the Aquarius A dark-matter-only simulation, we selected 18 streams of tagged star particles that appear thin at the present day and followed them from the point their progenitors accrete onto the main halo, recording in each snapshot the characteristics of all dark-matter subhalos passing within several distance thresholds of any tagged star particle in each stream. We considered distance thresholds corresponding to constant impact parameters (1, 2, and 5 kpc), as well as those proportional to the region of influence of each subhalo (one and two times its half-mass radius ). We then measured the age and present-day, phase-unwrapped length of each stream in order to compute the interaction rate in different mass bins and for different thresholds, and compared these to analytic predictions from the literature.
Results. We measure a median rate of interactions within 1 (2, 5) kpc of the stream per 10 kpc of stream length per 10 Gyr. Resolution effects (both time and particle number) affect these estimated rates by lowering them.
Key Words.:
Galaxy: halo – Galaxy: kinematics and dynamics – (cosmology:) dark matter – Galaxy: structure – galaxies: interactions – methods: numerical1 Introduction
A key prediction of the concordance model of the universe is the existence of structure in the dark matter distribution at nearly all scales, limited only by the intrinsic temperature of the candidate dark matter particle at the smallest scales and causality at the largest scales (Bertone et al. 2005). At the galactic scale this structure manifests as bound subhalos orbiting within the gravitational potential of their host, with the largest mass fraction in subhalos generally occuring near the virial radius of the main halo (Springel et al. 2008). However it is also clear that many of these subhalos, if they exist, must not host luminous galaxies, since their number in cold-dark-matter simulations greatly exceeds the number of satellite galaxies observed around the Milky Way (MW) and other galaxies in nature, the so-called missing satellite problem (Klypin et al. 1999, and Moore 1999). Solutions to this discrepancy fall into two broad categories: those that modify the properties of dark matter to raise the minimum size of substructures to match observed satellites, and those in which the dark matter is cold (CDM) and baryonic processes select some fraction of subhalos to host galaxies. Solutions that adjust the baryons rather than the dark matter thus also predict the existence of many “dark subhalos” devoid of baryonic matter, orbiting nearly invisibly in galactic halos. Determining whether these dark subhalos exist is thus an important test to discriminate between CDM and other models of dark matter.
One possible observable signature of dark subhalos is the imprint they leave on stellar tidal streams, the unbound remnants of accreted satellite galaxies. These satellite galaxies initially inhabit the subhalos that managed to retain their gas and form stars before accreting onto their host galaxy. Many tidal streams have already been found (Helmi et al. 1999; Ibata et al. 2001; Vivas et al. 2001; Odenkirchen et al. 2003; Yanny et al. 2003, 2004; Belokurov et al. 2006; Grillmair 2006; Duffau et al. 2006; Lauchner et al. 2006; Grillmair & Johnson 2006; Grillmair & Dionatos 2006; Belokurov et al. 2007; Klement et al. 2009; Grillmair 2009; Bonaca et al. 2012; Martin et al. 2013) and still more are thought to exist (e.g. Helmi & White 1999; Helmi et al. 2011; Gómez et al. 2013). Tidal streams are kinematically cold compared to the total phase-space distribution of their host, since they come from less massive progenitors, and their stars orbit as test particles in the host after being unbound by tides from their progenitors. A tidal stream will thus become even colder as it ages, since its stars conserve their total phase-space volume and slight differences in their orbits cause their positions to spread out over time (e.g. Helmi & White 1999). This elongation of the volume in physical space makes streams sensitive probes of the lumpiness of the mass distribution, since interactions with dark subhalos will disturb the long (10s to 100s of kpc), thin (physical width of 10s to 100s of pc, velocity dispersion of a few km ) stream of stars (Johnston et al. 2002; Ibata et al. 2002; Mayer et al. 2002; Penarrubia et al. 2006; Carlberg 2009; Yoon et al. 2011). The small velocity spread and width of a stream mean that even small disturbances can be detected, while its long length gives it a large cross-section to interactions with the more isotropic population of dark substructure. Additionally, the arrangement of the stream stars along neighboring orbits will magnify alterations over time, since a local encounter with a subhalo will affect a subset of stream stars with similar orbital phases. Thus for example a “gap” in a stream caused by scattering from a subhalo will widen over time as the discrepancy between orbits at the edges of the gap increases (Carlberg 2009; Yoon et al. 2011).
Previous work on stream-subhalo interactions has fallen into two categories. Carlberg (2009, 2013, 2015a, 2015b) and Erkal & Belokurov (2015) considered the effects of these encounters on idealized streams on relatively circular orbits to determine the characteristics of their signatures and the mass range of subhalos likely to create observable gaps. Other work by Yoon et al. (2011, hereafter YJH), Carlberg (2012b), Ngan & Carlberg (2014), and Ngan et al. (2015) inserted simulated globular-cluster-like streams into dark matter halos based on cosmological simulations to estimate how often such interactions would occur in CDM halos. However, there has been no attempt to date to self-consistently measure the interaction rate between streams from accreted luminous substructures and nonluminous subhalos generated from a single cosmological simulation. That is the goal of this work.
To calculate the predicted frequency of both streams and subhalos, we use one of the Aquarius simulations of a Milky-Way-like dark matter halo (Springel et al. 2008), a portion of the Millenium II dark-matter-only cosmological simulation (Boylan-Kolchin et al. 2009) that has been resimulated at higher resolution. Specifically we use the simulation of Halo Aq-A-2 () at resolution level 2 (). This simulation resolves dark substructures down to about at size scales of about 0.3 kpc. To create stellar streams from some of the substructures, we tag some of the dark matter particles as “stars” according to the procedure described in Section 2. We then follow one such set of stars, which at the present day in the simulation forms a long thin stream, and track the close encounters between these stars and the many untagged dark subhalos in each snapshot of the simulation, from the infall of the stream’s progenitor to the present day (Section 3) and examine the rate of interactions and the evolution of the stream in phase space and constants of motion. Finally, we select 18 streams that still appear long and thin at the present day and track their interactions with subhalos in the same way to calculate an average interaction rate for a stream of a given age and present day length (Section 4). In Section 5 we compare the rate to estimates from the literature and in Section 6 we summarize our findings.

2 Streams in the tagged Aquarius simulations
Initially we used the scheme described in Cooper et al. (2010) to tag a subset of the dark-matter particles in the Aquarius subhalos as a stellar component, but we found that the assignment of stellar mass to dark matter particles in this scheme can be very lumpy; that is, one dark matter particle can end up with orders of magnitude more stellar mass assigned to it than its neighbor. This makes it difficult to interpret “gaps” in the surface brightness of the simulated streams. Because the tagging proceeds throughout the simulation, it is also unclear whether this method evenly samples the phase space of each subhalo. So we also tried a different, much simpler tagging method that assigns stellar mass more evenly to the DM particles.
2.1 Tagging at infall
In our new method we also start with the dark-matter-only Aq-A-2 simulation, but tag dark matter particles in subhalos with stellar mass by selecting the most bound 1% of particles in each subhalo at the snapshot where it is first associated with the main halo in the friends-of-friends tree generated by the halo finder subfind (Springel et al. 2001). We refer to this snapshot as the “infall” snapshot. This strategy is similar to that followed by e.g. De Lucia & Helmi (2008) and Lunnan et al. (2012). The amount of associated stellar mass is calculated using the semianalytic model of Starkenburg et al. (2013), and is divided evenly between all selected DM particles. For tagged subhalos that are still bound at the present day in the simulation, this produces the luminosity–size relation shown in the lower panel of Figure 1. We tried several different tagging percentages up to 10%, and found that a 1% tagging fraction most closely matched the size-luminosity relation of the MW and M31 satellites down to the resolution limit of the simulation (where the half-light radius is comparable to a few times the softening length). The luminosity–velocity dispersion relation is also roughly matched with this tagging fraction.
Tagging methods for representing the building blocks of the stellar halo are to some extent unsatisfactory, since they assume that the phase-space distribution of the stars and dark matter deep within the subhalo potential are identical. Recent work by Le Bret et al. (2015) and Bailin et al. (2014) points out discrepancies between the distributions of stars in particle-tagging schemes and those generated by SPH simulations. Some of these discrepancies are due to the way in which tagging proceeds, while others vary with the choice of feedback prescriptions in the subgrid SPH physics, which can either reconcile or exacerbate the differences. However, while neither representation of the streams resulting from tagged DM-only satellites is likely to be correct in detail, we do produce objects that agree with the luminosity-size relationship of the structures that are still bound at present day, which is the best available observational constraint.
We use a lower tagging percentage than Le Bret et al. (2015), who found that tagging the most-bound 5 percent of particles in subhalos over the course of a dark matter (DM) only simulation produced the best agreement with hydrodynamic (SPH) simulations. They hypothesize that a larger tagging region is needed to properly account for differences in the dark matter particle diffusion rate between the hydro and DM-only cases (since, for example, the hydro simulations form a disk that can shock satellites during mergers). However, their agreement criteria differ from ours; we simply wish to properly reproduce the observed luminosity-size and luminosity-velocity relations of the bound MW satellites, while Le Bret et al. focus mainly on the structure of the unbound halo stars and the density profiles of the few largest simulated satellites. Furthermore we tag at infall rather than over time, so that the percentages being tagged are not directly comparable. Le Bret et al. show that the difference between tagging 1% and 5% of particles is most pronounced in the massive satellite density profiles, and is much smaller in the unbound halo structure. On the other hand, Libeskind et al. (2011) focused on comparing the radial profiles of observed stellar halos with those obtained through tagging and found that tagged fractions of 1–3% in the dark-matter-only CLUES simulations could reproduce the observed stellar halo profile depending on whether the MW, M31, or M33 was considered, with the lower end of that range being appropriate for the Milky Way. These authors also looked at CLUES runs including SPH and found that in these cases a larger tagging fraction (3–5%) was required to match the observations, suggesting that matching SPH to DM-only runs should give different results for the best tagging fraction than matching either to observations. Additionally, the choice of tagging fraction will primarily influence the length of the resulting streams, which (as we will demonstrate in this work) spans a very wide range, with far more variety than could be produced simply by manipulating the tagging fraction within the range recommended by all these studies. We therefore argue that our tagging choices are sufficient for our purposes and consistent with the studies most similar to our situation.
2.2 Comparison to Cooper et al. tagging scheme
Both our simplified tagging scheme and the method used by Cooper et al. match the properties of the present-day bound satellites reasonably well, but this agreement does not rule out possible differences in the distributions of tagged particles in the unbound structures. Differences are to be expected, since in Cooper et al.’s scheme particles are tagged over time, and some dark matter particles could pass into and out of the most-bound region being tagged one or more times. This led us to expect that our single-snapshot tagging would lead to a consistent size of bound structures but without a more diffuse region of tagged particles that were in the subhalo’s center at earlier times but not at infall. It was also unclear how much of the apparent lumpiness of the streams in the Cooper tagging scheme had to do with the tagging method, as opposed to structure either in the subhalos themselves or produced in the streams through encounters in the lumpy main halo.
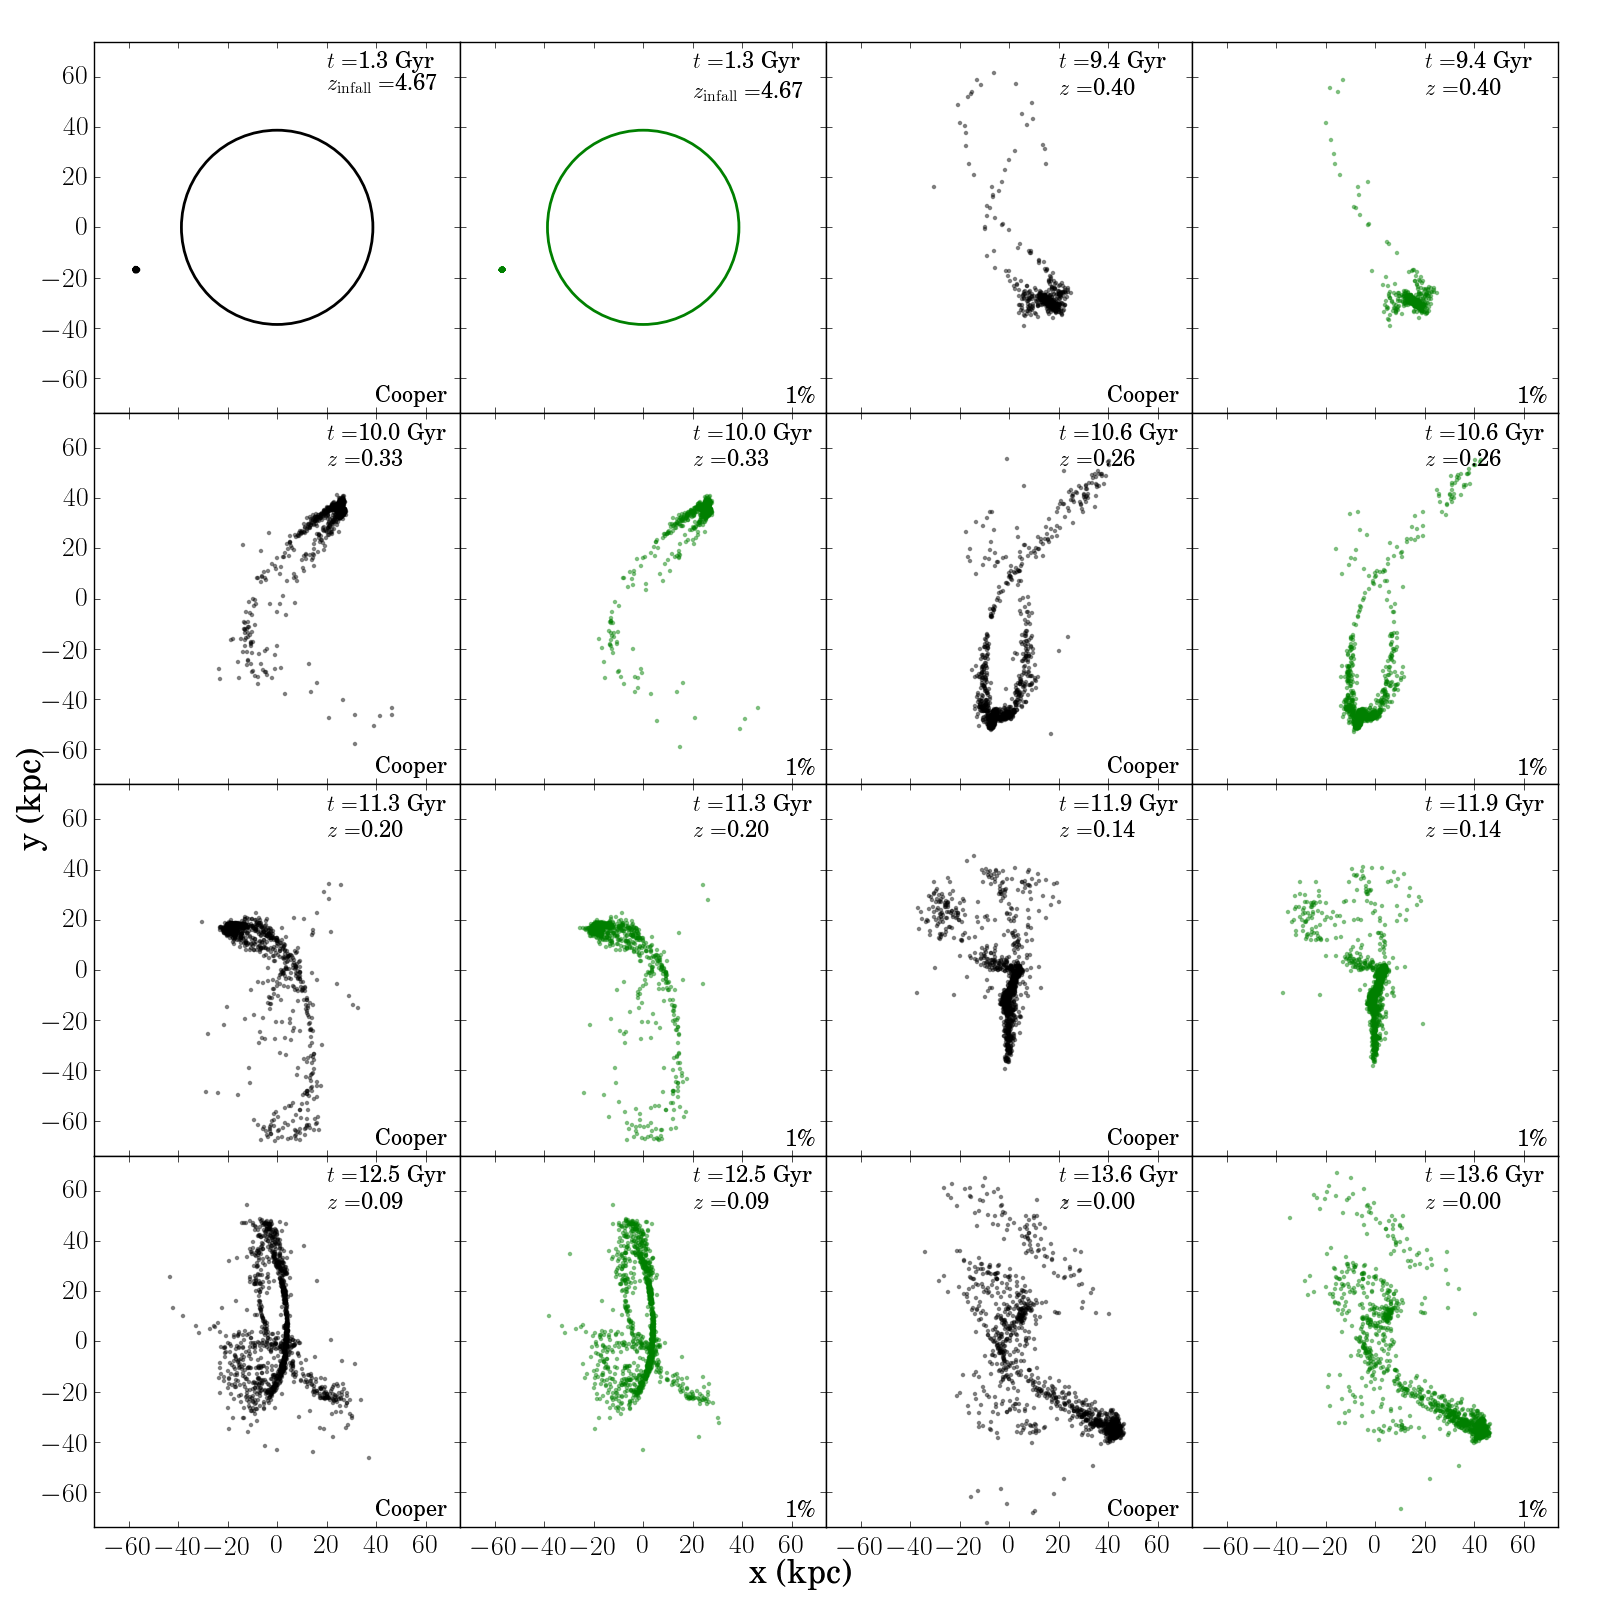
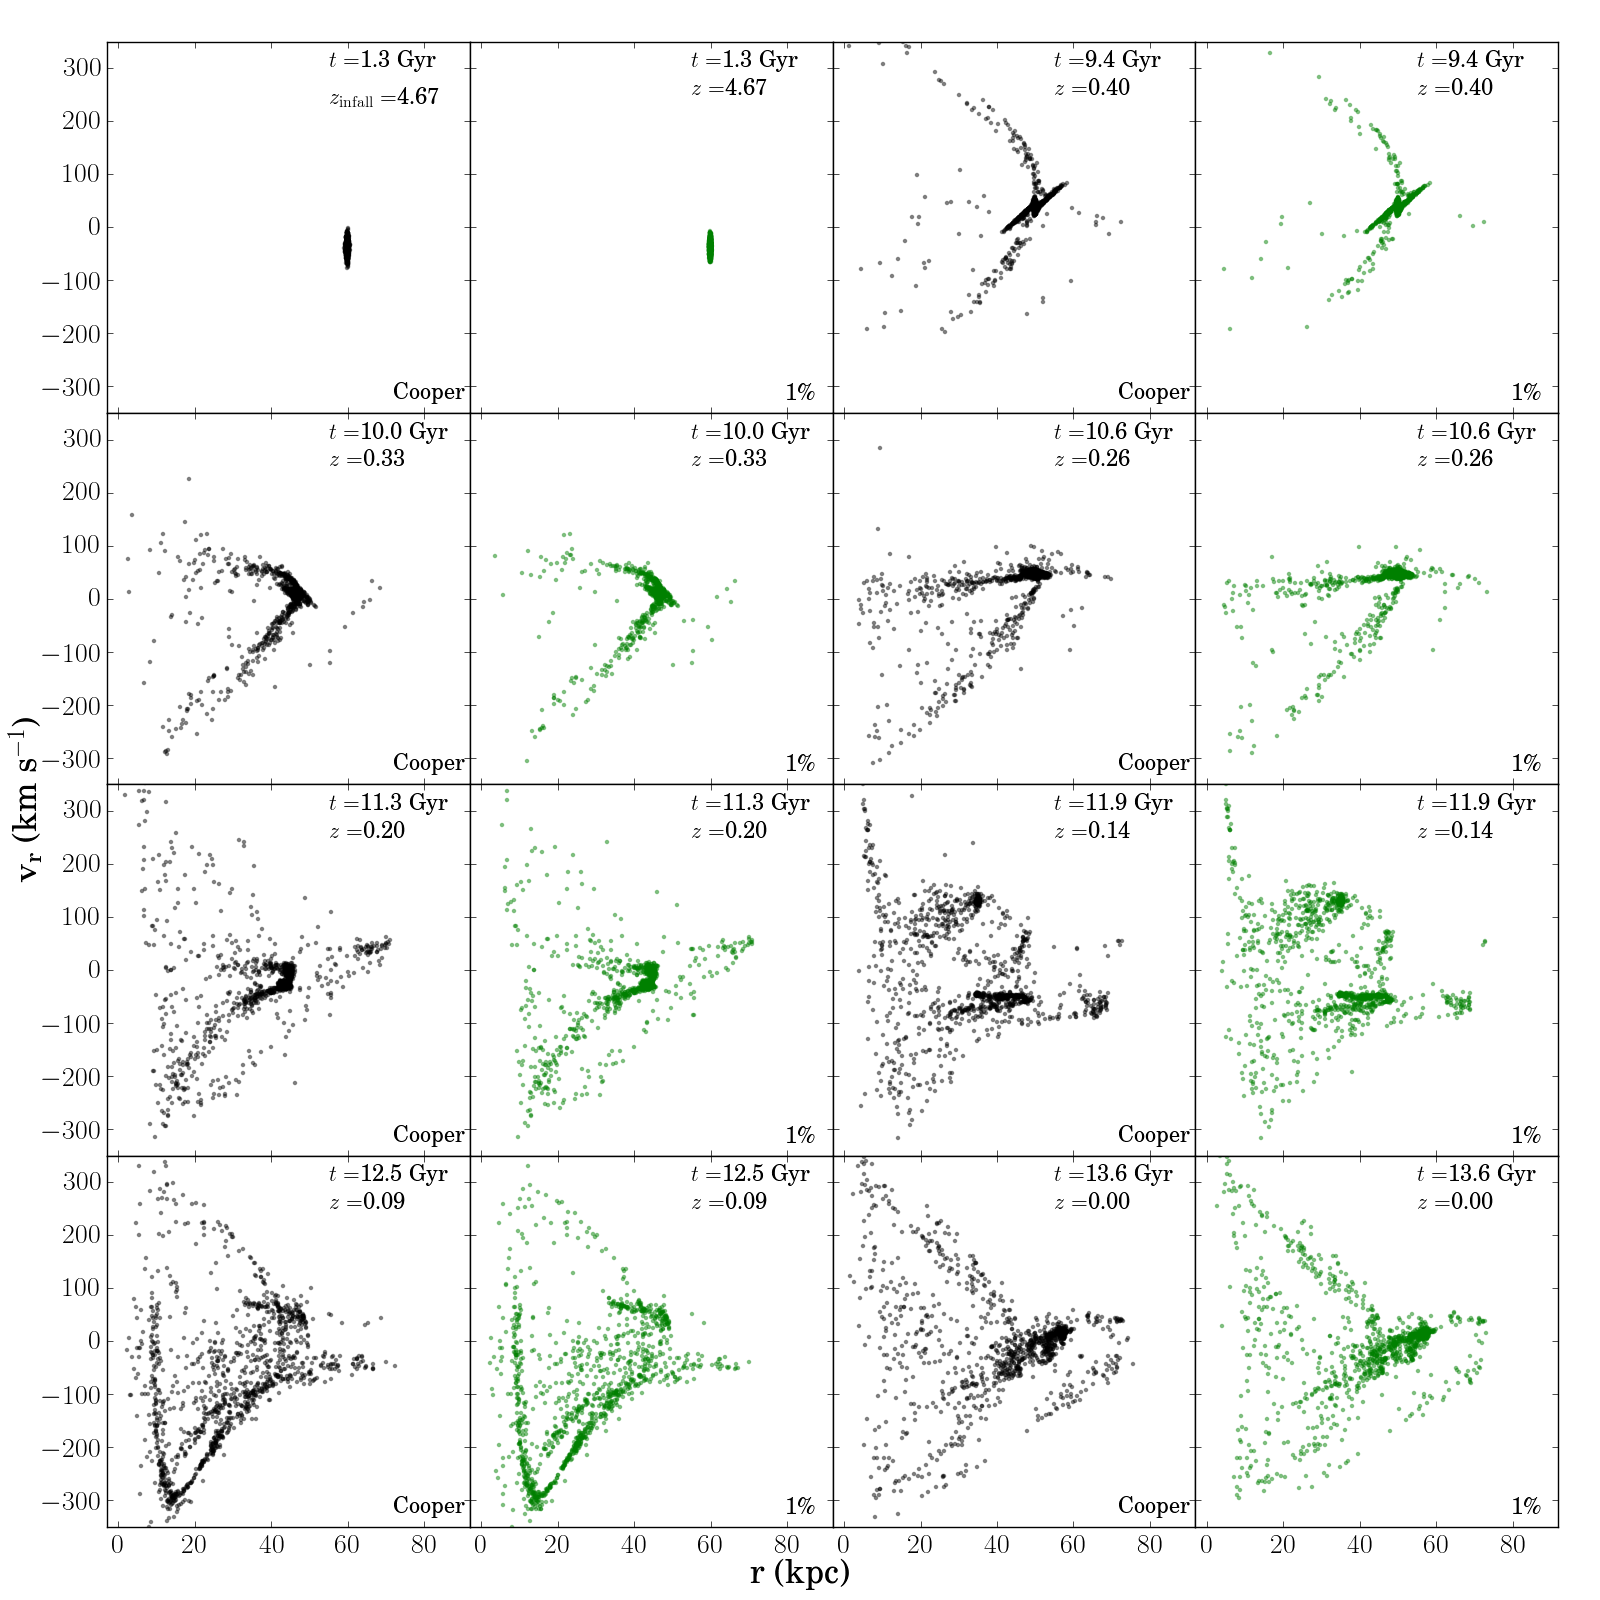
Since we use a different semi-analytic model for our tagging scheme than Cooper et al., the particular subhalos chosen for tagging will generally not be the same between the two schemes, especially at lower masses where reionization and/or feedback can suppress star formation in some subhalos but not others. However, most of the highest-mass subhalos should be tagged in both cases and we can use these to compare the appearance of streams in our new scheme with those in Cooper et al.. Figures 2 and 3 show one such stream that illustrates the differences and similarities between the tagging methods. We will refer to this as stream “C,” since we use it to Compare the two tagging methods. The total stellar mass in this stream is in the Cooper tagging scheme, and in the new tagging scheme. In both cases the progenitor crosses the virial radius as a very compact object (top left pair of panels) that only begins to tidally disrupt several Gyr after infall. Thus the stream is formed relatively recently even though its progenitor joins the main halo very early. In the figure, we plot the particles tagged using each of the two schemes.
The Cooper version of stream C includes about twice as many tagged particles as the version in our new tagging scheme (2056 in Cooper versus 1241 in the new scheme). To highlight differences in the position and velocity of the tagged particles, we downsample the Cooper stream by randomly choosing the same number of particles that are tagged in our new scheme. Once this is done the stream is virtually identical in the two tagging schemes. Figure 2 shows that in the Cooper scheme there are a few more outliers and slightly longer tails of tagged particles; we think these represent particles that were only briefly deeply bound within the subhalo in the past. However, the substructure within the stream, visible in both position (Figure 2) and velocity (Figure 3), persists regardless of how the particles are tagged, confirming that it is not an artifact of the tagging process. As expected, our use of a different SAM also does not affect our results, since it influences only our calibration of what percentage of particles to tag as stars, which is set by comparing with observed bound satellites. The only other way we use the SAM information is to select streams by stellar mass for further analysis, but since the simulated satellites are calibrated to match the luminosity function of the Milky Way satellites (Koposov et al. 2008; Starkenburg et al. 2013), and because we use a wide range of stellar masses (–), we expect our results not to be sensitive to details of the semi-analytic model.
3 Subhalo interactions with an example stream
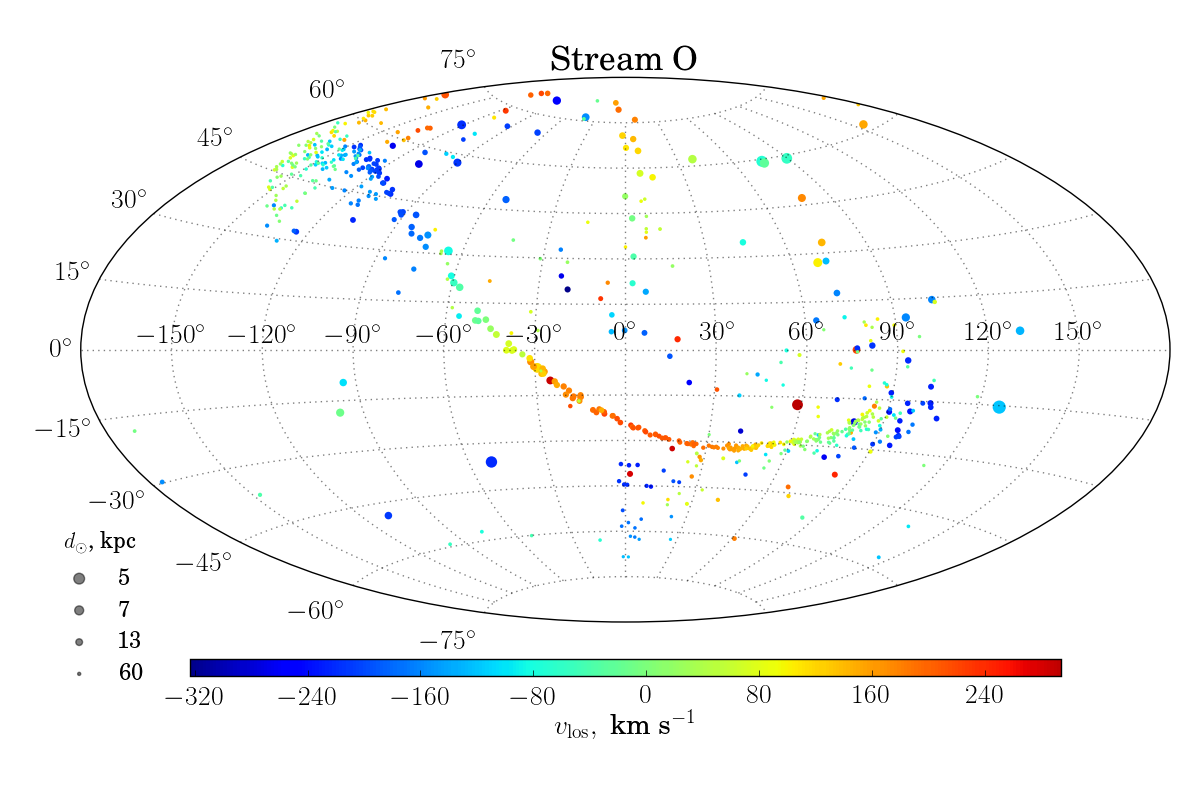
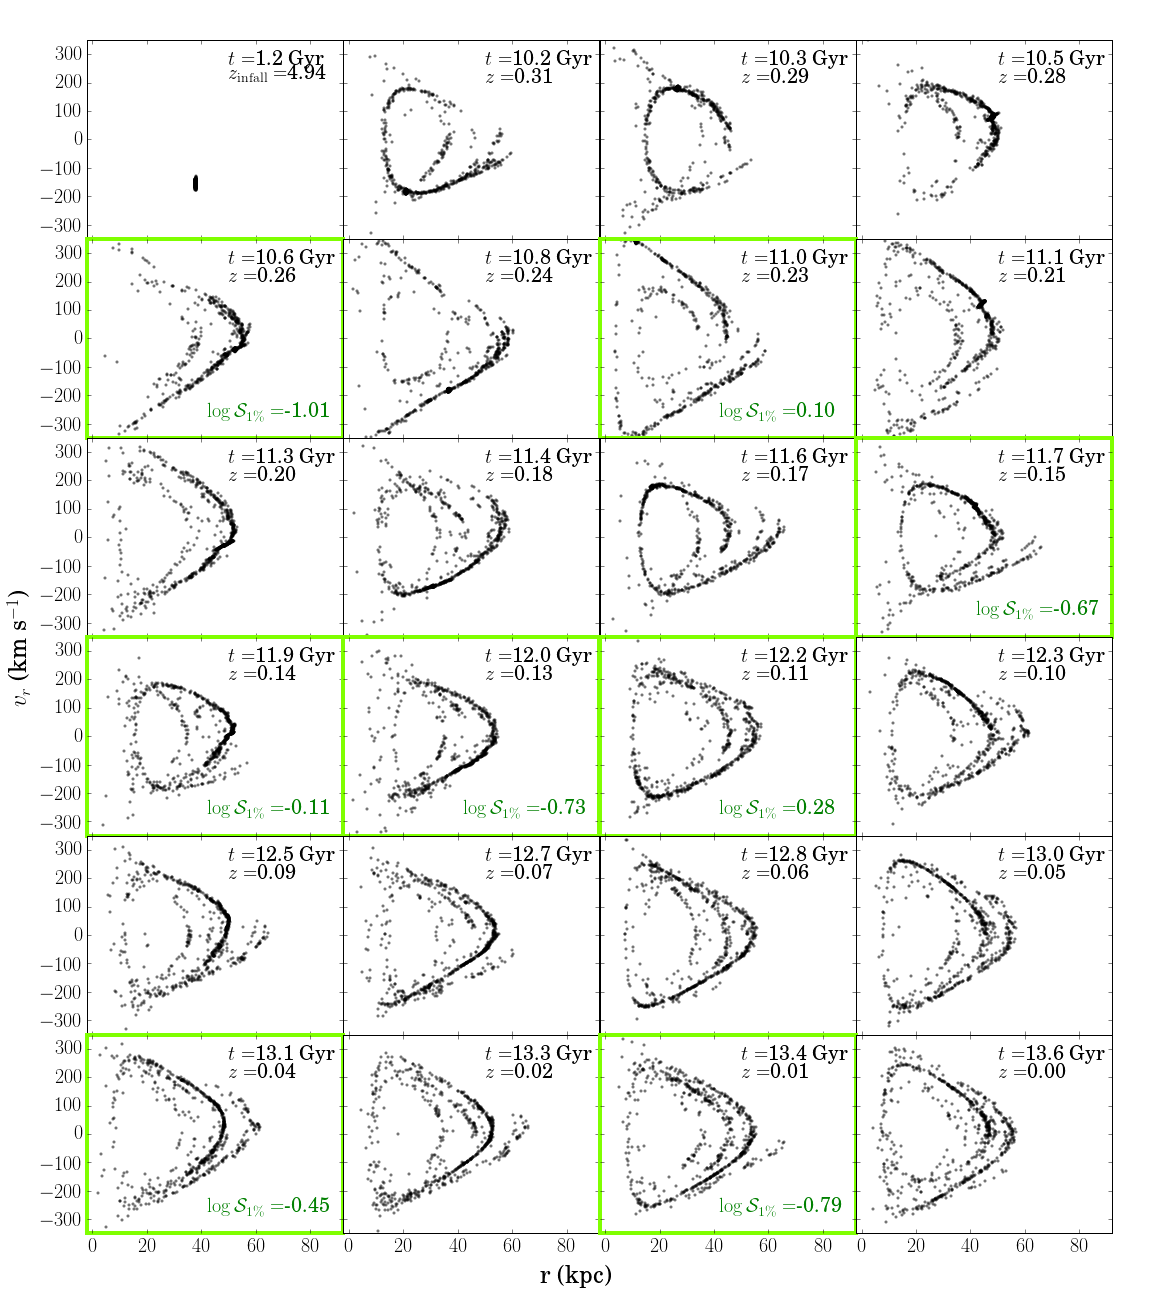
To see how subhalo interactions affect the streams we followed a single stream over time and tracked the number and mass of subhalos that approached the stream within several different threshold distances. We also looked at the evolution of the energy and angular momentum distribution of the stream “stars” (tagged DM particles) over time. The stream we tracked resembles the MW’s Orphan Stream (Grillmair 2006; Belokurov et al. 2007); it has about the same stellar mass ( in Cooper, in our SAM), and its thickness (a few tens of pc) and angular span (about 1 full wrap) at the end of the simulation are similar. We will refer to it as stream “O” (for Orphan). Figure 4 shows stream O “on the sky”, for an arbitrary choice of viewpoint 8 kpc from the center of the host halo. The color indicates the line-of-sight velocity, while the size is inversely proportional to the distance (so that closer stars look larger). A total of 857 DM particles in the progenitor subhalo were tagged with stellar mass using the Cooper et al. method, and 673 were tagged using our new method. The dark matter mass of the subhalo at the time of infall was .
3.1 Initial distribution of the progenitor
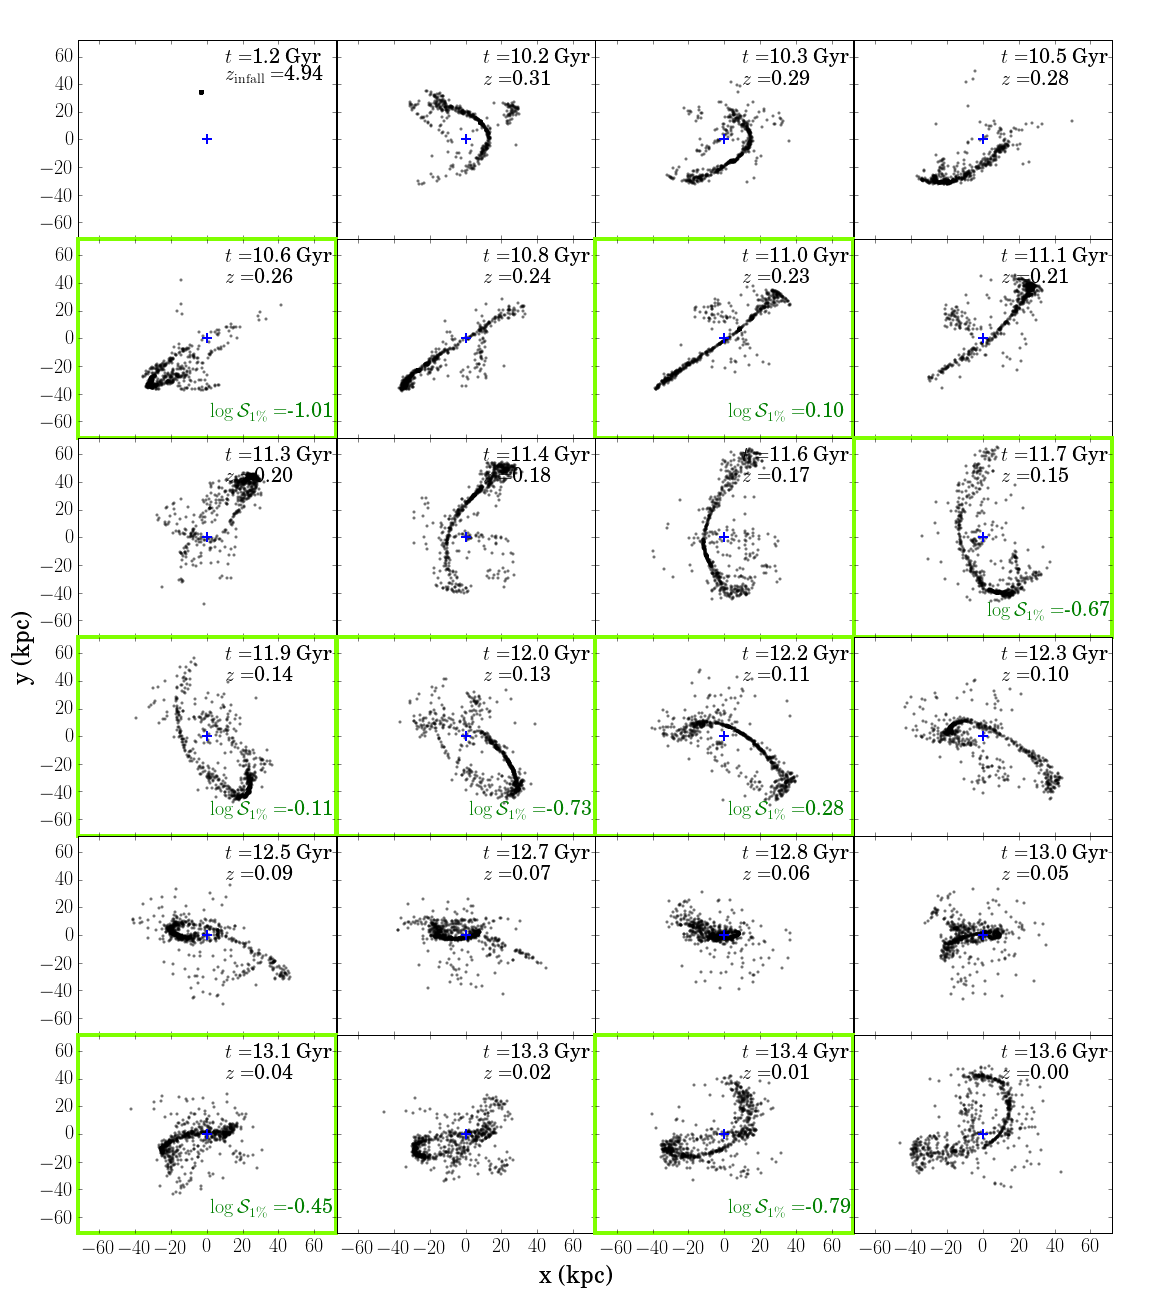
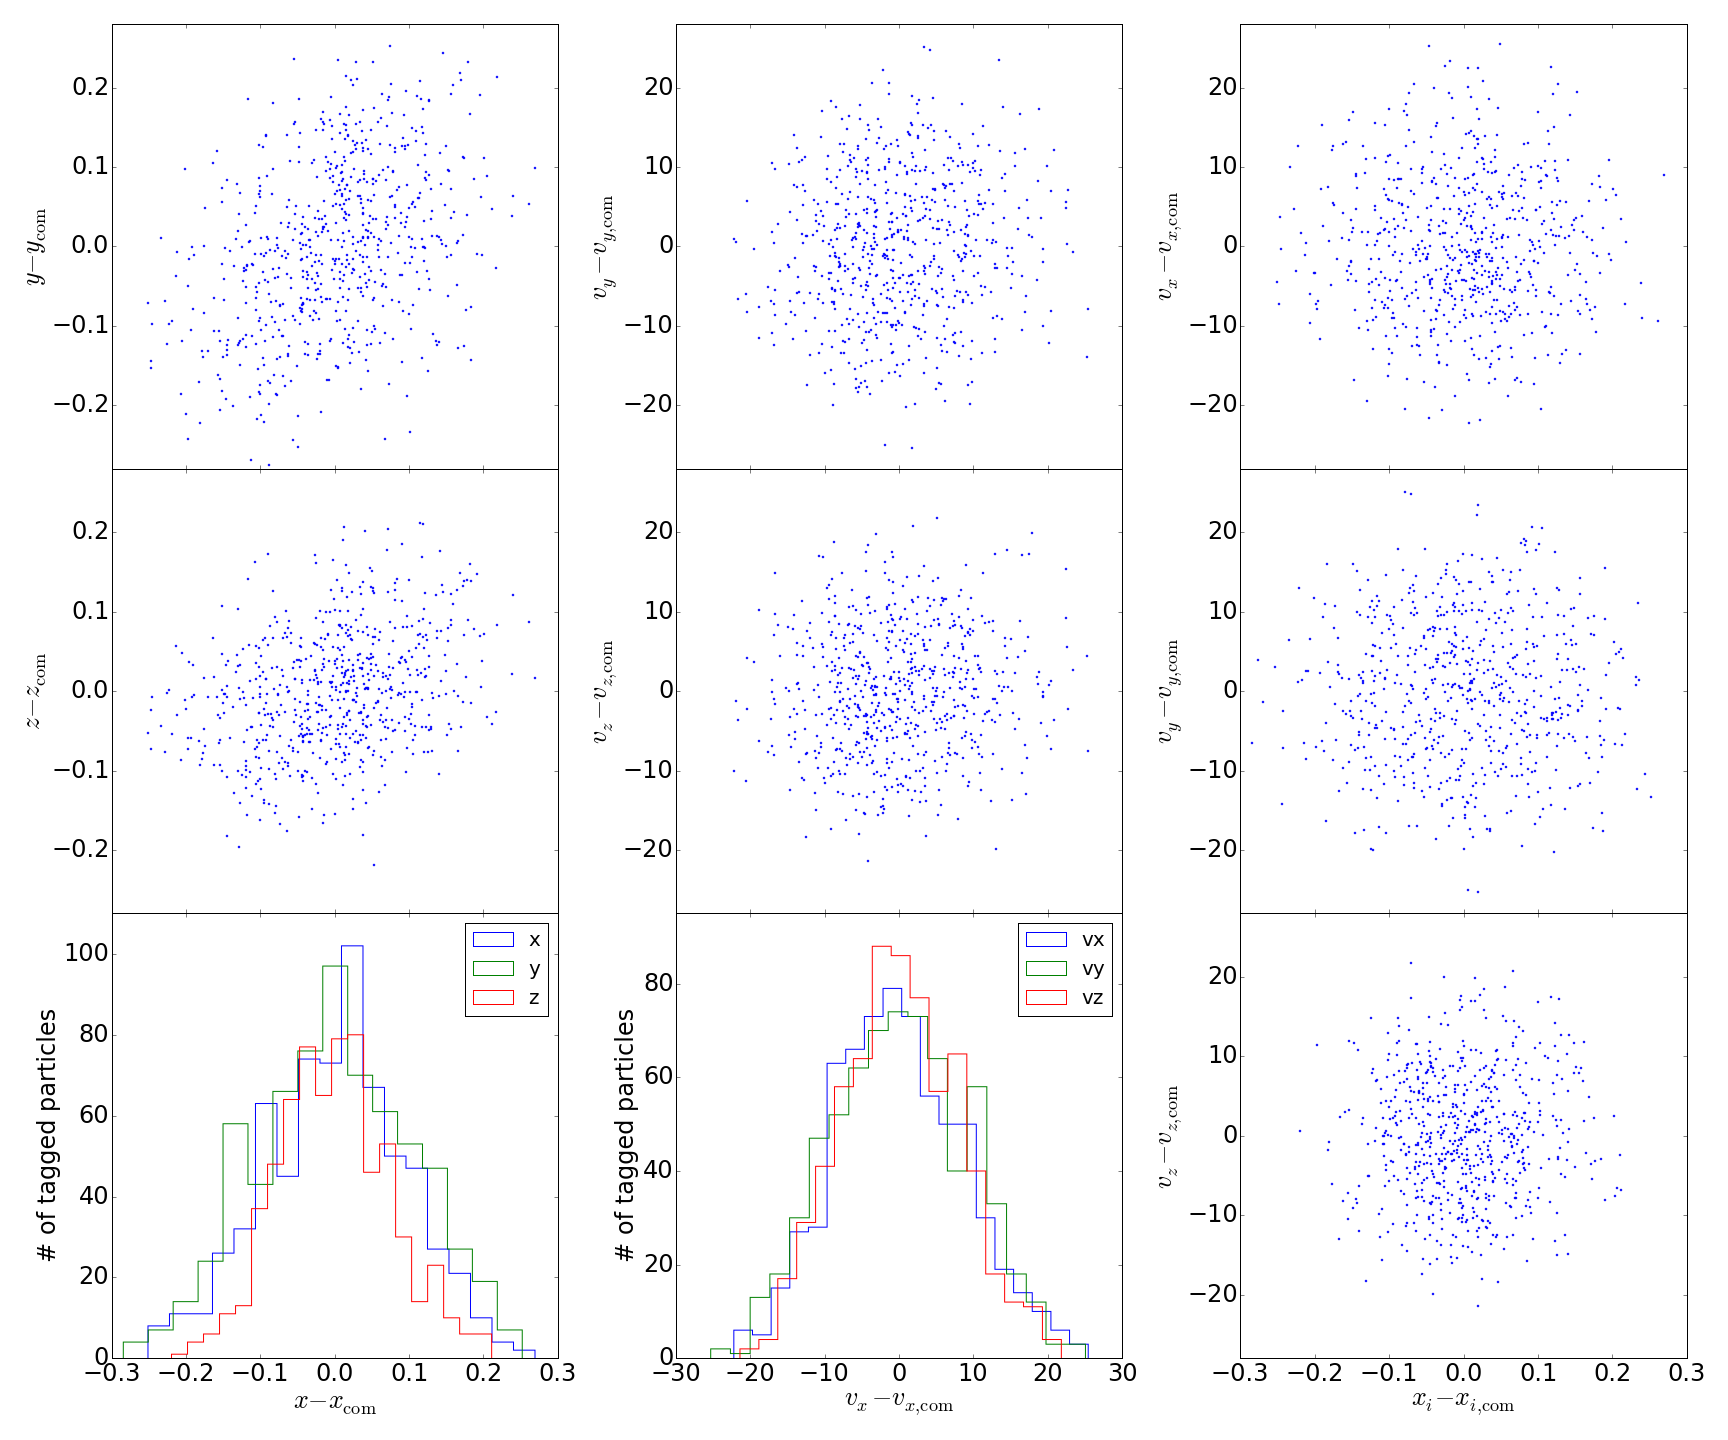
We followed stream O from the point at which its progenitor first becomes a subhalo ( Gyr) until the end of the simulation ( Gyr). The stream is well established by Gyr. It begins to form at about Gyr, after a few pericenter passages within 20 kpc of the galactic center. As the stream evolves it develops gaps and other density perturbations, features that are consistent with previous studies of the effects of encounters between the stream and dark substructure. In particular we see perturbations both in physical space (Figure 5) and projected phase space (Figure 6) for stream O. However, it is important to determine whether these structures were indeed caused by such encounters, whether they arise from pre-existing structure in the stream progenitor, or whether they result from resolution effects. Thus in Figure 7 we examine the distribution of the tagged star particles in the first snapshot where the progenitor is a subhalo of the main (“Milky Way”) halo, hereafter referred to as the “infall” snapshot. It appears from the figure that no prominent phase-space correlations exist in the progenitor; the distribution in every coordinate is smooth and roughly Gaussian. If this is so, then the smaller-scale structures apparent in the stream must have been produced after infall. However, some “holes” are barely distinguishable in the distribution: one example is in the upper left-hand panel of Figure 7 at about (-0.05,0.05). This sort of feature may be due to shot noise in sampling the distribution, and so could also lead to an apparent gap if the noise is correlated in position and velocity. Therefore we wish to confirm that features on this level are consistent with the expected Poisson noise given the number of star particles in the stream.
To confirm quantitatively that the stream starts as a smooth distribution (down to the shot-noise limit) we calculated the mutual information of the distribution in phase space at the infall snapshot. The mutual information compares a distribution to the product of its marginals :
| (1) |
where is the number of dimensions of . In our case, represents the phase-space density of the progenitor ( represents the six-dimensional phase-space position of a particle), normalized by the number of particles so that it integrates to unity. If the distribution is purely a smooth, multivariate Gaussian in all dimensions, with correlation matrix , then we expect to be (Kullback 1959, Chap. 9)
| (2) |
In the case of additional substructure within the distribution, . To test whether additional substructure exists, we first calculated for our distribution and obtained an analytic value for of 0.15. Then we used the EnBID density estimator (Sharma & Steinmetz 2006) to calculate for the infall distribution of the 673 star particles in stream O by Monte Carlo integration, obtaining a value of 0.31, about a factor of 2 higher than the analytic estimate. However, previous tests have shown that at small this numerical estimator tends to be biased high for samples with a low number of points, so we also constructed 100 random samples of 673 points from a multivariate Gaussian distribution with the same mean and and estimated from these samples, obtaining a value of 0.35, statistically identical to the value for the actual phase-space distribution. Thus we can safely conclude that there is no more structure present in the infall distribution than would be expected for a smooth multivariate Gaussian.
3.2 Frequency, velocity, and mass of interacting subhalos
The effect of a subhalo encounter on a stream can be assessed, at zeroth order, by determining whether its distance of closest approach to the stream, , brings it close enough that the potential energy of the nearest stream stars with respect to the subhalo (of mass ) is comparable to the kinetic energy of the stream stars, which move at a velocity in the rest frame of the subhalo. Thus the condition for a “strong” encounter can be expressed as
| (3) |
where is Newton’s constant. One could therefore define a dimensionless ratio, the “strength” of the encounter, characterized by the scaling of Equation 3:
| (4) |
so that strong encounters have . However, this criterion is quite conservative compared to what would actually be needed to induce a local gap in a stream: an interaction could for example reverse the direction of motion for stars in the stream, where what is actually needed to produce a gap in a coherent stream is to change the velocities of a small group of stream stars by an amount comparable to the stellar velocity dispersion, which is usually a few percent of (i.e. a few km/s). This likewise corresponds to a few-percent change in the kinetic energy of the stars in the stream, so we choose to rescale by the fractional velocity change ,
| (5) |
and set so that an interaction changes the velocity of the interacting stream stars by one percent. Thus we define the quantity , using
| (6) |
as a way to tell how likely an interaction is to open a gap in the stream.
By following stream O through the simulation, we can track the encounters it experiences and ask how many of them fit this basic criterion. To determine the type and rate of interactions between stream O and subhalos, we counted the number of subhalos in each snapshot for which the most-bound particle in the subhalo passed within , 2, and 5 kpc of any star particle in the stream. We also counted how many subhalos passed within one or two times their half-mass radius, , reflecting the region of influence in which we expect a subhalo to significantly alter the orbits of the stream stars. We tracked the identification numbers of the subhalos interacting with the stream to determine whether there were any repeat encounters with the same subhalo in different snapshots.
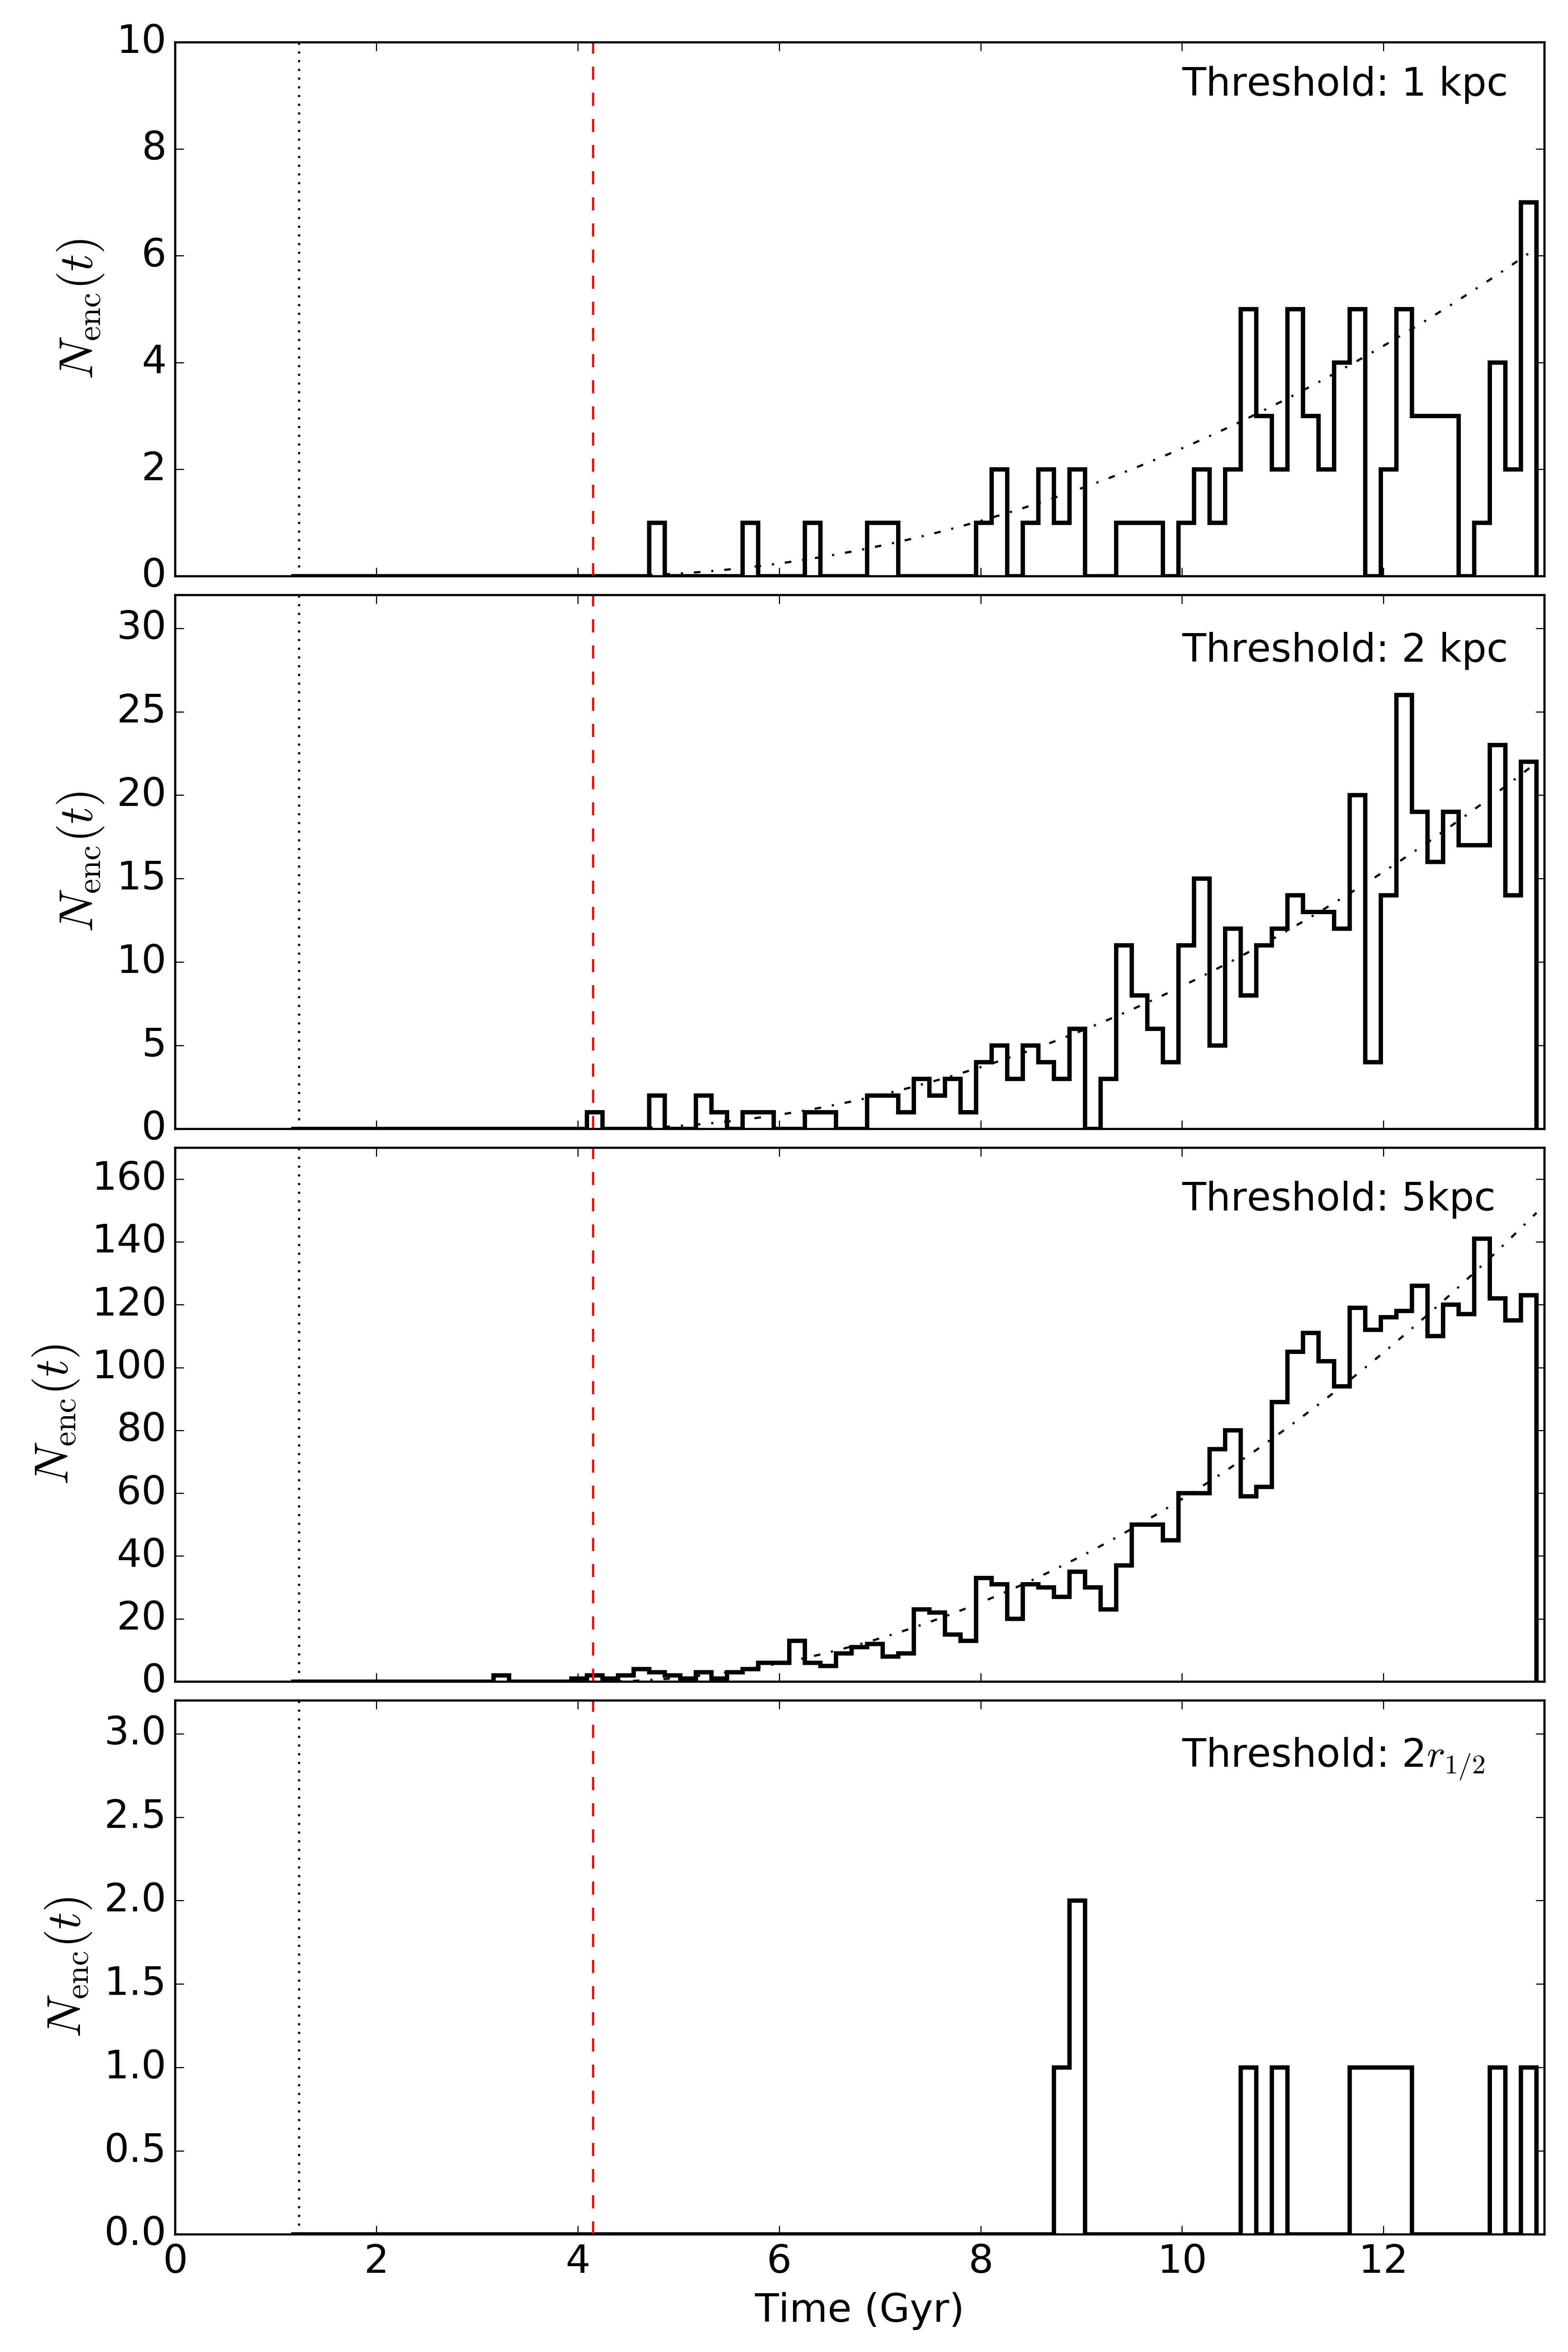
The number of subhalos interacting with stream O in each snapshot, at the various distance thresholds, are plotted in Figure 8. The threshold is not shown as there is only one interaction within this threshold over the course of the simulation, at 12 Gyr with a subhalo. This is not too surprising given that for most of the interacting subhalos, is much smaller than 1 kpc. As expected, the interaction rate increases with time as the stream increases in length, and roughly follows the scaling predicted by YJH (dot-dashed lines), beginning at the start of the formation of the stream at 6 Gyr. The number of encounters starts to fall beneath this scaling at late times, especially in the 2 and 5 kpc panels. We think this is due to particle resolution effects, which we discuss in more detail in Section 4.4. We do not see any pattern in the number of events with time for the threshold (bottom panel), which is consistent with noise. Particle and time resolution probably combine to cause us to miss many of these encounters, so based on this result we decided to analyze encounters for the subhalo-dependent thresholds only in aggregate, and do not calculate rates for individual streams.
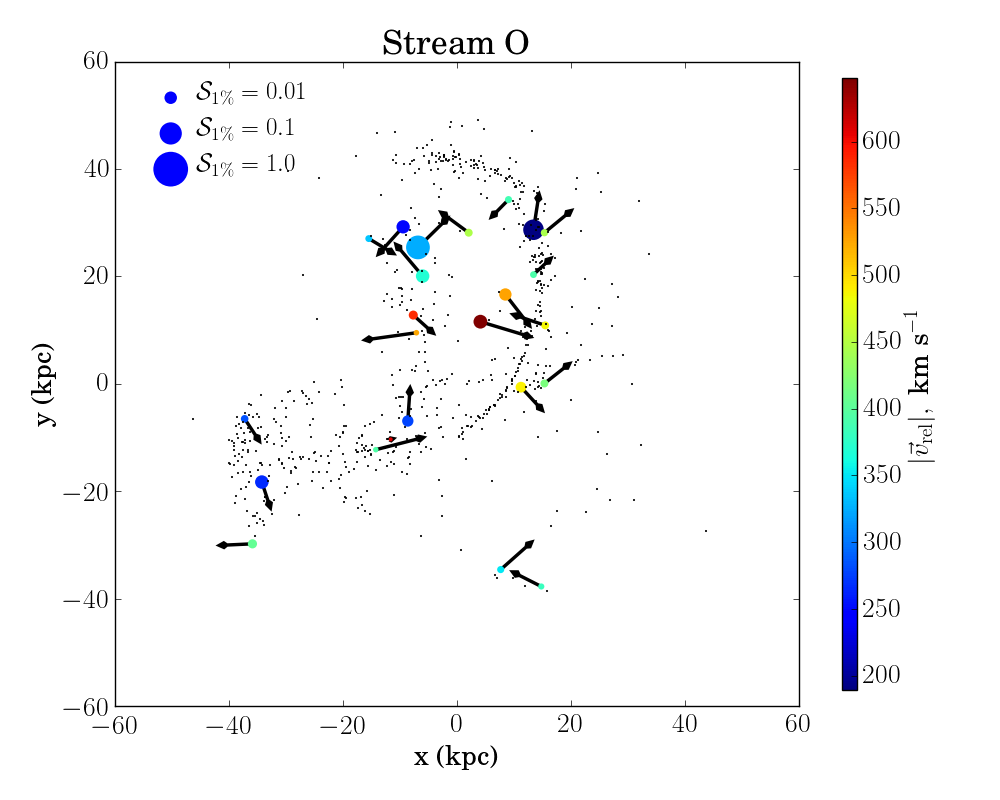
Figure 8 illustrates clearly that in any given snapshot after stream O is formed, it is interacting with many subhalos: up to 6 at a time within 1 kpc and up to 26 at a time within 2 kpc. Figure 9 shows the stream with all subhalos within 2 kpc at present day. The velocities of the subhalos do not appear to be correlated with the velocity of the stream, implying that these subhalos did not simply fall in at the same time as the stream progenitor on similar orbits and follow the stream through space, but are passing though the stream with many different impact angles. This is also illustrated when we examine the interaction data for repeat encounters: one would expect these to occur frequently if the subhalos responsible for the interactions fell in with the stream along similar orbits. However, Figure 10 shows that all but one of the interactions inside 2 kpc are one-time events.
We recorded the relative velocities of the interacting subhalos with respect to the stream stars within the threshold distance, in order to rank encounters by their strength and determine whether the field of perturbers is truly isotropic. For each subhalo interaction we identified the stars within the threshold distance and calculated the average vector velocity of those stars component-by-component:
| (7) |
Then we determined the relative velocity by subtracting this from the velocity of the subhalo:
| (8) |
The vector relative velocity was tabulated for every interaction in every snapshot.
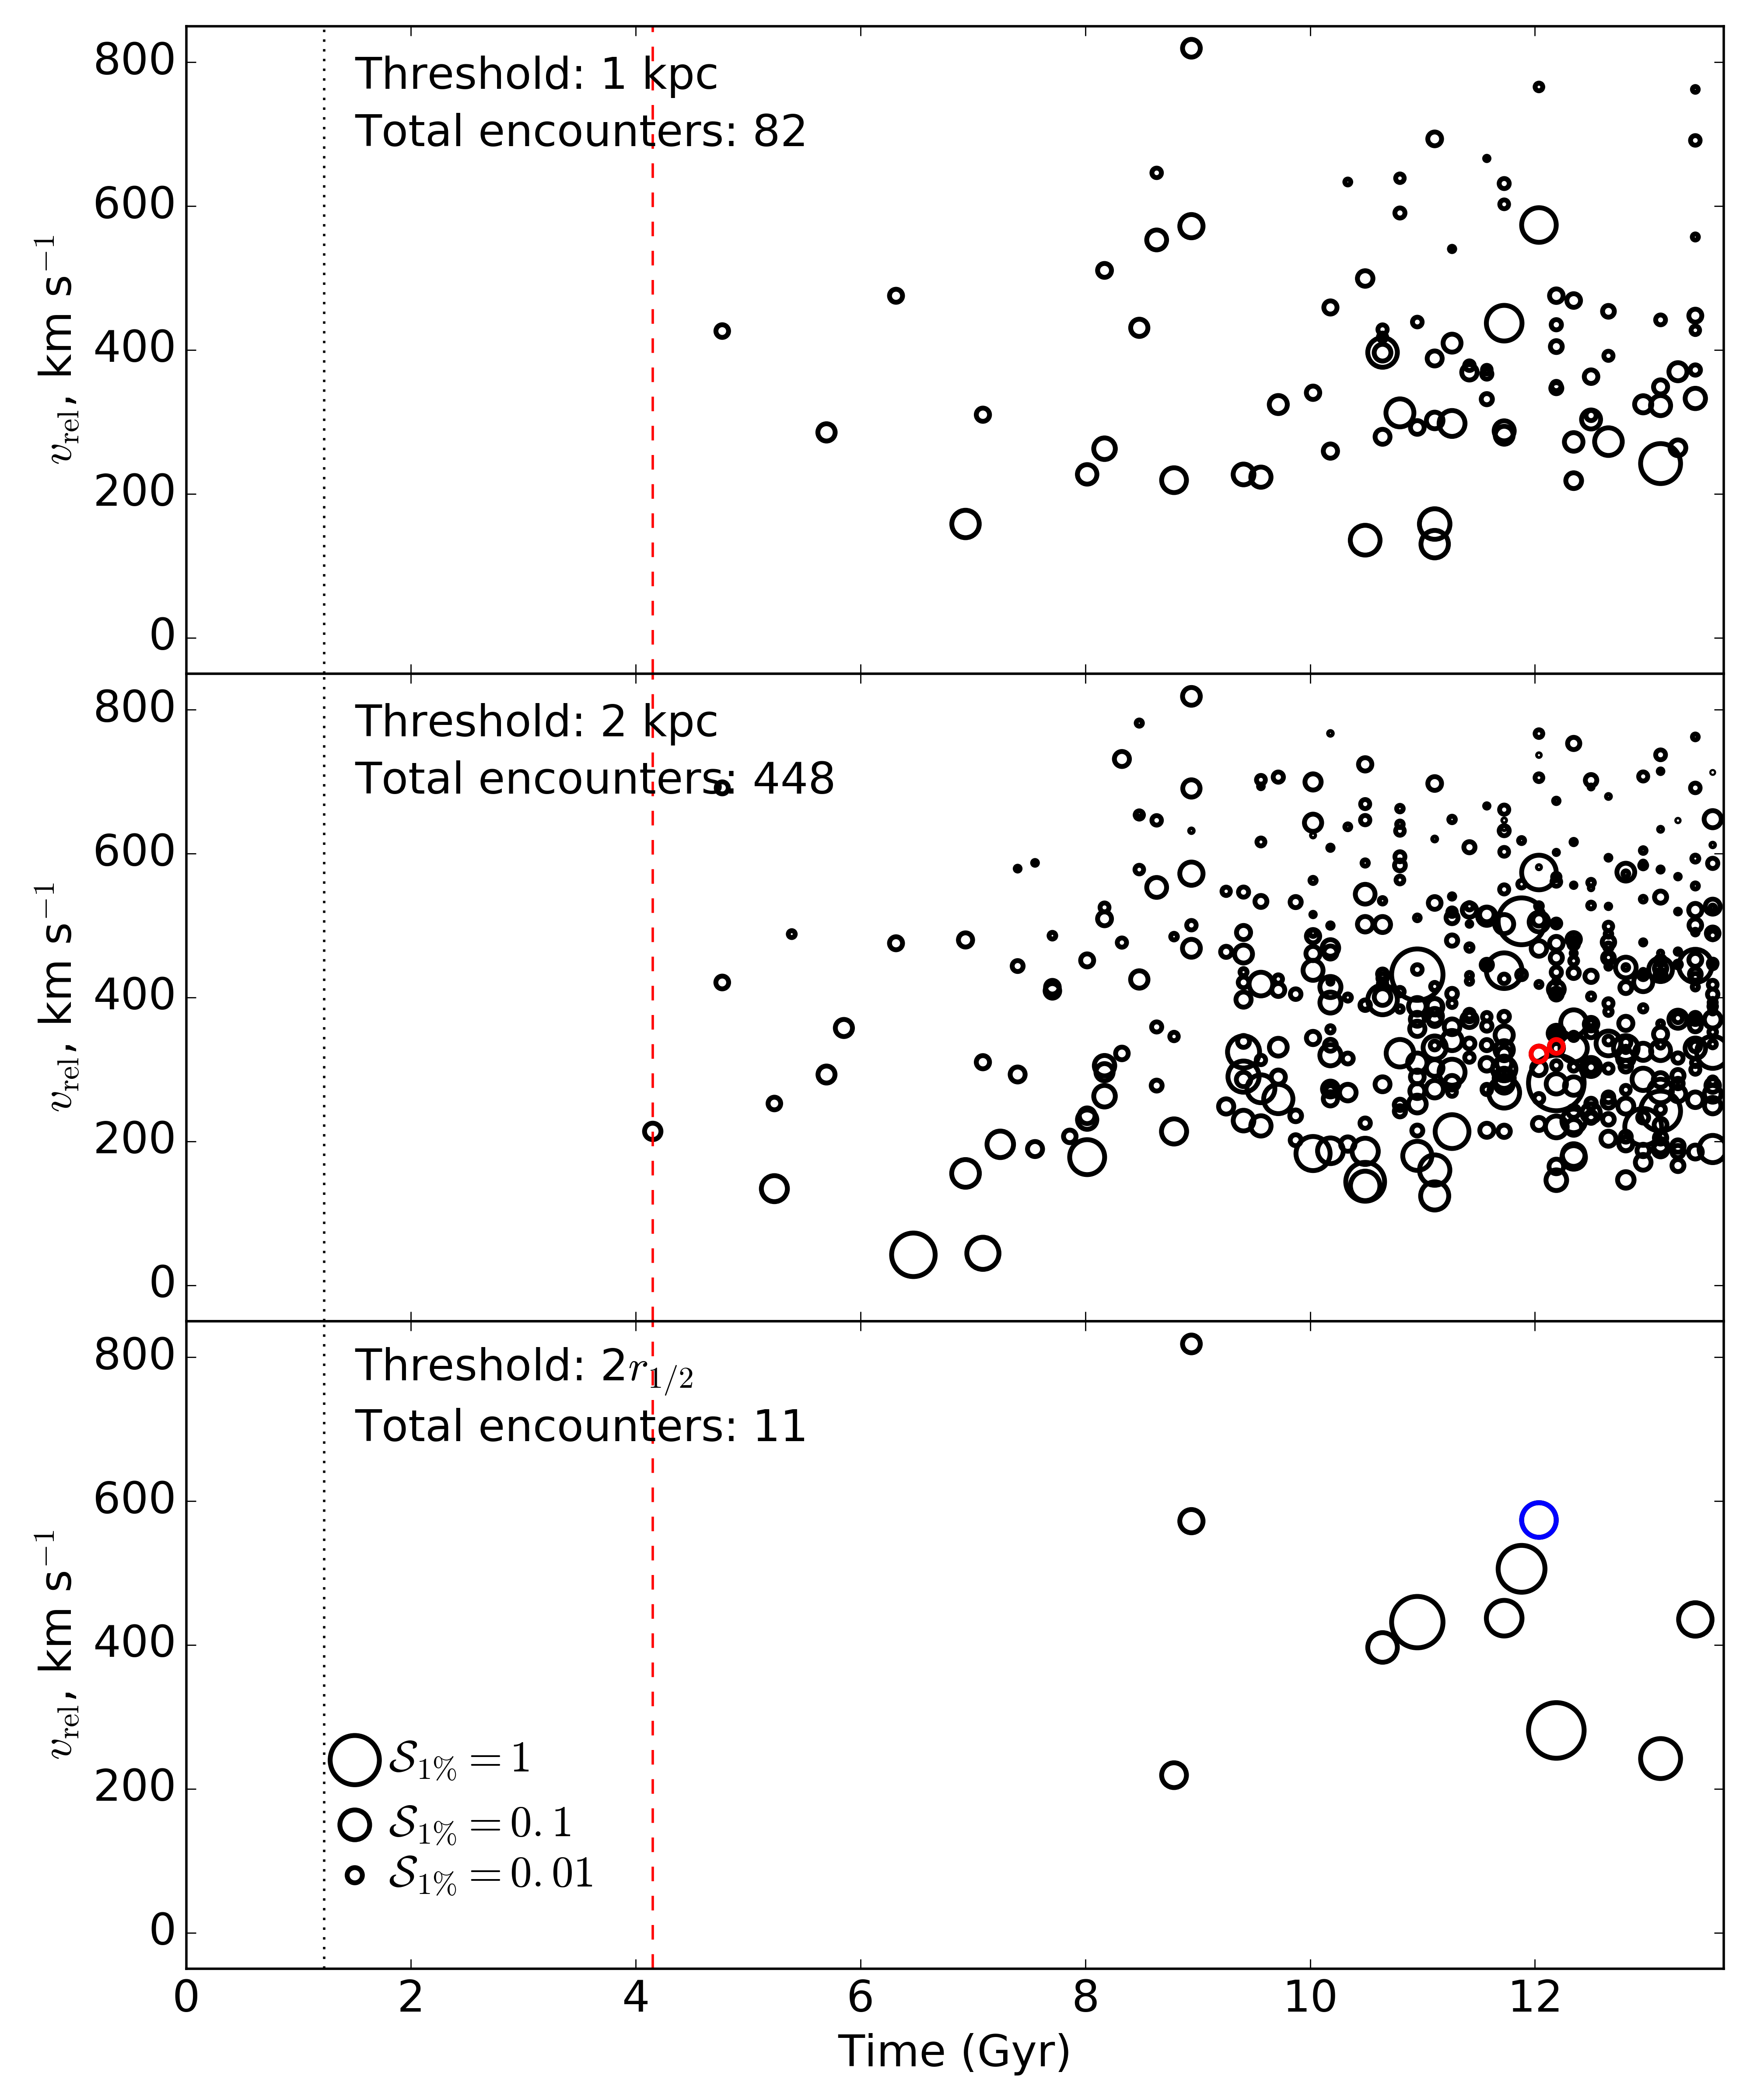
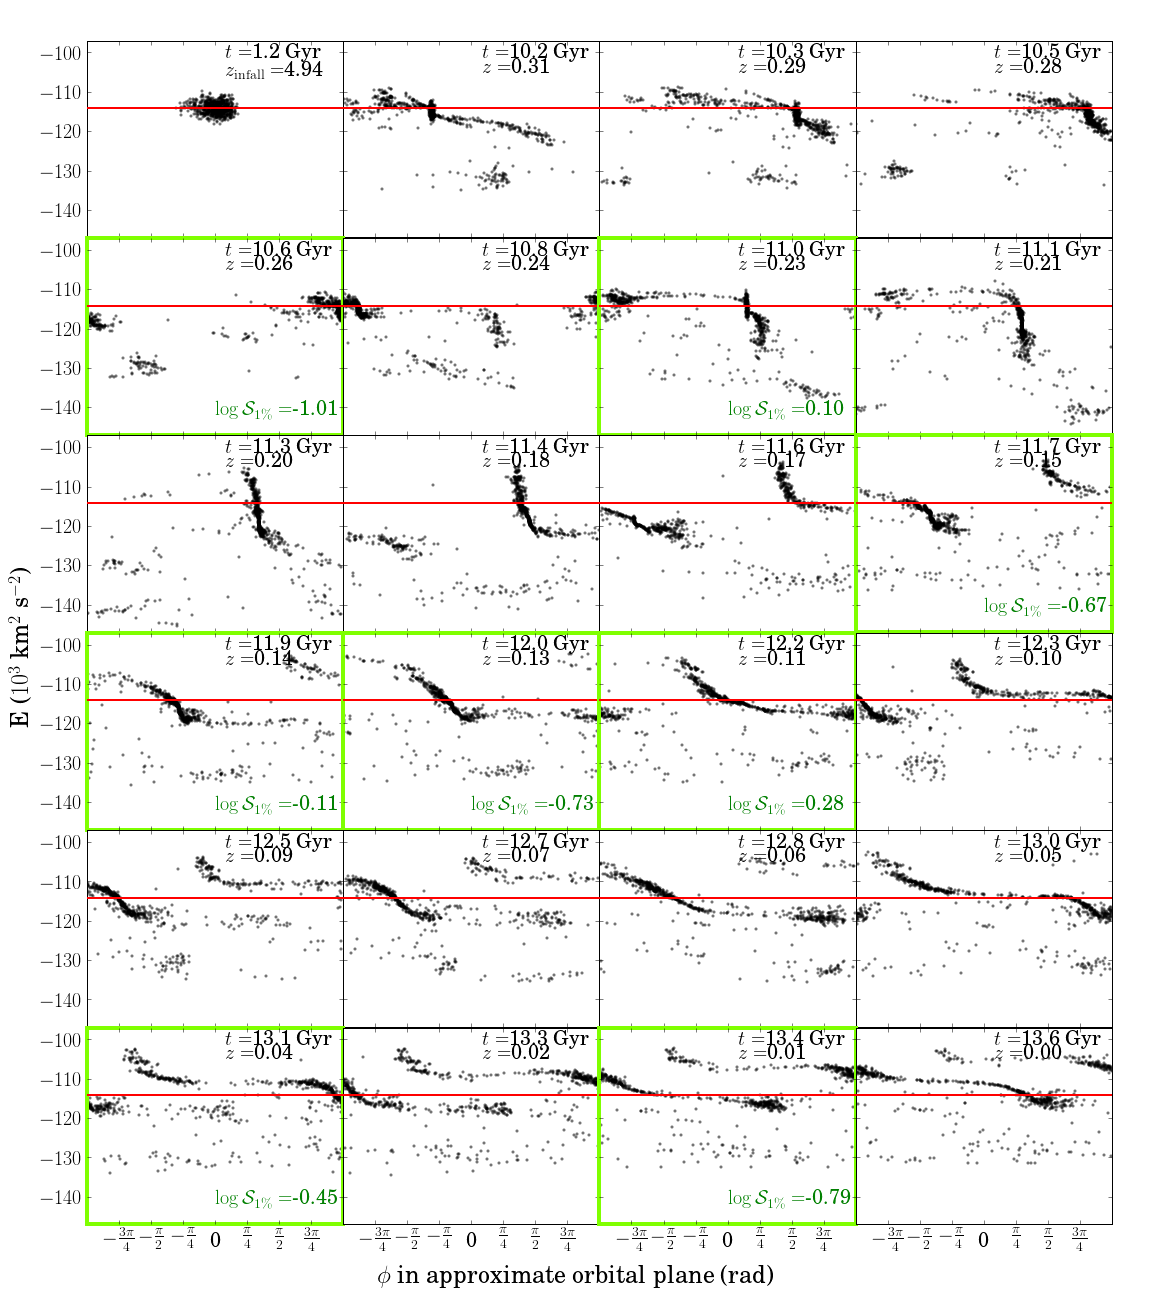
Figure 10 illustrates how, although many subhalo interactions do occur, most of them are likely too weak to substantially alter the stream. The size of the symbols in the figure correspond to the strength of the encounter as defined in Equation 6. The relative velocity is determined using particles within the impact parameter , so can vary slightly for different impact parameters. For the fixed distance thresholds, the mass distribution of subhalos in encounters reflects the steepness of the halo mass function in general, so one would expect most of the encounters to be very weak but also very frequent. Figure 10 shows that numerous relatively weak encounters are generally the rule over the lifetime of the stream. Only a handful of subhalos come within of the stream over its lifetime, mostly more massive subhalos since these have larger half-mass radii. As shown in the bottom panel, selecting encounters with is similar (though not identical) to selecting encounters with large , which are those most likely to open a gap in the stream.
3.3 Energy and angular momentum evolution
The encounters between stream O and subhalos also leave an imprint on its energy and angular momentum distribution. Based on the results of YJH and the work of Carlberg and collaborators (Carlberg 2009, 2012a, 2012b, 2013; Ngan & Carlberg 2014; Carlberg 2015a; Ngan et al. 2015; Carlberg 2015b), we expect that the strongest subhalo encounters will rearrange part of the stream’s energy-angular-momentum distribution. To investigate this, we followed the energy over time (including a computation of the potential energy directly from the N-body snapshot) as a function of the relative phase of the stream particles, as shown in Figure 11. To compute the phase angle , we rotate the stream into the plane perpendicular to its mean angular momentum , then compute the angle , where , are coordinates in the rotated frame. The angular momentum direction is not constant in time, as one would expect given that the potential is triaxial, and in fact it changes by of order 90 degrees over the course of the simulation. Since this change is large, we use the angular momentum of the stream in a given snapshot to compute the phase angle, so the orbital plane in each panel of the figure is different. The average energy at infall (red horizontal line) is roughly preserved as a function of time.
At =10.2 Gyr long tidal tails have already formed around the remaining bound structure, and show signs of disturbance especially along the ends. There is also some structure that appears disconnected from the main energy distribution, around ; this material was energetically detatched from the main body at around 8.2-8.3 Gyr. From about 11–11.5 Gyr the tails appear to rotate vertically in this view; Figure 5 shows that this is because most of the stream is near apocenter.
The closest encounter (within ) is with a subhalo at 11.7 Gyr. The time-resolution of the snapshots prevents us from drawing a direct connection between either of these encounters and specific changes in the energy distribution of the stream stars, but the types of discontinuous features seen in the figure are reminiscent of those found by YJH in their simulations of a globular-cluster-like stream. Suggestively, the trailing tail in the 11.9 Gyr panel is sharply truncated. None of these so-called “gaps” are entirely devoid of star particles, but manifest rather as low-density regions. As time goes on the stream continues to lengthen, but displays significant variations in density that also widen with time. These gaps were likely created by subhalo encounters, but although we can identify snapshots where some of the closest encounters occur, the disturbances are so small in energy (recall is a one-percent change in kinetic energy) that they are hard to identify in energy space in the same snapshot. Because the effects appear only after a delay while the gap grows in size, we cannot with certainty connect a particular subhalo encounter with a specific stream perturbation at the time-resolution available in this simulation.
4 Statistics of stream-subhalo interactions
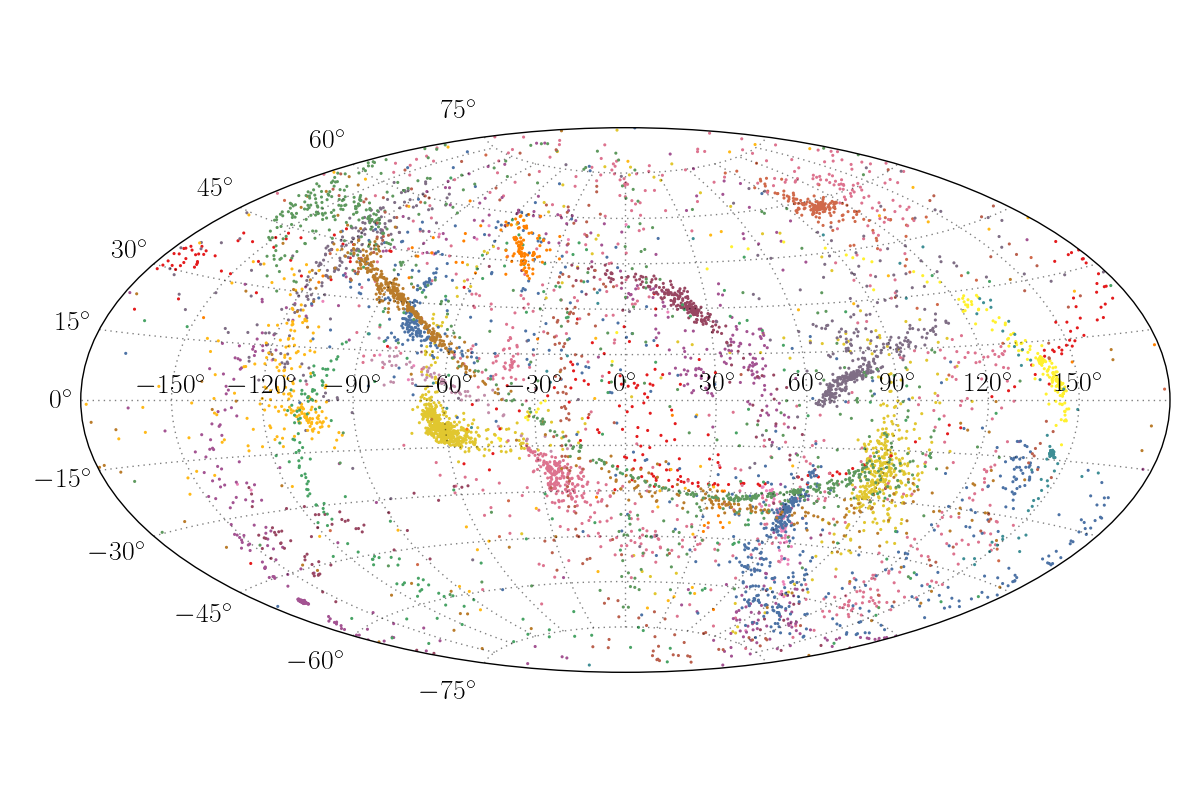
We also considered a larger subset of streams in the Aq-A-2 halo that appear thin at the present day based on the retagging of star particles described in Section 2. First we selected all streams with stellar mass between and . Then we visually inspected the present-day configuration of these streams and picked ones that were thin and not well-mixed in position and velocity space. These criteria resulted in a total sample of 18 streams, shown in sky projection in Figure 12. For convenience we labeled these streams with letters from A to R, with stream O assigned as before. Stream C, which was used in Section 2 to compare the different tagging schemes, is above the high end of this mass range and so is not included in the sample: we wanted a very well-resolved stream for the comparison of the methods, but the last panel of Figure 2 shows that this stream is fairly thick and disorganized at present day.
 |
 |
4.1 Measuring the lengths and ages of streams
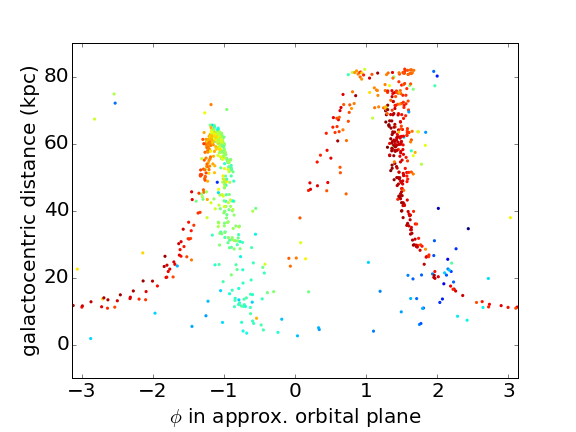
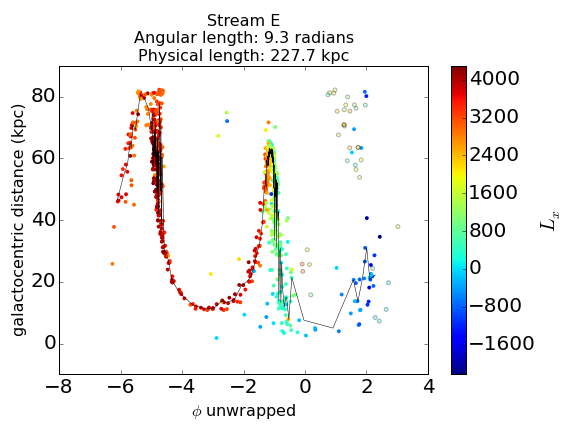
Since the streams have a wide variety of orbits and ages, we wished to normalize the interaction statistics by the length of each stream at the present day and by each stream’s age. To measure stream length, we first calculate the phase angle as described in Section 3.3. An example is shown in the left panel of Figure 13. The stream must then be “unwrapped” in , which we accomplish by adding and/or subtracting multiples of for subsets of the stream particles so that the components of the angular momentum (in the unrotated frame) vary continuously, since overlapping wraps tend to have very different values of at least one angular momentum component (right panel of Figure 13). To track the continuous variation of we pick the component in the unrotated frame which has the widest range of values; in the example shown in Figure 13 this is but it varies from stream to stream. Stream particles that are outliers in angular momentum and cannot be assigned unambiguously to a particular wrap are masked (light circled points in the right panel of Figure 13). The angular span is derived by taking the range of the unwrapped angle without the masked particles, and the physical length is computed by binning small numbers of consecutive particles in the unwrapped coordinate, computing their average radius and angular range , and calculating the Riemann approximation
| (9) |
The number of particles per bin ranges from 1 to 10 depending on the number of particles in a particular stream, and is adjusted to give a relatively smooth approximation to the stream everywhere (thin black line in the right panel of Figure 13).
As shown in the case of Stream O, there is usually a delay between the time that the parent halo becomes a satellite of the main galaxy and the time when a stream begins to form. We therefore determined for each stream in our sample the point when the stream started to form and used this to calculate the stream’s age. To do so we compared the largest and smallest eigenvalues of the covariance matrix of the positions of the tagged star particles associated with each stream as a function of time. Before the stream starts to form, the stars are all still bound to the satellite so all three eigenvalues should be similar, while once the satellite begins to tidally disrupt, one eigenvalue (the one along the spreading direction) will become much larger. In practice, the ratio of largest to smallest eigenvalue is between about 1.5 and 4 for all our streams while in the satellite phase, and increases rapidly once the stream starts to form. As the stream wraps around the galaxy the ratio of eigenvalues begins to oscillate, and can decrease again as the stream becomes phase mixed, but the initial increase is diagnostic in every stream we examined. Based on this behavior we identified the snapshot where the ratio of eigenvalues is first larger than 5 as the start of stream formation, found the corresponding formation time , and computed the age as
| (10) |
Encounters before are very rare (less than one per stream) thanks to the small cross-section of the bound progenitor, so we consider the number of interactions since infall to be equivalent to the number since formation.

4.2 Relative velocities of interactions
Figure 14 shows the distribution of encounter speeds for three bins in subhalo mass. We used a two-sample Kolmogorov-Smirnov (K-S) test to determine whether different-mass subhalos are drawn from the same speed distribution by comparing pairs of distributions in different mass bins for the same threshold. For the mass-independent thresholds shown in the figure, the K-S test generally detects a difference between the distributions in different mass bins where there are enough subhalos in the sample to do so, and the certainty with which one can conclude the distributions are different increases with the sample size. For the mass-dependent thresholds (not shown) the K-S test says all the distributions in different mass ranges are indistinguishable (), probably due to the small sample size.
To investigate differences in the relative speed distribution for different subhalo masses, we fit a Maxwell-Boltzmann (M-B) distribution to the CDF of relative speeds for each mass range shown in Figure 14. Although the M-B distribution does not describe the overall velocity distribution of dark matter in Aq-A-2 very well (Vogelsberger et al. 2009), it is a fairly good fit to the relative speed distributions. The fits to different mass ranges result in velocity dispersions that systematically differ by about 10-15%, with the lowest values (220–235 km ) coming from the lowest mass range and the highest values (235–255 km ) obtained for the highest mass range.
The broad speed distributions we find for the interacting subhalos are roughly in agreement with the reasoning outlined in Yoon et al. (2011) that the interaction speed distribution should be Maxwellian with characteristic width , where is the velocity dispersion of the subhalos. Fitting a M-B distribution to the speed distribution of Aq-A-2 subhalos within 200 kpc (where all the stream particles examined are located) gives km , predicting a width of 170 km for the interaction-speed distribution. We obtain slightly higher velocity dispersions than this for the interacting subhalos in our samples, but it is worth noting that the best-fit overall speed distribution is skewed substantially toward low velocities; if one instead matches the peak of the M-B distribution to that of the Aq-A-2 subhalos one obtains km for the subhalo velocity dispersion and hence a predicted width of about 230 km for the interaction speed distribution, which is more in line with what we find. It is also worth noting that the recorded distributions of encounter speeds are biased towards low-speed encounters since these remain in the encounter volume longer, and thus are more likely to be recorded in a snapshot. For a fixed threshold distance this bias is roughly proportional to , and is also direction-dependent—subhalos moving parallel to the stream are more likely to be detected than those moving perpendicularly. We will discuss this bias, related to the time-resolution of the simulation, in more depth in Section 4.4. On the other hand, stream stars can reach speeds of up to km near pericenter (as seen in the right-hand panel of Figure 5), and the subhalo number density increases toward the center of the host halo, which may offset the time-resolution bias somewhat. Most importantly, the broad width and high mean speed of the subhalo distribution results in tails at both very high and very low encounter speeds. In general the lower the relative speed, the more disruptive the interaction will be; Figure 14 confirms that the low-speed tail extends down to very low relative speeds (under 100 km ) for even the lowest-mass subhalos considered.
4.3 Frequency and mass spectrum of interactions
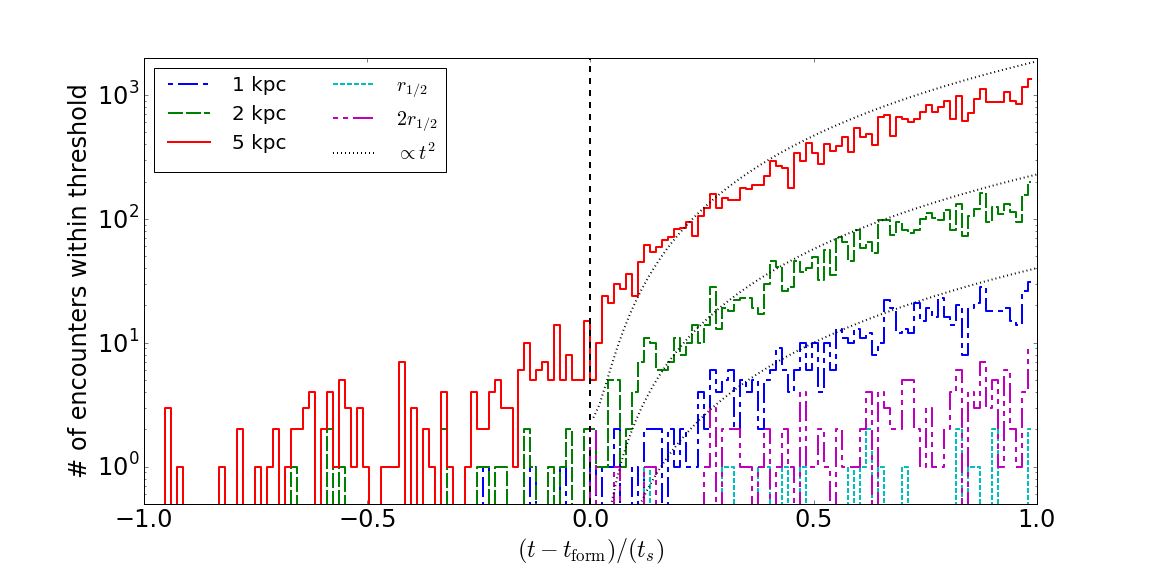
Figure 15 shows the aggregate time-evolution of the encounter rate for all the streams in the sample. In order to stack the stream encounter histories, we time-shift each individual stream’s encounters relative to its formation time, and then divide by its age, before adding all the encounters together and rebinning. We can then compare the aggregate encounter rate to the predicted behavior (dotted gray lines). In the case of the 5 kpc threshold, there appears to be some base rate of random encounters (roughly one per time-bin on average) before so we start the power-law from a constant instead of zero at . As observed for stream O in Figure 8, at late times the interaction rate appears to fall below this power-law behavior for the fixed-distance thresholds, which we attribute to a drop in particle resolution.
The mass-dependent thresholds have a much noisier signal, with the encounter rate consistent with noise and the rate barely emerging from the noise level. Again, we attribute this to the low particle resolution of the tagged streams; the mass-dependent thresholds are generally well below 1 kpc so they are the most susceptible. For this reason, we decided to only consider aggregate results from the threshold and not quote any results from the threshold since it is so undersampled.
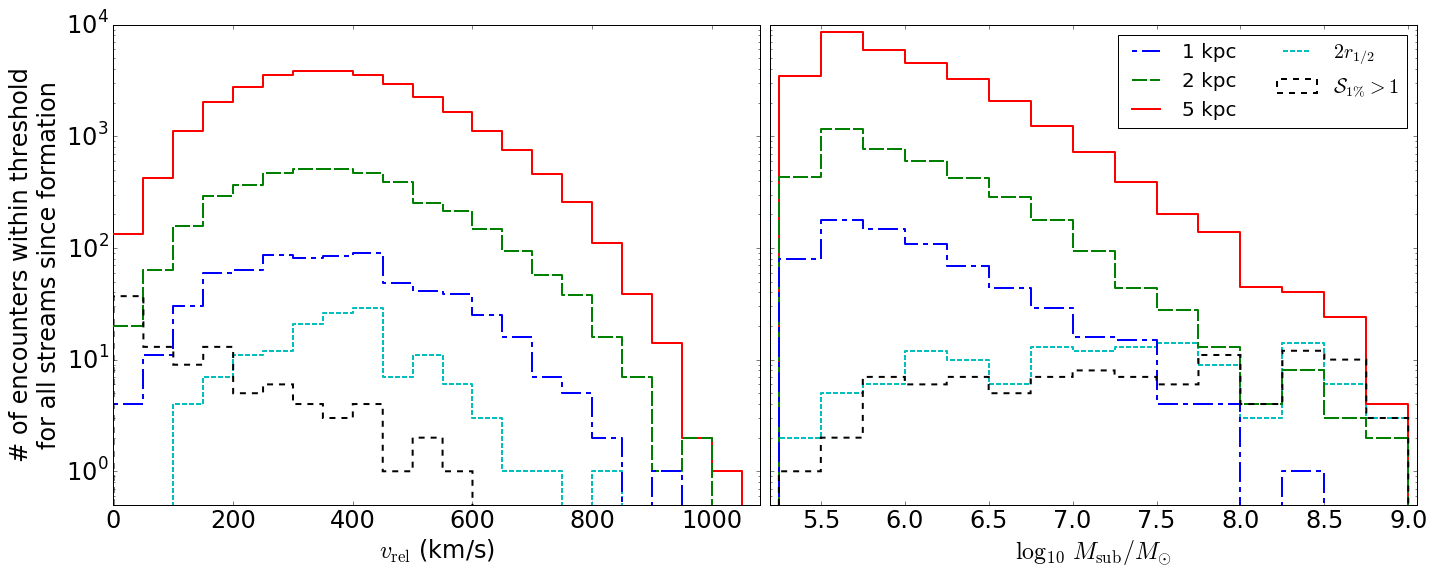

Figure 16 shows the distributions of total mass and relative speed for all the encounters as a function of threshold. We also include the distributions of all encounters with for comparison. The relative velocity distribution is similar for the fixed-distance and mass-dependent thresholds, while the strong velocity-dependence in the definition of is apparent here. As expected, the three fixed-distance thresholds sample the overall mass distribution while the mass-dependent threshold shows the competition between the subhalo mass function and the scaling of subhalo size with mass. The distribution of encounters with is similar to the mass-dependent threshold, which justifies our use of the half-mass radius to represent the “sphere of influence” of a subhalo. We can conclude from these results that while the typical halo interacting with a stream will have a low mass, the masses of subhalos that come close enough to significantly affect the stream are fairly uniformly distributed over several decades in mass: a subhalo is roughly as likely to have a strong interaction with a stream as a subhalo.
Finally, using the measured lengths and ages of the streams, determined as described in Section 4.1, we computed the length-normalized interaction rate,
| (11) |
for each stream in the sample and for each of the constant distance thresholds. As discussed in Section 4.3, we do not computer individual rates for the mass-dependent thresholds since the frequency of interactions is consistent with noise. Figure 17 shows the results. Although the streams vary widely in length, rates for the large group of streams with lengths of a few hundred kpc do not show length- or age-dependence in their encounter rate (though there is a large scatter). The large range of stream lengths (nearly a factor of 100) can apparently account for much of the equally wide range in the number of encounters shown in Figure 17. Even after normalization, the highest encounter rates tend to be for the shortest streams and the lowest encounter rates for the longest streams. This effect is most likely an indication of our limited numerical resolution and our approximate method for measuring stream lengths, which can be greatly affected by the inclusion/exclusion of single particles in the limit of low resolution. As an example of how these effects can combine, the streams with the two highest rates in the 5 and 2 kpc panels are the two shortest streams in the sample: both are near apocenter at present day (i.e. at the shortest length of any orbital phase). However, both streams also have a fairly large number of particles in a diffuse region, surrounding a more concentrated nucleus, that were excluded as outliers during the length determination. The phase-dependence of the length and the uncertainty in the length measurement itself, which in this case is probably skewed to the short side, combine to produce very high rates for these two streams.
Taking the median of our sample of 18 streams, we find that a stream that is 10 Gyr old and 10 kpc long at present day should have experienced subhalo encounters within 5 kpc, encounters within 2 kpc, and encounters within 1 kpc. The error bounds given here are the extrema of the range of encounter rates over the streams we tracked.
4.4 Resolution effects
Encounters with the stream are undersampled because of the low time-resolution of the snapshots: for Gyr, the time between snapshots is 0.1546 Gyr, so a subhalo with a typical velocity of 130 km/s moves about 20 kpc between snapshots. The undersampling is less severe for larger threshold distances, and is not strictly proportional to the single-particle threshold distance since we look for subhalos within that distance of any particle in the stream. As the stream gets longer, this effect is mitigated somewhat as the stream length approaches the average distance traveled by a subhalo between two snapshots. Thus the slope at which the interaction rate increases at middle times in Figure 8 may be slightly steeper than if we had infinitely good time-resolution.
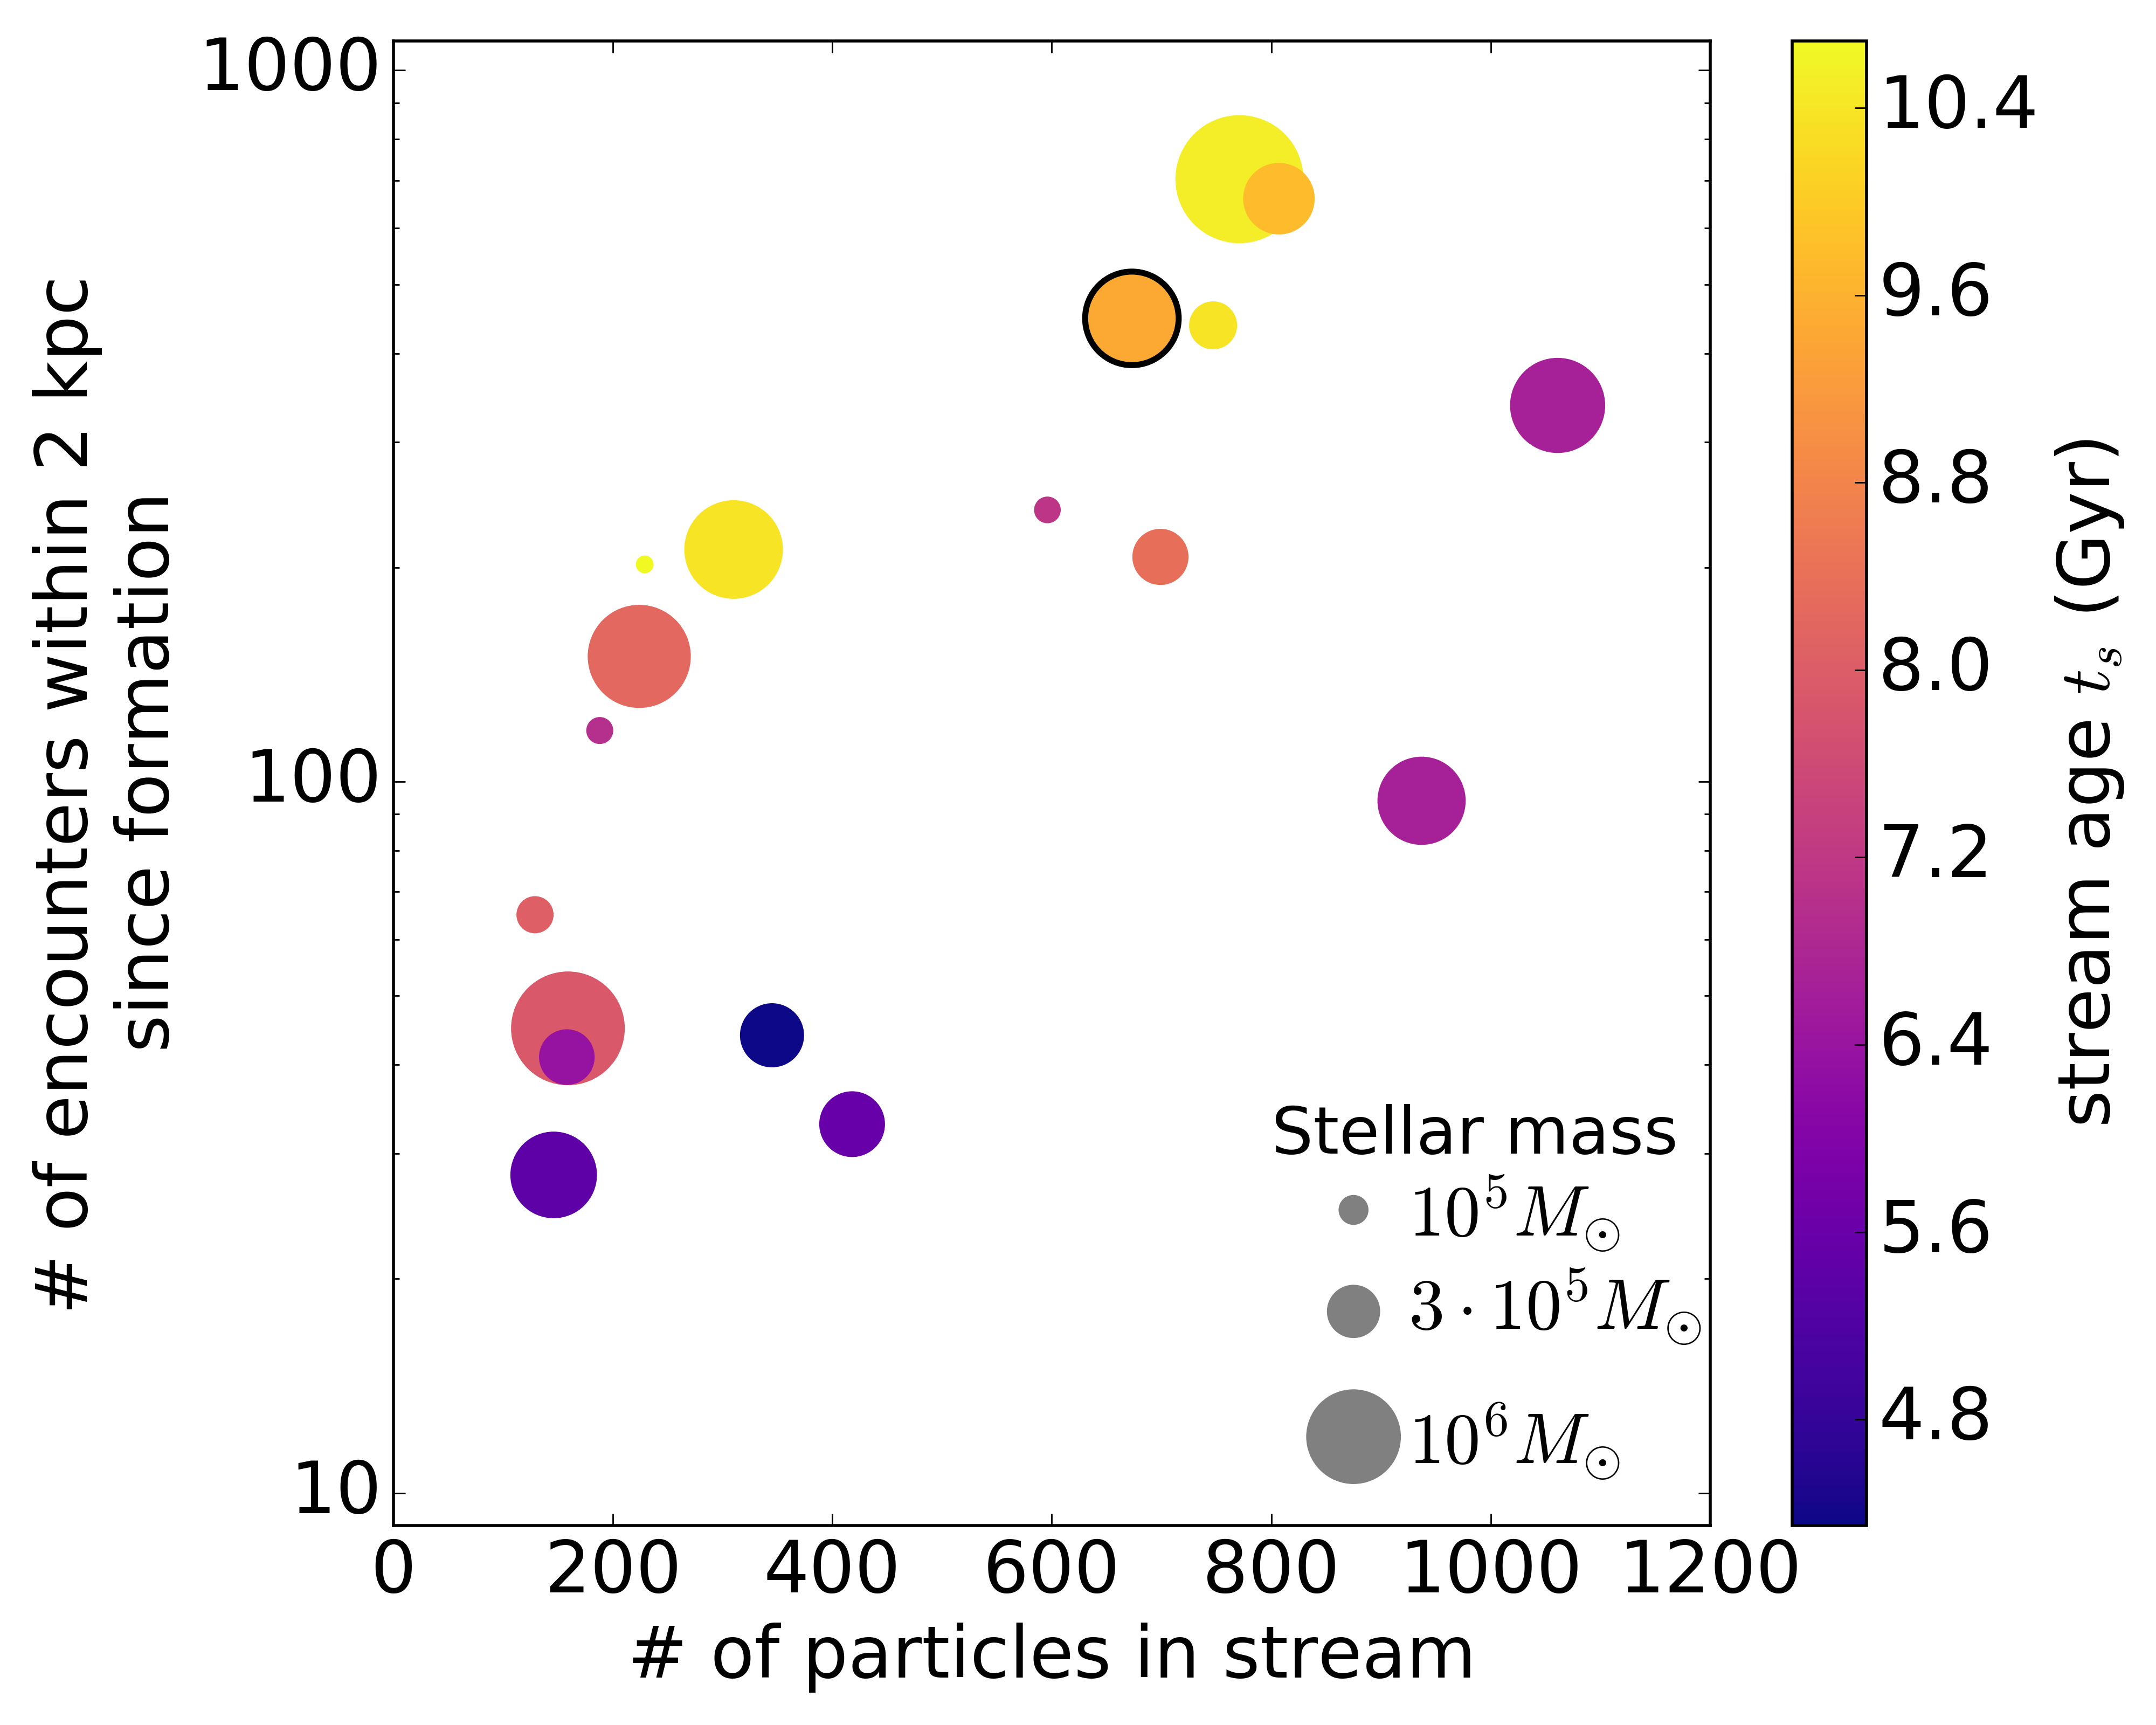
The decrease in the slope of the interaction rate toward the end of the simulation (evident for Stream O in Figure 8 and still marginally present in the aggregated history of Figure 15) is probably an effect of particle resolution. Toward the end of the simulation when the tagged stream particles are very spread out, a lack of resolution can cause us to miss subhalos that would have interacted with the stream. Figure 18 illustrates this point for our entire sample: the number of encounters is primarily correlated with the number of particles in the stream, whether one considers a fixed threshold (left) or a mass-dependent one (right).
Time- and particle resolution both affect our results in the same way, so the results we present in this work should therefore underestimate the number of interactions between a stream and dark substructures. We think that particle resolution is probably the more seriously limiting of the two issues based on the scaling of the median interaction rates for the 18 streams. If we had perfect time-resolution, the median rates for the fixed-distance threshold should scale as the cube of the threshold length: for the 1:2:5 kpc thresholds. Our measured rates scale as , so the medians are a bit on the low side but the proper scaling is within the range we obtain for different streams.
The mass resolution of the simulation mainly affects our ability to detect repeat encounters, which would likely be interactions with subhalos that accompanied the progenitor of the stream during infall. The dark-matter halos of the stream progenitors are not very massive, however, and if a stream progenitor is the largest halo in an infall group, then its most massive companion is likely to be only about 1/100th as massive, and hence will be resolved with about as many particles as are tagged for the stellar stream. For a progenitor like that of our example O stream, the most massive companion will only be resolved with about 700 particles. It takes about 100 particles to satisfactorily resolve a subhalo, so only the few most massive companion subhalos to a stream progenitor, that might give rise to multiple encounters, will be resolved in the simulation. Thus the frequency of repeat encounters is likely also underestimated by this work.
5 Discussion
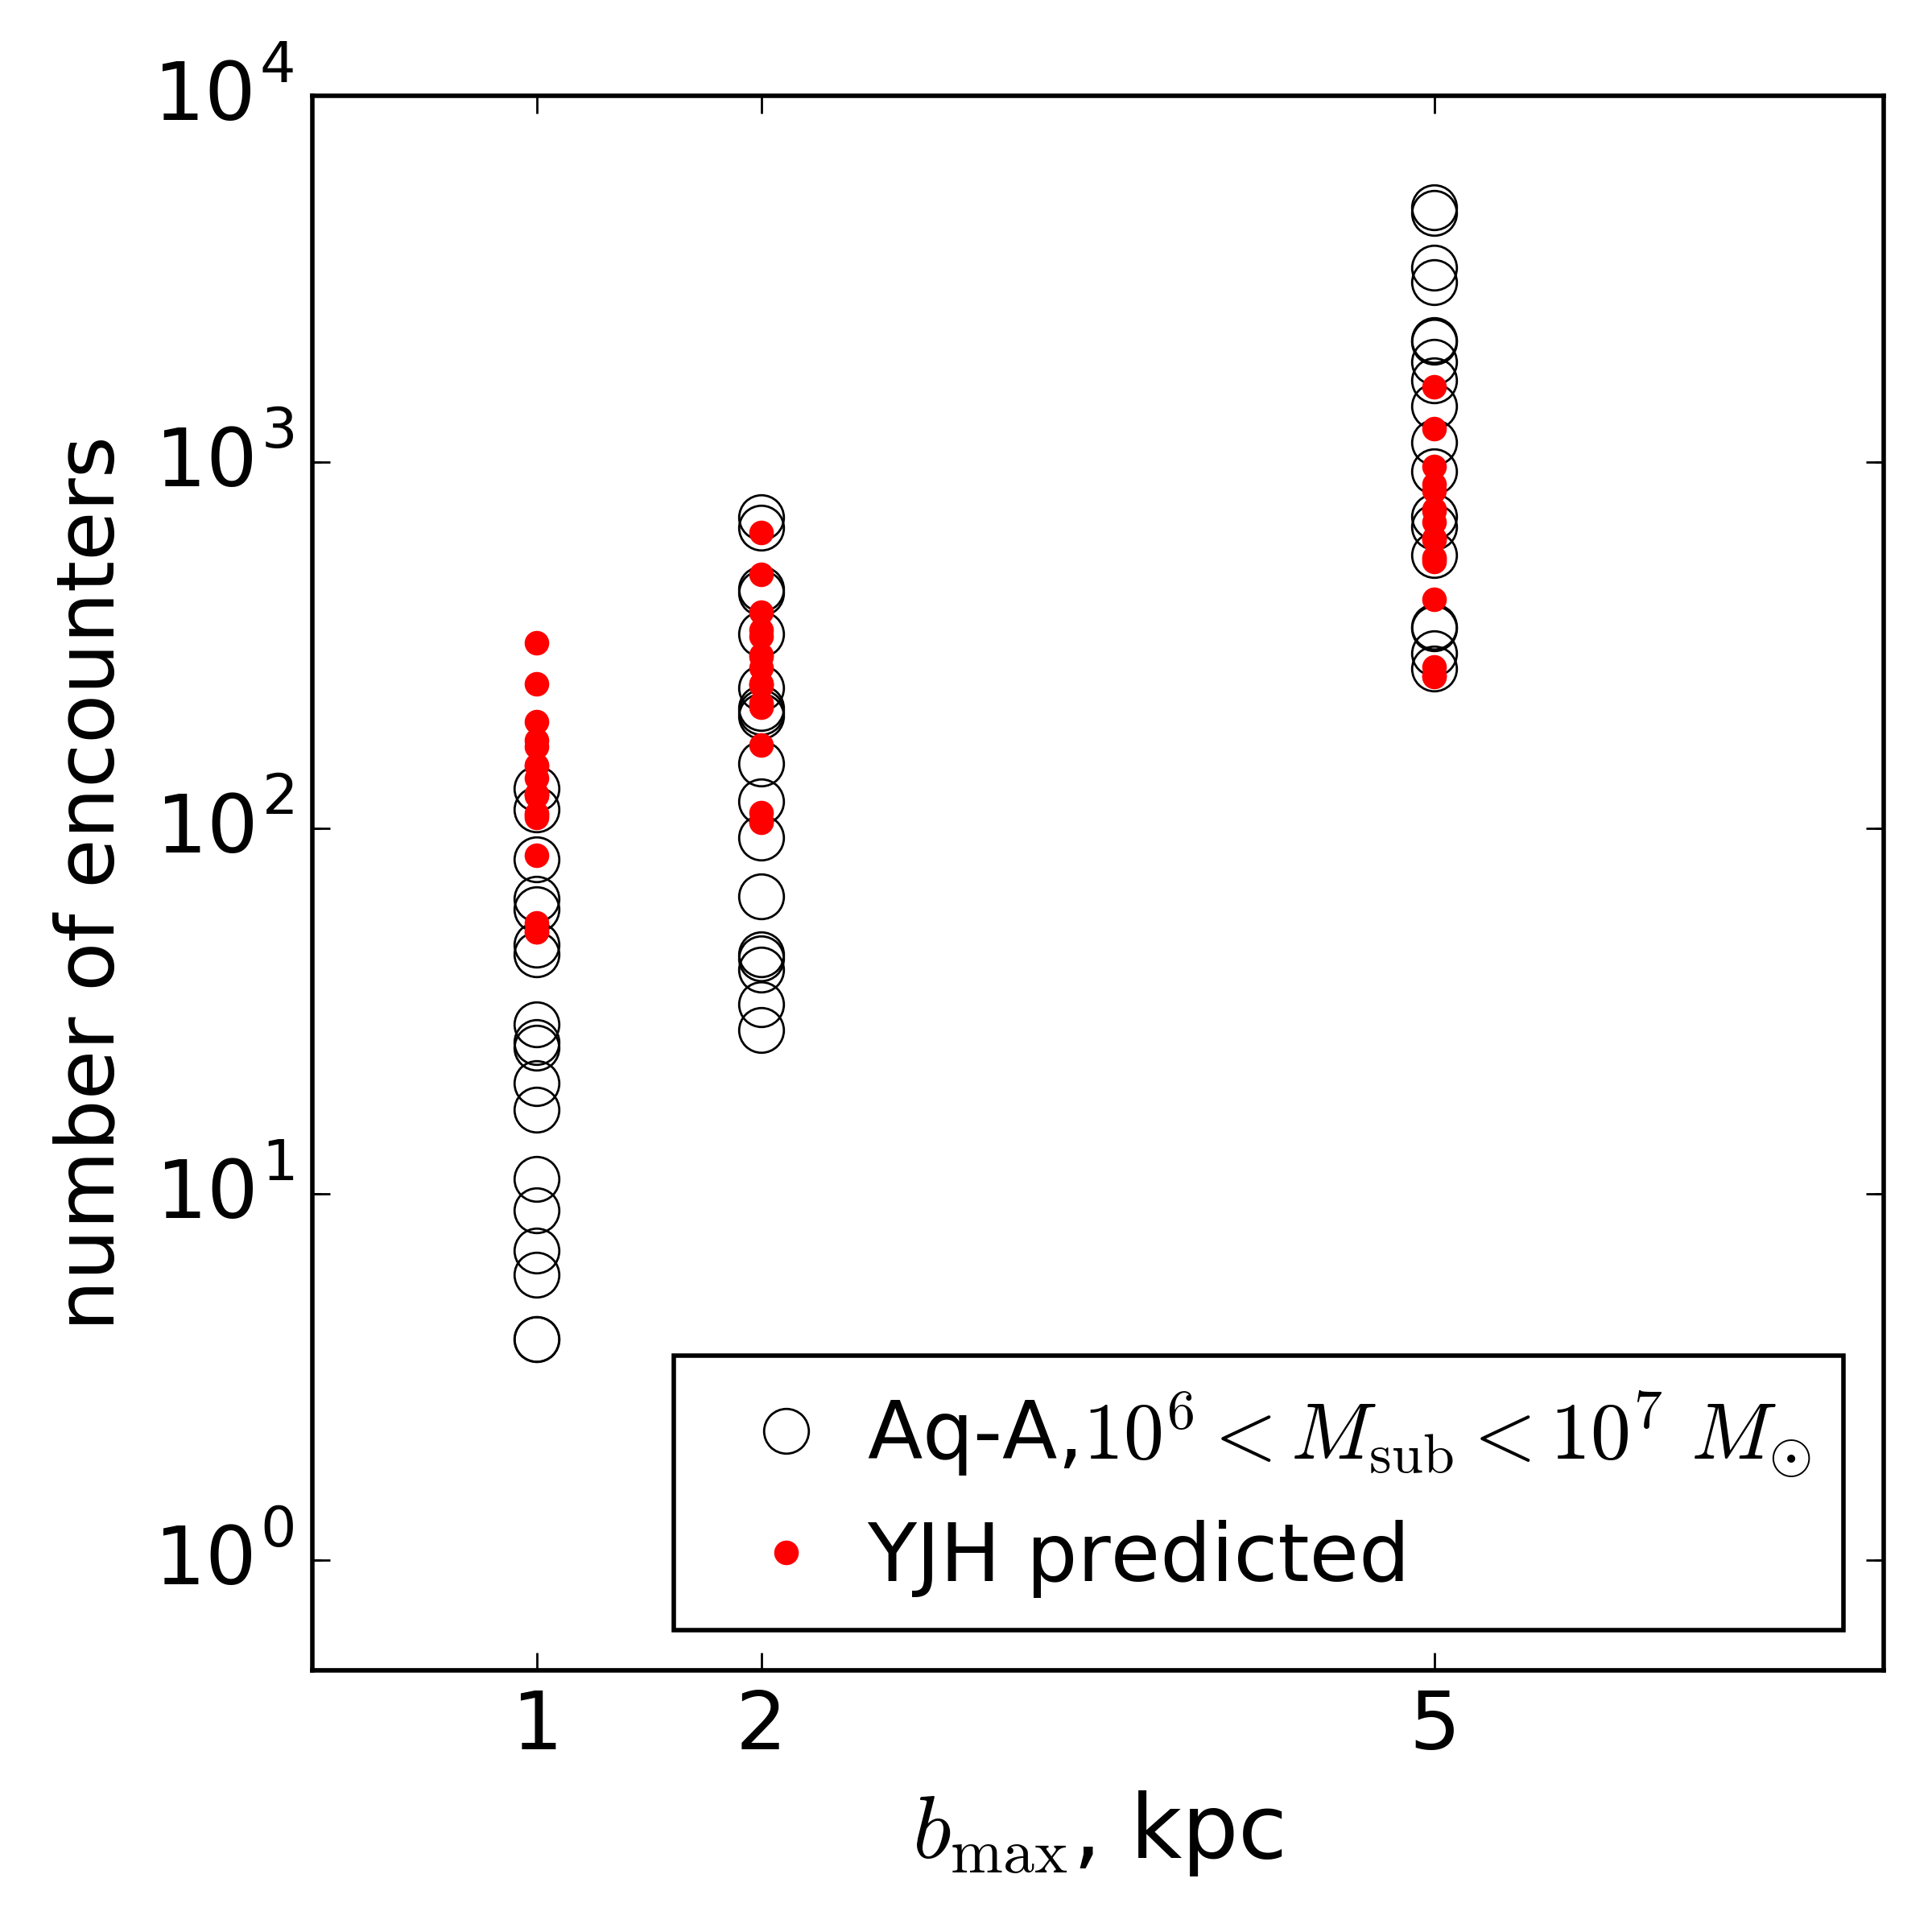
The encounter rate that we measure can be compared to analytic expressions in the literature. Figure 19 compares our results to the estimate derived by Yoon et al. (2011) for the total number of encounters in the mass range within a constant impact parameter , based on the subhalo density in the Via Lactea II simulation (their Equation 16):
| (12) |
Given that the VLII halo is quite similar to Aq-A-2 in mass, we use the fiducial values for the stream lengthening rate per orbit , and the orbital period . We also take the fiducial value of the subhalo density ; although this value is calculated at the low end of our streams’ distance range (13.7 kpc), the Aq-A-2 halo has slightly more substructure than VLII so the subhalo density at 10-60 kpc is actually about the same as VLII at 13.7 kpc (Springel et al. 2008). We use a subhalo velocity dispersion km , which is the best-fit value from a fit to a Maxwell distribution: as we discuss in Section 4.2, this functional form is not a very good fit to the real subhalo velocity distribution, but the model of YJH presumes this form so we use it for consistency. The predictions depend only linearly on the velocity dispersion, and more strongly on other things like the age of each stream, which varies among the different streams, whereas is the same for all of them and so will only shift the predictions up or down by some constant. Additionally the best-fit value does approximate the width of the distribution (perhaps slightly over-estimated thanks to skewness that cannot be accommodated by the model). For these reasons we do not expect the poor fit to have a strong effect on the result. Plugging in each stream’s median radius for , each stream’s age as , and using the different constant distance thresholds as produces the predictions shown as red points, which we compare to the measured number of encounters within the same thresholds (black circles). At small our rates are lower by a factor of about 10, while at large the predictions agree; this is partially expected behavior given the resolution limits since wider thresholds are less sensitive both to the time between snapshots and increasing distance between particles. On the other hand, the orbital period and lengthening rate for our streams is likely longer than the fiducial value since many are on orbits at larger distances in the halo (VLII is also a bit more massive than Aq-A-2), which may also contribute to the larger rates calculated by Yoon et al..
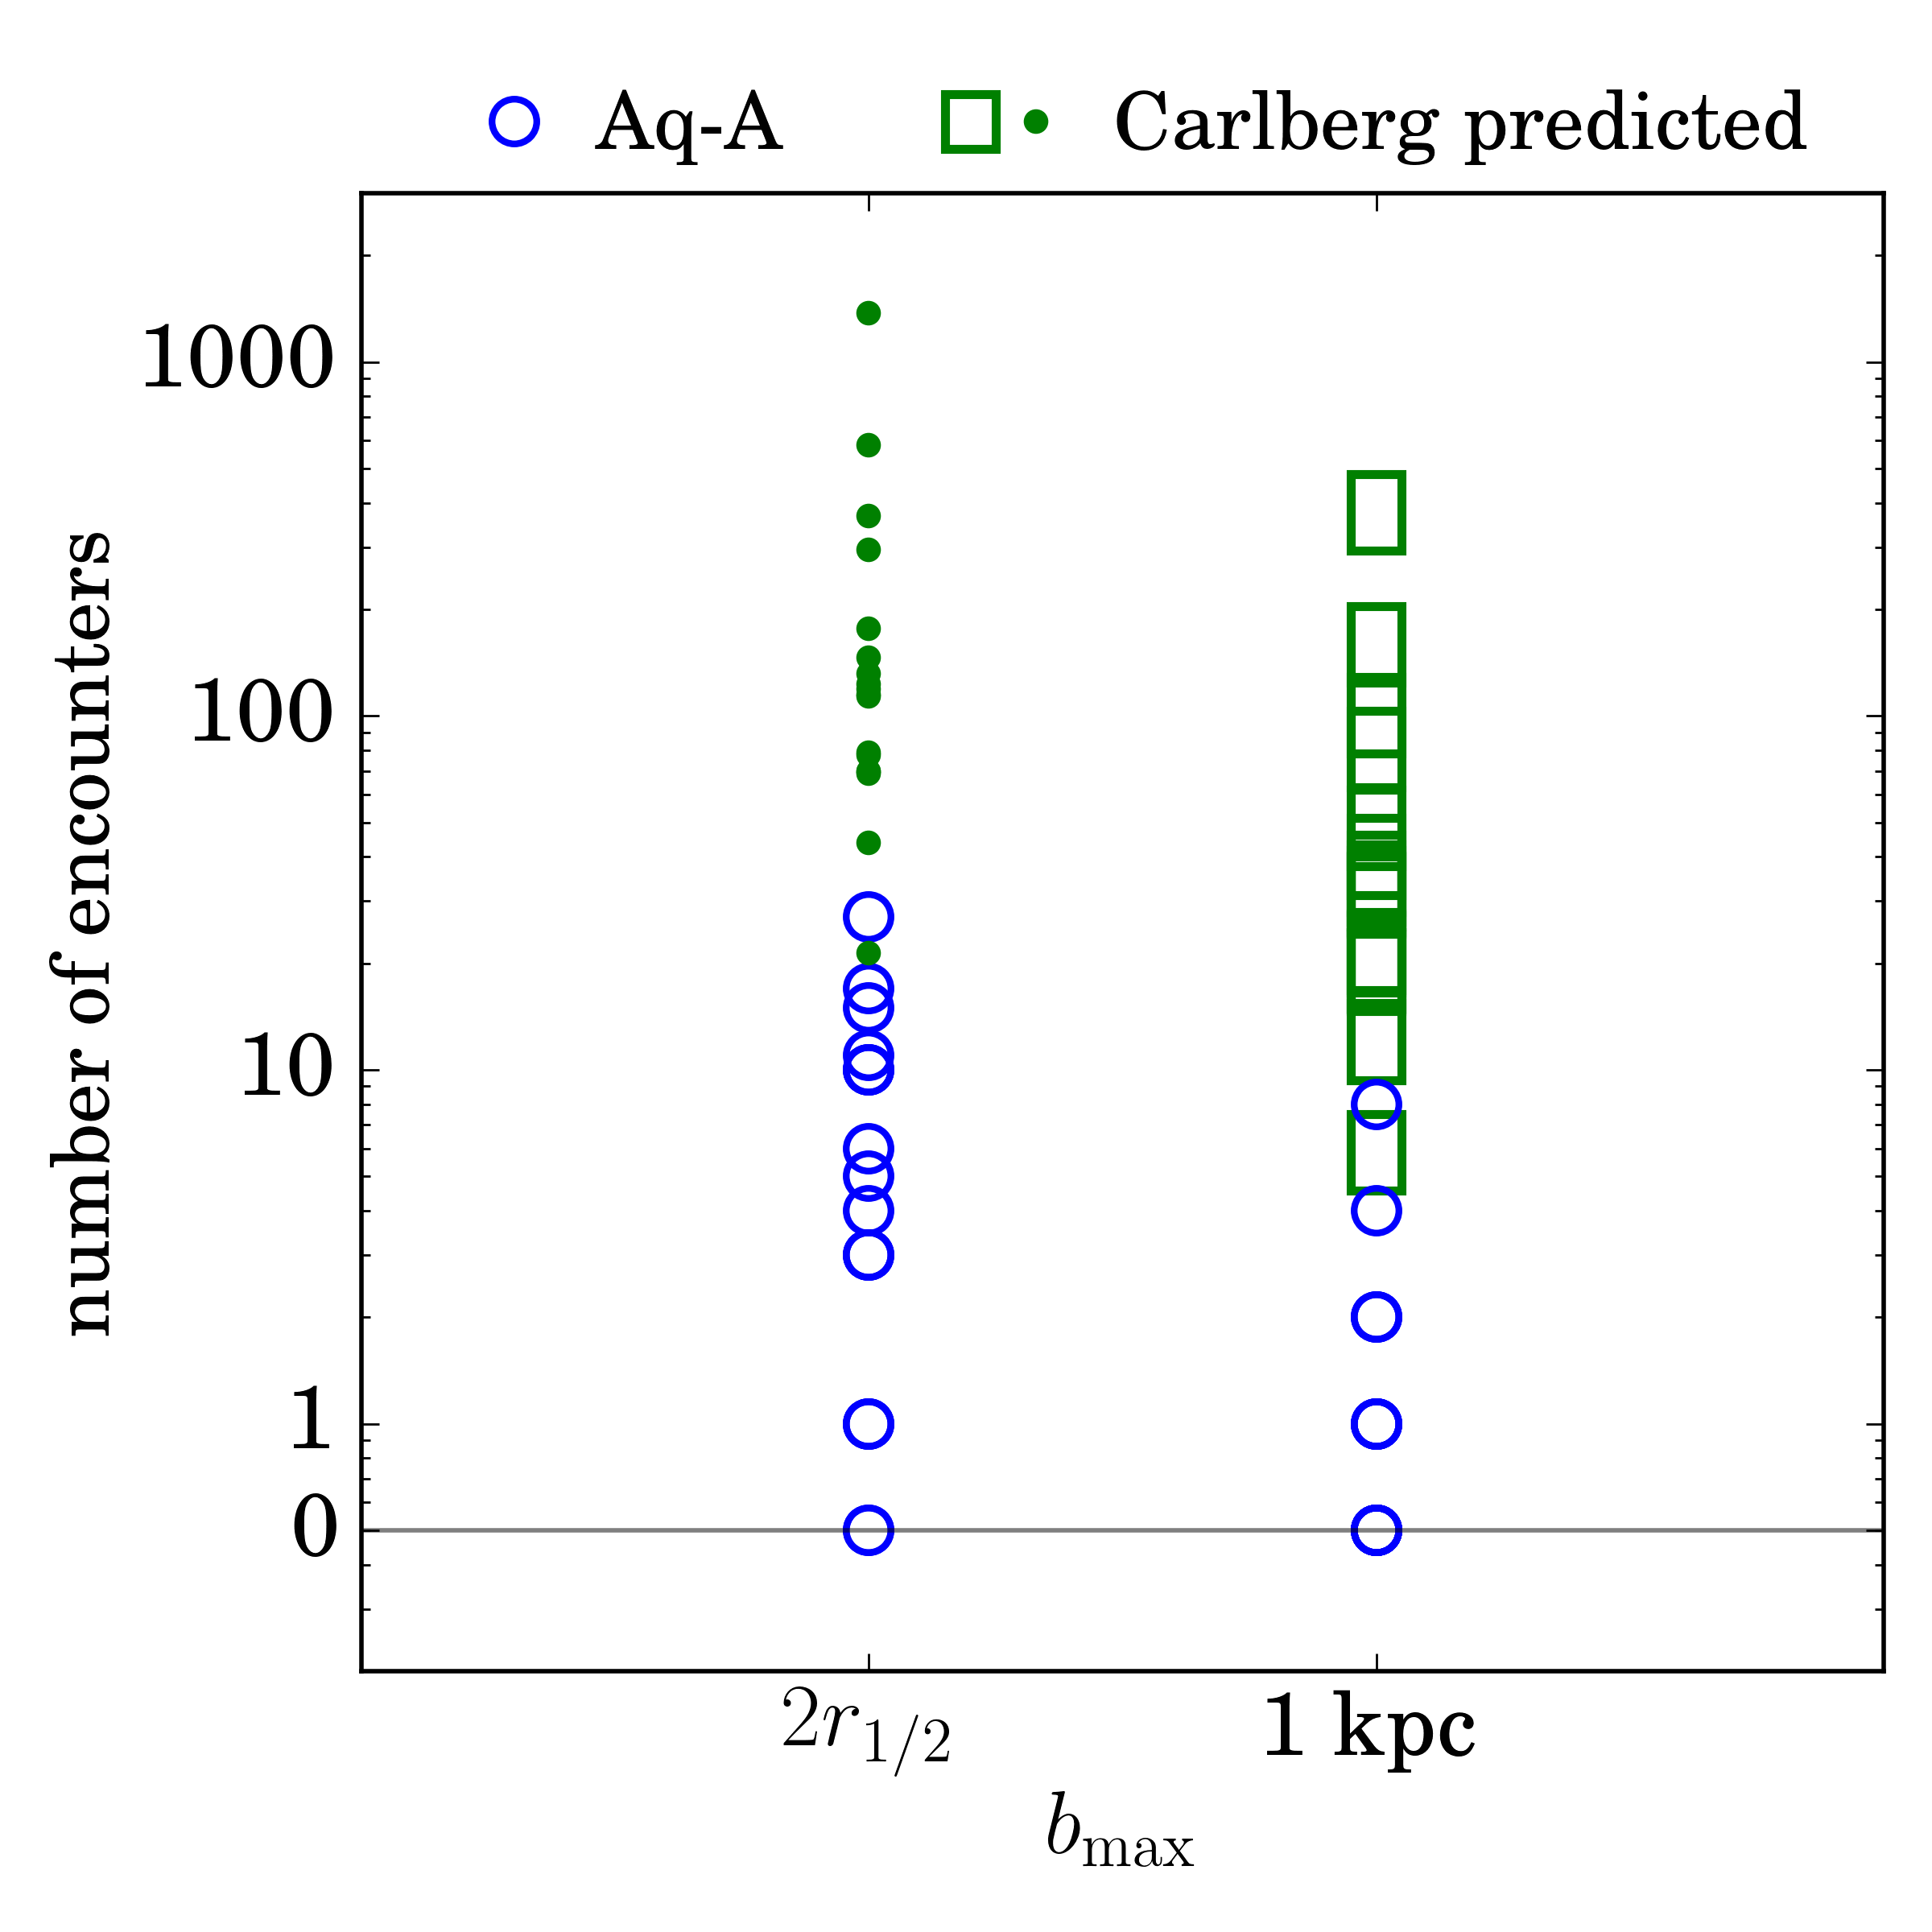
Carlberg (2012b) also derives an expression for the rate of subhalo interactions with a slightly different approach. Using constrained simulations they determine the maximum impact parameter required to open a gap in a stream of a fixed density contrast relative to the unperturbed stream, as a function of the time since the interaction, the mass of the perturbing subhalo, and the orbital radius . Because our mass-dependent thresholds are heavily subject to undercounting, we sought instead to try to identify the set of subhalos within a fixed encounter threshold that satisfy this criterion, which we computed for each stream in our sample using its mean orbital distance for and its age for the time since interaction. This is an upper limit on the required encounter distance, since interactions that happened later on would need to come closer to produce a gap of the same depth in a shorter time. We find that based on this reasoning, our 1 kpc fixed threshold corresponds to the required encounter distance for subhalos in the mass range . There are 22 encounters within 1 kpc within this mass range, over a total of 18 streams; the number of qualifying encounters per stream ranges from zero to 8.
To compare with Carlberg’s prediction we first tried simply applying Equation 5 of Carlberg (2012b),
| (13) |
which uses fiducial values taken from the subhalo distribution in the Aquarius halos. We used the median distance of star particles in each stream as the galactocentric distance and set the subhalo velocity dispersion to 139.3 km as with the YJH estimate. The scaled subhalo number density is obtained for Aq-A-2 from Figure 11 of Springel et al. (2008), and is about 15 for the range explored by our sample streams (10-60 kpc). Based on our application of the gap-opening criterion, we calculated upper and lower limits on for each stream by taking and as the range of possible minimum masses to open a gap given 1 kpc maximum impact parameter. We then multipiled Equation (13) by each stream’s measured length and age to get an estimate of the expected number of encounters in each stream, to compare with the 22 encounters in this same mass range over the 18 streams. This comparison is shown in the right-hand column of Figure 20, with the range of the predicted number of encounters denoted by the green boxes. This approach presumes that each stream stays at its present-day length over its entire formation time, whereas in reality they grow roughly linearly with time. Furthermore it presumes a circular orbit whereas the actual stream orbits are fairly eccentric and spend most of their time at larger distances where the subhalo density is lower. Added to the fact that for this distance threshold we are likely missing some events due to particle and time resolution, Equation (13) should produce an over-estimate relative to what we observe and we find that this is so; in fact the over-estimate is something like a factor of 10 to 50. However, the number of scattering events we detect in this mass range is very small, so it is difficult to quantify by how much this approach over-estimates the number of encounters.
One could also construe Equation (13) in terms of the mass-dependent criteria we use to count events within or , since this criterion is another way to select interactions that approach close enough to open a gap. Carlberg finds from his simulations that for a discernible gap to open from an interaction 7 Gyr in the past (the fiducial age assumed for all his predictions) the perturbing subhalo must approach within 1-3 scale radii presuming an NFW profile. Satellite galaxies (and simulated subhalos) are tidally truncated beyond a few scale radii; for subhalos orbiting at a few times the scale radius of the parent halo (where our streams are located) this truncation radius is also about 1-3 times the scale radius (Hayashi et al. 2003) so it is roughly consistent to use as the gap opening criterion for the approach distance. We compare all encounters within to the prediction of Equation (13) for a minimum mass of : in this case all the events we record are gap-opening, so the minimum mass to open a gap is equal to the lowest mass in our sample, which we cut off at . This comparison is shown in the left-hand column of Figure 20. This set of interactions, although still undersampled for the reasons described above, has slightly more events in it than the mass-limited, 1 kpc version in the right-hand column, but the rates we measure are still much lower than predicted by Carlberg’s formula.
The typical stream in our sample has had only a handful of close interactions with subhalos in its lifetime (less than 10 within 2 kpc, and a 20% chance of one within ). Given this fairly low rate of encounters, it is at first glance surprising how disturbed the morphology of a stream can be: our example stream starts out as a completely smooth distribution but has some significant lumps and holes in it (both in position and energy) by the end of the simulation, yet we count only one interaction with a subhalo within over its entire lifetime. Ngan et al. (2015) found similarly disorganized-looking streams in their simulations when starting from a smooth globular-cluster-like phase space distribution and using the Via Lactea simulation. In our case, the interaction rate is undercounted for a number of reasons, most notably the fairly large time between snapshots and the low resolution of the streams themselves, but also because we did select streams that still appear fairly coherent at present day, which automatically picks out ones that have had fewer disruptive encounters. The stream lengths on the other hand are probably over-estimated compared to what one would be able to identify as part of the stream observationally, since the ends of our simulated streams are often very diffuse. Additionally, gaps in streams will grow faster in a gravitational potential like Aq-A-2’s, which is triaxial, than in a spherically-symmetric potential (Helmi & White 1999), especially for streams on more eccentric orbits (Carlberg 2015b). Streams in less symmetric potentials are also intrinsically more complex-looking, even without the addition of substructure (e.g. Pearson et al. 2015), since these admit a wider range of orbit families than streams in spherical potentials. Gap size also varies significantly with orbital phase (Helmi & Koppelman 2016), leading to a wider variety of effects. Given the range of possible gap growth rates, the variety of orbits and phases our streams explore, and the fact that we are missing some encounters due to time-resolution, it is perhaps not as surprising that the streams look more “messed-up,” and the gaps in them harder to identify and disentangle, than one might expect from our measured encounter rate.
6 Summary and conclusions
In this work we used a new, simplified tagging scheme to produce an accreted stellar halo from the Aquarius A-2 dark-matter-only simulation, and studied interactions between dark subhalos and thin stellar streams orbiting the main halo. We recorded encounters where a subhalo (identified by its most-bound particle) came within several threshold distances of any tagged star particle in a stream. We used three constant distance thresholds (1, 2, and 5 kpc) and two mass-dependent thresholds based on the half-mass radius of each subhalo ( and ).
First we tracked a single stellar stream, observing the rate at which interactions occurred at different thresholds, the evolution of the physical and phase-space shape of the stream over time, and the mass and velocity spectra of the encounters. The initial phase-space distribution of the tagged particles in the stream’s progenitor is smooth at the time of infall, yet we see significant structure, including discontinuities in position and energy, arise as the stream evolves. As the stream gets longer the number of encounters increases and by late times, multiple subhalos are passing close to the stream in every snapshot, and up to 26 within 2 kpc at a given point in time. Only some of these passes bring the subhalo closer than its own half-mass radius: in the case of our example stream, only 12 subhalos pass within and 2 within over its lifetime. Additionally, we find only one case out of many where a subhalo experienced multiple encounters with the stream, and the velocities of the interacting subhalos are not significantly correlated with that of the stream.
Then we identified a sample of 18 stellar streams that still appeared streamlike at the present day and repeated the tracking of encounters for all streams in the sample. The growth of the number of encounters with time over the entire sample confirms what we observed for the single stream, although at late times low resolution likely causes us to under-count interactions. The relative speeds of the interacting subhalos are representative of the general subhalo population, as are their masses when a fixed threshold distance is used. For the mass-dependent threshold distances, subhalos in the range to (and perhaps up to ) are equally likely to have an interaction with a stream within .
Comparing the rate of interactions we measure to analytic predictions, we find that our measured rate is lower (as one would expect given the resolution limitations) and closer to these predictions for larger maximum impact parameter (as one would also expect for a resolution-limited rate). Our median measured rates for encounters, per 10 Gyr per 10 kpc, are: 62 within 5 kpc, 9 within 2 kpc, 1.5 within 1 kpc, and 0.2 within .
Acknowledgements.
RES is supported by an NSF Astronomy and Astrophysics Postdoctoral Fellowship under award AST-1400989. RES and AH gratefully acknowledge support from the European Research Council under ERC-Starting Grant GALACTICA-240271. AH is also supported by a VICI grant from NWO.References
- Bailin et al. (2014) Bailin, J., Bell, E. F., Valluri, M., et al. 2014, ApJ, 783, 95
- Belokurov et al. (2007) Belokurov, V., Evans, N. W., Irwin, M. J., et al. 2007, ApJ, 658, 337
- Belokurov et al. (2006) Belokurov, V., Zucker, D. B., Evans, N. W., et al. 2006, ApJ, 642, L137
- Bertone et al. (2005) Bertone, G., Hooper, D., & Silk, J. 2005, Phys. Rep, 405, 279
- Bonaca et al. (2012) Bonaca, A., Geha, M., & Kallivayalil, N. 2012, ApJ, 760, L6
- Boylan-Kolchin et al. (2009) Boylan-Kolchin, M., Springel, V., White, S. D. M., Jenkins, A., & Lemson, G. 2009, MNRAS, 398, 1150
- Carlberg (2009) Carlberg, R. G. 2009, The Astrophysical Journal, 705, L223
- Carlberg (2012a) Carlberg, R. G. 2012a, eprint arXiv:1201.1347 [arXiv:1201.1347]
- Carlberg (2012b) Carlberg, R. G. 2012b, The Astrophysical Journal, 748, 20
- Carlberg (2013) Carlberg, R. G. 2013, ApJ, 775, 90
- Carlberg (2015a) Carlberg, R. G. 2015a, ApJ, 800, 133
- Carlberg (2015b) Carlberg, R. G. 2015b, ApJ, 808, 15
- Collins et al. (2015) Collins, M. L. M., Martin, N. F., Rich, R. M., et al. 2015, ApJ, 799, L13
- Cooper et al. (2010) Cooper, A. P., Cole, S., Frenk, C. S., et al. 2010, MNRAS, 406, 744
- De Lucia & Helmi (2008) De Lucia, G. & Helmi, A. 2008, MNRAS, 391, 14
- Duffau et al. (2006) Duffau, S., Zinn, R., Vivas, A. K., et al. 2006, ApJ, 636, L97
- Erkal & Belokurov (2015) Erkal, D. & Belokurov, V. 2015, ArXiv e-prints [arXiv:1507.05625]
- Gómez et al. (2013) Gómez, F. A., Helmi, A., Cooper, A. P., et al. 2013, MNRAS, 436, 3602
- Grillmair (2006) Grillmair, C. J. 2006, ApJ, 645, L37
- Grillmair (2009) Grillmair, C. J. 2009, ApJ, 693, 1118
- Grillmair & Dionatos (2006) Grillmair, C. J. & Dionatos, O. 2006, ApJ, 643, L17
- Grillmair & Johnson (2006) Grillmair, C. J. & Johnson, R. 2006, ApJ, 639, L17
- Hayashi et al. (2003) Hayashi, E., Navarro, J. F., Taylor, J. E., Stadel, J., & Quinn, T. 2003, The Astrophysical Journal, 584, 541
- Helmi et al. (2011) Helmi, A., Cooper, A. P., White, S. D. M., et al. 2011, The Astrophysical Journal, 733, L7
- Helmi & Koppelman (2016) Helmi, A. & Koppelman, H. H. 2016, ArXiv e-prints [arXiv:1606.08782]
- Helmi & White (1999) Helmi, A. & White, S. D. M. 1999, MNRAS, 307, 495
- Helmi et al. (1999) Helmi, A., White, S. D. M., de Zeeuw, P. T., & Zhao, H. 1999, Nature, 402, 53
- Ibata et al. (2001) Ibata, R., Irwin, M., Lewis, G. F., & Stolte, A. 2001, ApJ, 547, L133
- Ibata et al. (2002) Ibata, R. A., Lewis, G. F., Irwin, M. J., & Quinn, T. 2002, Monthly Notices of the Royal Astronomical Society, 332, 915
- Johnston et al. (2002) Johnston, K. V., Spergel, D. N., & Haydn, C. 2002, The Astrophysical Journal, 570, 656
- Klement et al. (2009) Klement, R., Rix, H.-W., Flynn, C., et al. 2009, ApJ, 698, 865
- Klypin et al. (1999) Klypin, A., Kravtsov, A. V., Valenzuela, O., & Prada, F. 1999, ApJ, 522, 82
- Koposov et al. (2008) Koposov, S., Belokurov, V., Evans, N. W., et al. 2008, ApJ, 686, 279
- Kullback (1959) Kullback, S. 1959, Information Theory and Statistics (Mineola, NY: Dover)
- Lauchner et al. (2006) Lauchner, A., Powell, Jr., W. L., & Wilhelm, R. 2006, ApJ, 651, L33
- Le Bret et al. (2015) Le Bret, T., Pontzen, A., Cooper, A. P., et al. 2015, ArXiv e-prints [arXiv:1502.06371]
- Libeskind et al. (2011) Libeskind, N. I., Knebe, A., Hoffman, Y., Gottlöber, S., & Yepes, G. 2011, MNRAS, 418, 336
- Lunnan et al. (2012) Lunnan, R., Vogelsberger, M., Frebel, A., et al. 2012, ApJ, 746, 109
- Martin et al. (2013) Martin, C., Carlin, J. L., Newberg, H. J., & Grillmair, C. 2013, ApJ, 765, L39
- Mayer et al. (2002) Mayer, L., Moore, B., Quinn, T., Governato, F., & Stadel, J. 2002, Monthly Notices of the Royal Astronomical Society, 336, 119
- Ngan et al. (2015) Ngan, W., Bozek, B., Carlberg, R. G., et al. 2015, ApJ, 803, 75
- Ngan & Carlberg (2014) Ngan, W. H. W. & Carlberg, R. G. 2014, ApJ, 788, 181
- Odenkirchen et al. (2003) Odenkirchen, M., Grebel, E. K., Dehnen, W., et al. 2003, AJ, 126, 2385
- Pearson et al. (2015) Pearson, S., Küpper, A. H. W., Johnston, K. V., & Price-Whelan, A. M. 2015, ApJ, 799, 28
- Penarrubia et al. (2006) Penarrubia, J., Benson, A. J., Martinez-Delgado, D., & Rix, H. W. 2006, The Astrophysical Journal, 645, 240
- Sharma & Steinmetz (2006) Sharma, S. & Steinmetz, M. 2006, MNRAS, 373, 1293
- Springel et al. (2008) Springel, V., Wang, J., Vogelsberger, M., et al. 2008, Monthly Notices of the Royal Astronomical Society, 391, 1685
- Springel et al. (2001) Springel, V., White, S. D. M., Tormen, G., & Kauffmann, G. 2001, MNRAS, 328, 726
- Starkenburg et al. (2013) Starkenburg, E., Helmi, A., De Lucia, G., et al. 2013, MNRAS, 429, 725
- Vivas et al. (2001) Vivas, A. K., Zinn, R., Andrews, P., et al. 2001, ApJ, 554, L33
- Vogelsberger et al. (2009) Vogelsberger, M., Helmi, A., Springel, V., et al. 2009, MNRAS, 395, 797
- Yanny et al. (2003) Yanny, B., Newberg, H. J., Grebel, E. K., et al. 2003, ApJ, 588, 824
- Yanny et al. (2004) Yanny, B., Newberg, H. J., Grebel, E. K., et al. 2004, ApJ, 605, 575
- Yoon et al. (2011) Yoon, J. H., Johnston, K. V., & Hogg, D. W. 2011, The Astrophysical Journal, 731, 58