Dewetting and Spreading Transitions for Active Matter on Random Pinning Substrates
Cs. Sándor,1,2, A. Libál,∗1,2, C. Reichhardt,2, and C. J. Olson Reichhardt2
Received Xth XXXXXXXXXX 20XX, Accepted Xth XXXXXXXXX 20XX
First published on the web Xth XXXXXXXXXX 20XX
DOI: 10.1039/b000000x
We show that sterically interacting self-propelled disks in the presence of random pinning substrates exhibit transitions among a variety of different states. In particular, from a phase separated cluster state, the disks can spread out and homogeneously cover the substrate in what can be viewed as an example of an active matter wetting transition. We map the location of this transition as a function of activity, disk density, and substrate strength, and we also identify other phases including a cluster state, coexistence between a cluster and a labyrinth wetted phase, and a pinned liquid. These phases can be identified using the cluster size, which dips at the wetting-dewetting transition, and the fraction of sixfold coordinated particles, which drops when dewetting occurs.
1 Introduction
††footnotetext: 1 Faculty of Mathematics and Computer Science, Babeş-Bolyai University, Cluj, Romania 400084 Fax: +40 264 591 906; Tel: + 40 264 405 300 /5240; E-mail: andras.libal@gmail.com††footnotetext: 2 Theoretical Division and Center for Nonlinear Studies, Los Alamos National Laboratory, Los Alamos, New Mexico 87545, USA.A wide class of systems exhibit pinning-induced order-disorder transitions in the presence of quenched disorder, including vortices in type-II superconductors 1, 2, two-dimensional (2D) electron crystals 3, 4, charged colloids 5, 6, 7, soft matter systems with core-softened potentials 8, and hard disks 9. When the ordered state is crystalline, a transition to the disordered state as a function of increasing substrate strength or decreasing particle density occurs through the proliferation of topological defects. In addition to such equilibrium phases, distinct phases can emerge under nonequilibrium conditions in active matter or self-driven particle systems 10, 11, including biological systems such as run-and-tumble bacteria 12 or artificial swimmers such as self-motile colloids 11, 13, 14. One of the simplest models of active matter is monodisperse sterically interacting disks undergoing active Brownian motion or run and tumble dynamics. These can transition from a uniform liquid state to a clump or phase separated state with increasing disk density, increasing persistence length 15, 16, 17, 18, 19, 20 or increasing run length 21, 22, 23. In the phase separated regime, which appears even in the absence of an attractive component in the particle-particle interactions, large clumps of densely packed disks are separated by a low density gas of active particles. Monodisperse disks exhibit crystalline or polycrystalline ordering within the high density regions inside the clumps 16. A natural question to ask is how robust these cluster phases are in the presence of quenched disorder and whether pinning-induced transitions can occur as a function of increasing substrate strength.
Obstacle arrays, which have been considered in several studies of swarming models 24, 25 and run and tumble disks 23, produce quite different effects from the collective behavior that can arise in pinning arrays. The distinction between a pin and an obstacle is that it is possible for particles to pass through a pinning site either individually or collectively, while obstacles present an impenetrable barrier. The dynamics of many physically relevant active matter systems, such as particles moving over rough substrates, are better described in terms of an effective pinning landscape instead of in terms of obstacle avoidance. Studies of modified Vicsek models in the presence of obstacles showed that swarming was optimized at a particular noise value 24, while in other studies, increasing the disorder strength caused a phase transition from a swarming to a non-swarming state 26. In studies of self-propelled disks interacting with obstacle arrays, the mobility of the disks was a non-monotonic function of the running length, since disks with long running times spend more time trapped behind obstacles 23.
Here we consider self-propelled disks interacting with a substrate composed of randomly placed pinning sites. A transition from a pin-free phase separated state to a homogeneous state can be induced by increasing the substrate strength. This transition can be viewed as an active matter version of a wetting-dewetting or spreading transition 27, where the active particles spread out to cover the surface when the pinning is strong. We also show that a variety of different states can occur as function of disk density, substrate strength, and activity, including cluster phases, coexisting clustered and wetted states, a wetted percolating state, and a pinned liquid state. These different states can be characterized by the size of the clusters and the amount of sixfold ordering of the disks.
2 Simulation
We numerically simulate a 2D system of to 20,000 self-propelled disks using GPU based computing. The disk radius is and the system size is with , giving a filling factor of to . The disks obey the following overdamped equation of motion:
| (1) |
where is the drag coefficient, is the repulsive disk-disk interaction force, , , is the harmonic spring contact force, and is the Heaviside function. The motor force with fixed acts on each disk in a direction that changes randomly via a run and tumble protocol every simulation time steps. The time step used in the simulations is . We characterize the activity of the disks by , which is the distance a disk would travel in a single running time in the absence of disk-disk interactions or pinning, and take to be uniformly distributed over the range []. , the pinning force exerted by the substrate, is modeled by an array of randomly placed circular parabolic traps with a finite radius of , where is the maximum pinning force exerted at the edge of the trap, is the distance from the center of disk to the center of pinning site , and . Since , a given pinning site can trap no more than one disk at a time.
3 Results
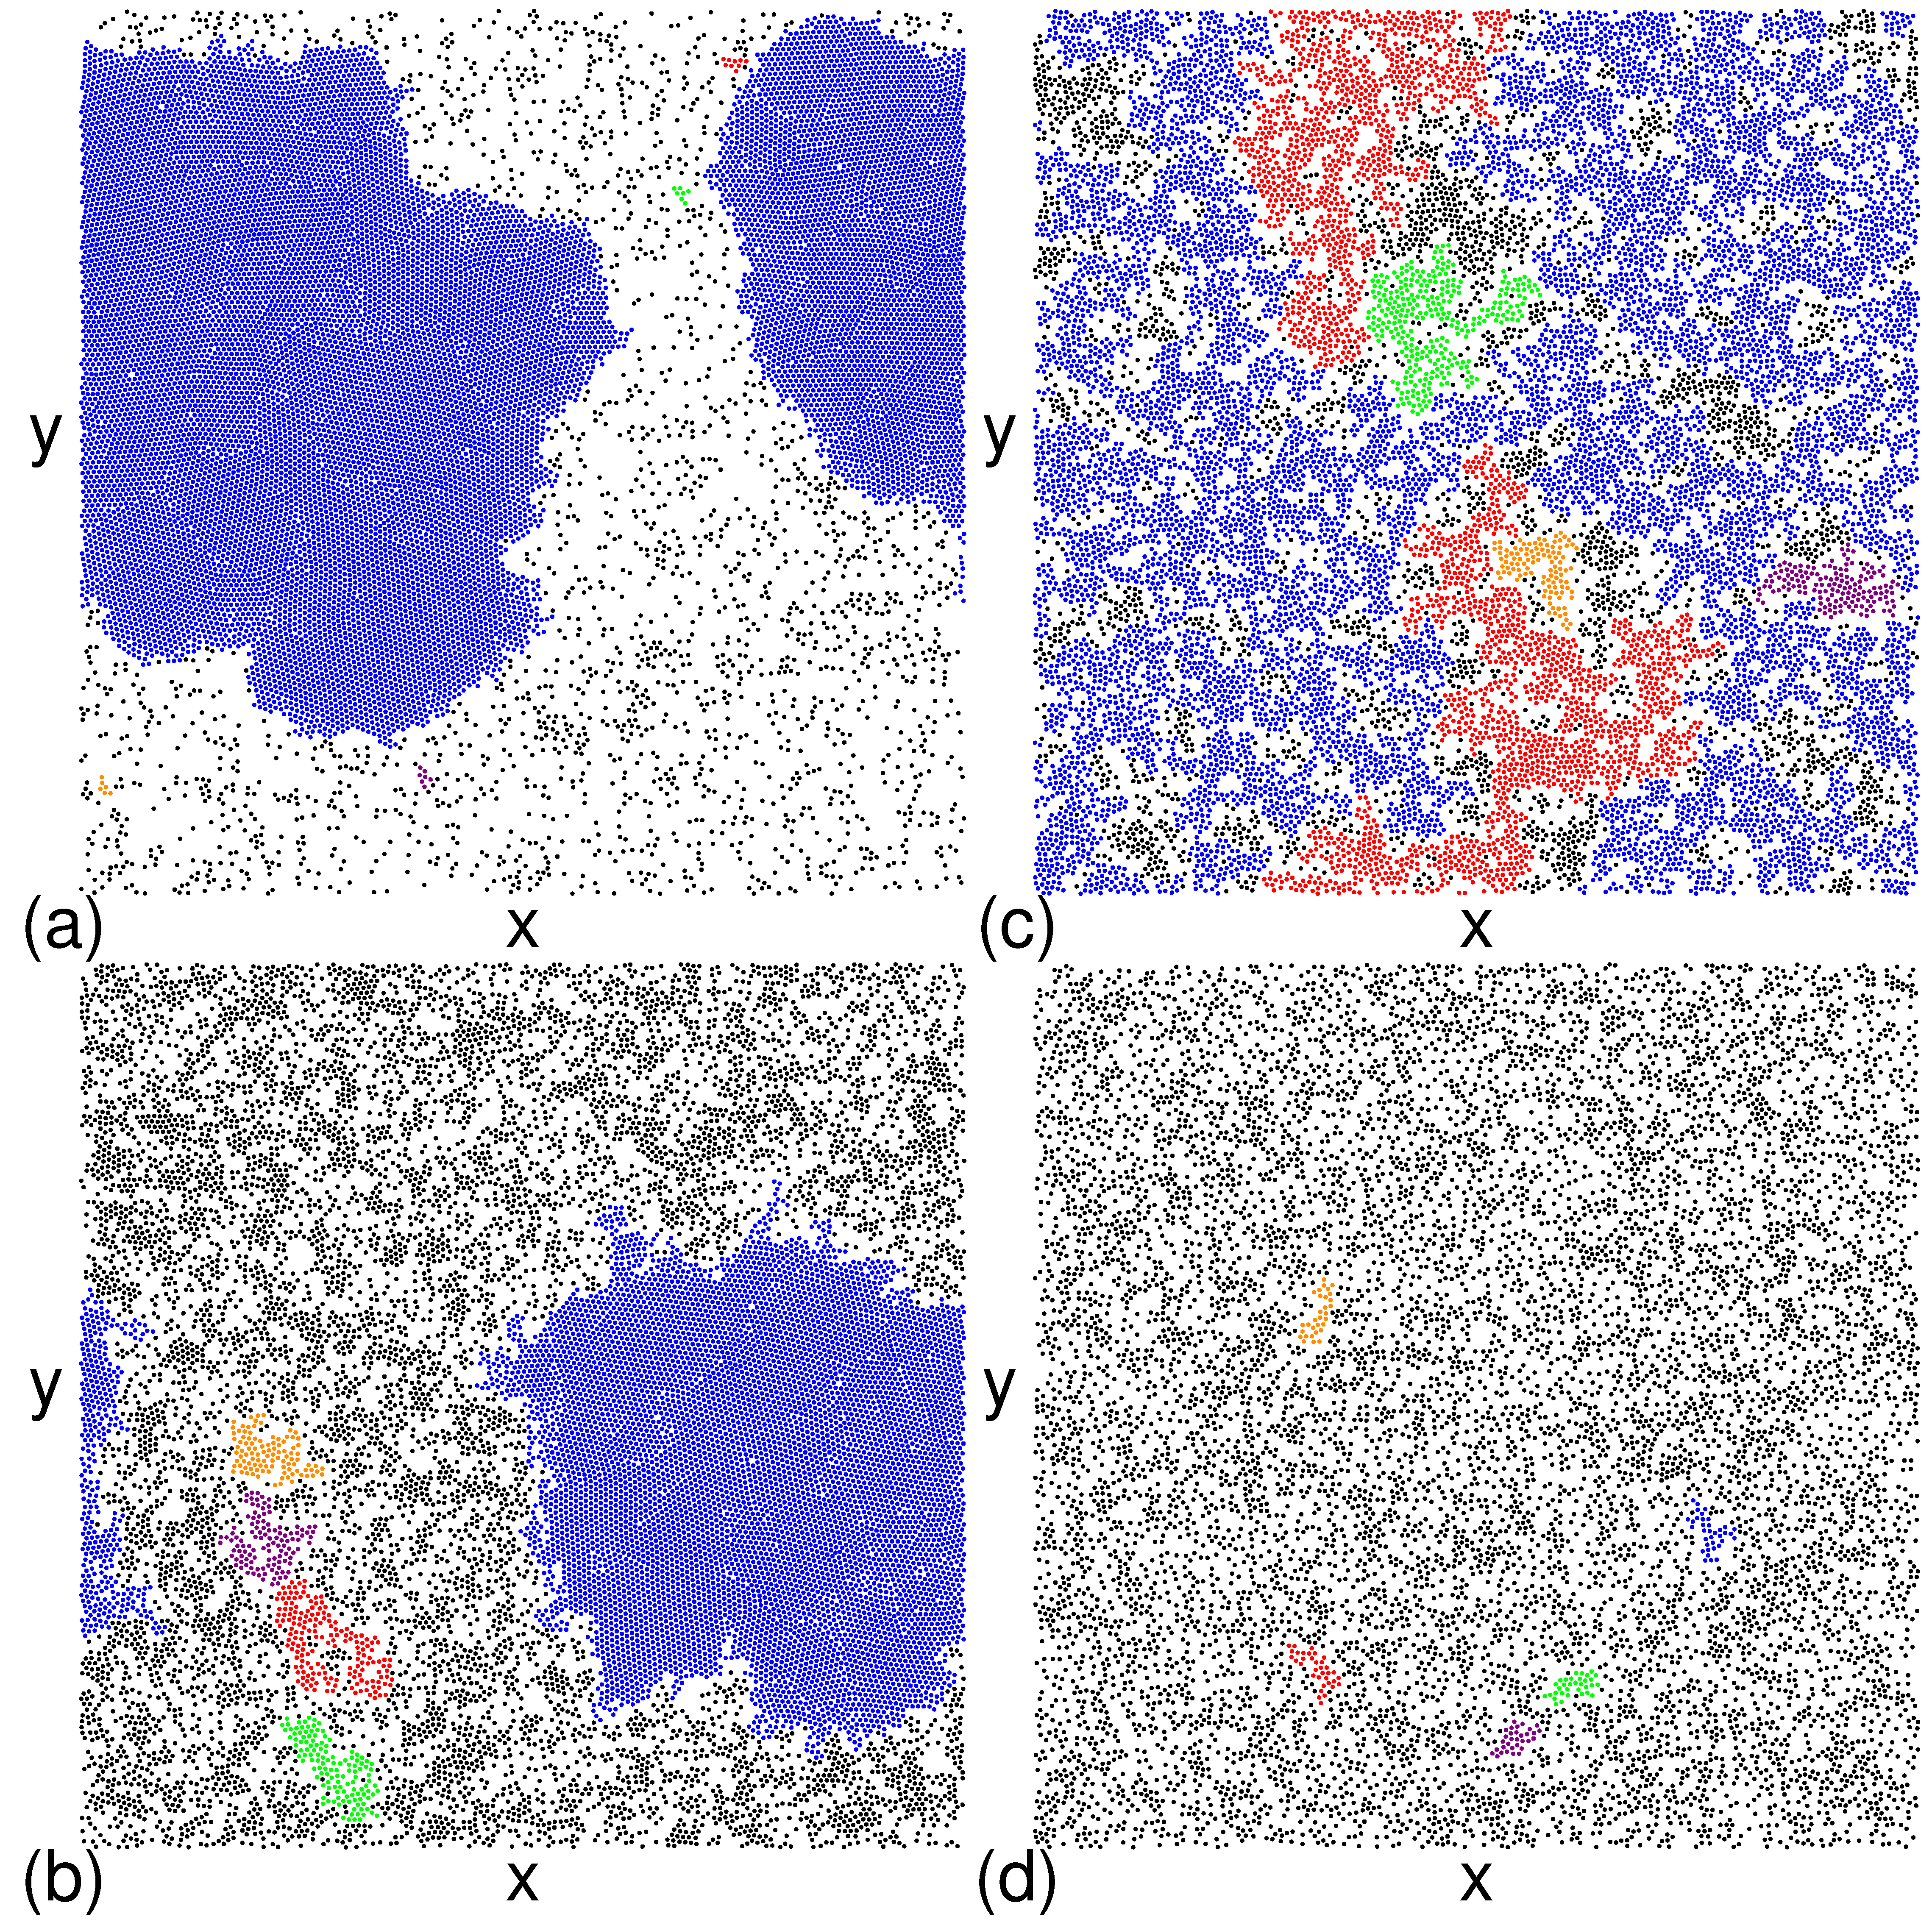
In Fig. 1 we show four representative images of the phases that appear for active disks moving over a quenched pinning landscape in a sample with and . The coloring highlights the largest individual clusters of disks, identified using the algorithm of Luding and Herrmann 28. In the absence of a substrate, , the disks form a phase separated state for these parameters. For in Fig. 1(a), a phase separated state containing a single high density cluster is still present. Disks in the surrounding low density gas state can be temporarily pinned since , but overall the morphology is similar to that of the pin-free state. We term this the active dewetted state, or Phase I. At in Fig. 1(b), a large cluster is still present but numerous smaller clusters have nucleated due to the trapping of gas phase disks by the pinning sites. As a result, the large cluster is smaller than that shown in Fig. 1(a) while the gas phase density is higher. This partially wetted state, called Phase II, can be viewed as a coexistence of the dewetted state, consisting of the large cluster, and a wetted state, in which the particles coat the entire substrate. At in Fig. 1(c), the single large cluster has vanished and the system adopts a uniform labyrinth morphology which we refer to as the wetted state or Phase III. In general we observe a similar sequence of phases at lower disk densities but find that the wetted state becomes less labyrinthine as the disks contact each other less frequently, as shown in Fig. 1(d) for and where the system forms a pinned liquid state called Phase IV.
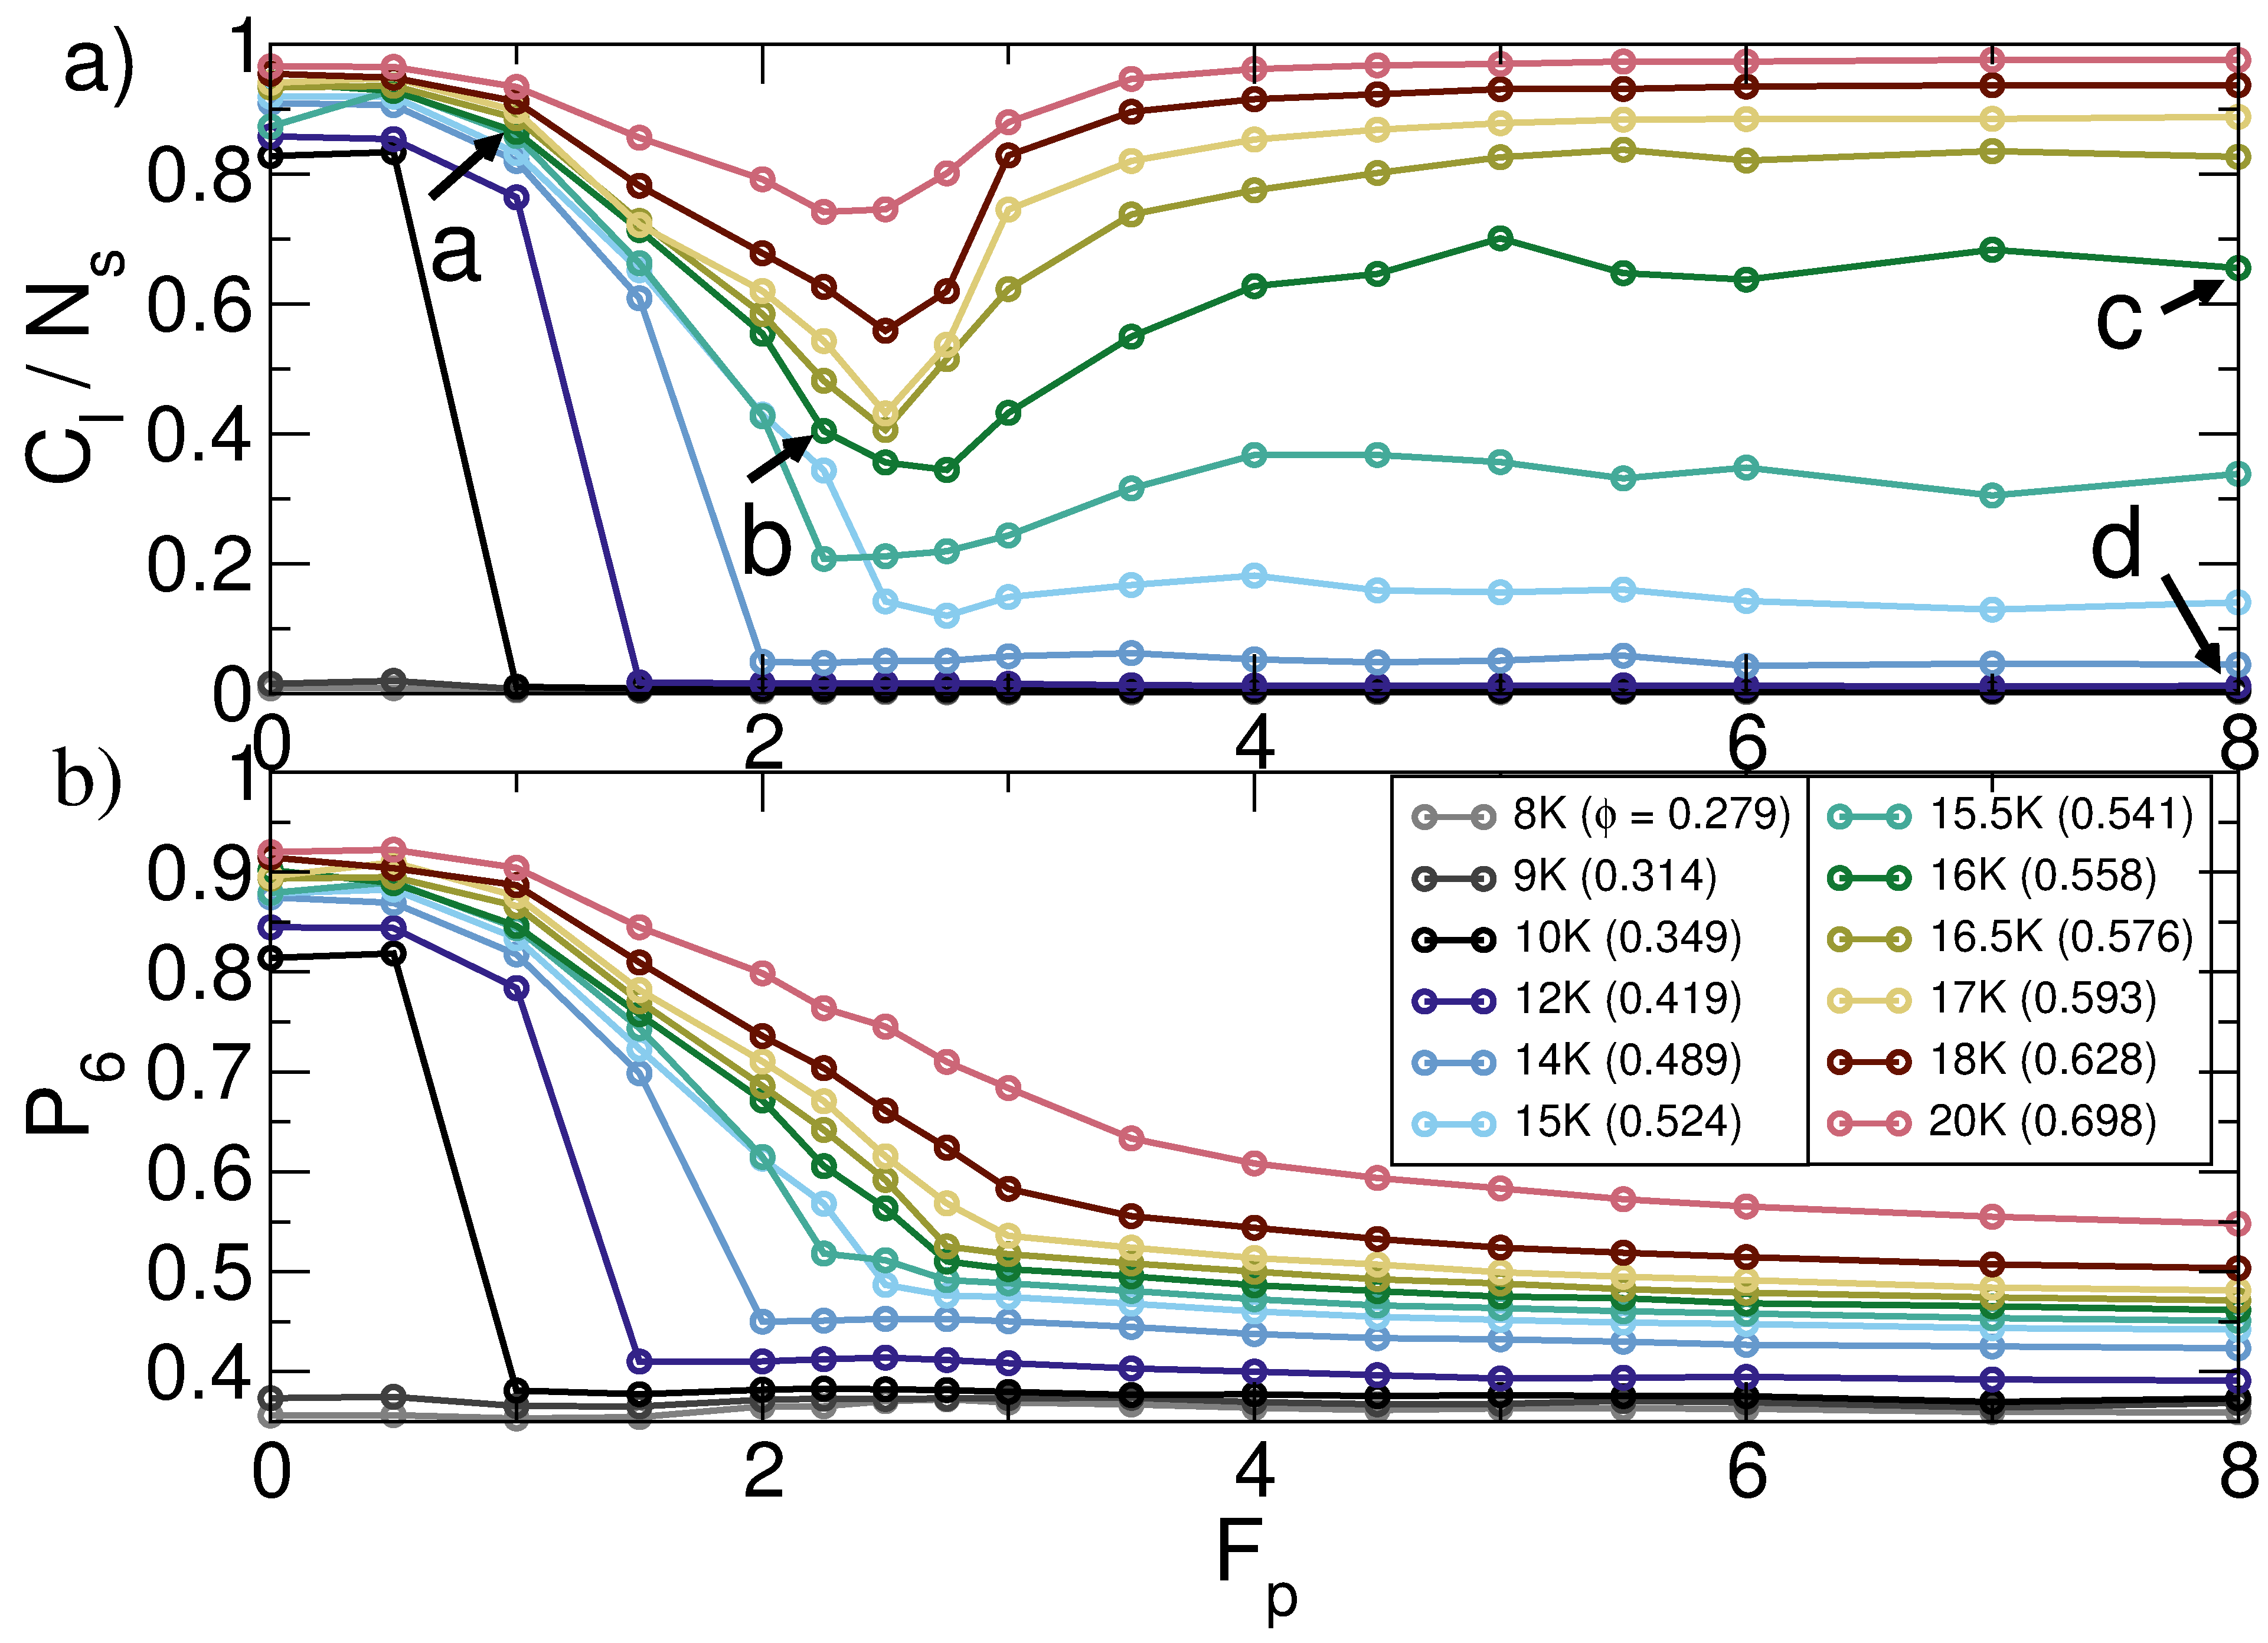
In Fig. 2(a) we plot the fraction of particles in the largest cluster versus for the system in Fig. 1 at a fixed run length of for varied . Figure 2(b) shows the corresponding fraction of sixfold coordinated disks obtained using the CGAL library29. For , we find and at low since the system forms a single large clump with strong sixfold ordering. In the range , there is a pronounced drop in both and with increasing as the system transitions from the clump phase illustrated in Fig. 1(a) to a pinned liquid phase of the type shown in Fig. 1(d). For , just before reaches a minimum value at the system enters a partially wetted state similar to that shown in Fig. 1(b). As increases further, increases again but continues to decease, indicating that clusters with disordered structure have emerged, as illustrated in Fig. 1(c) at where the system forms a labyrinth state and the disk density becomes uniform. The morphology of the large cluster is different in the two high regimes, with a compact cluster forming in the dewetted state for , and a much more porous, extended, and branching cluster appearing in the wetted state for . For at high , interconnections between small branching clusters can no longer percolate across the sample, so there is no giant branching cluster and remains low. Overall, we find that for the dewetted cluster (I), and are both large and the disk density is heterogeneous. In the partially wetted phase (II), is low and has an intermediate value while the disk density remains heterogenous. The wetted labyrinth phase (III) has high and high along with a homogeneous disk density. Finally, in the pinned liquid phase (IV), and are both low and the disk density is homogeneous.
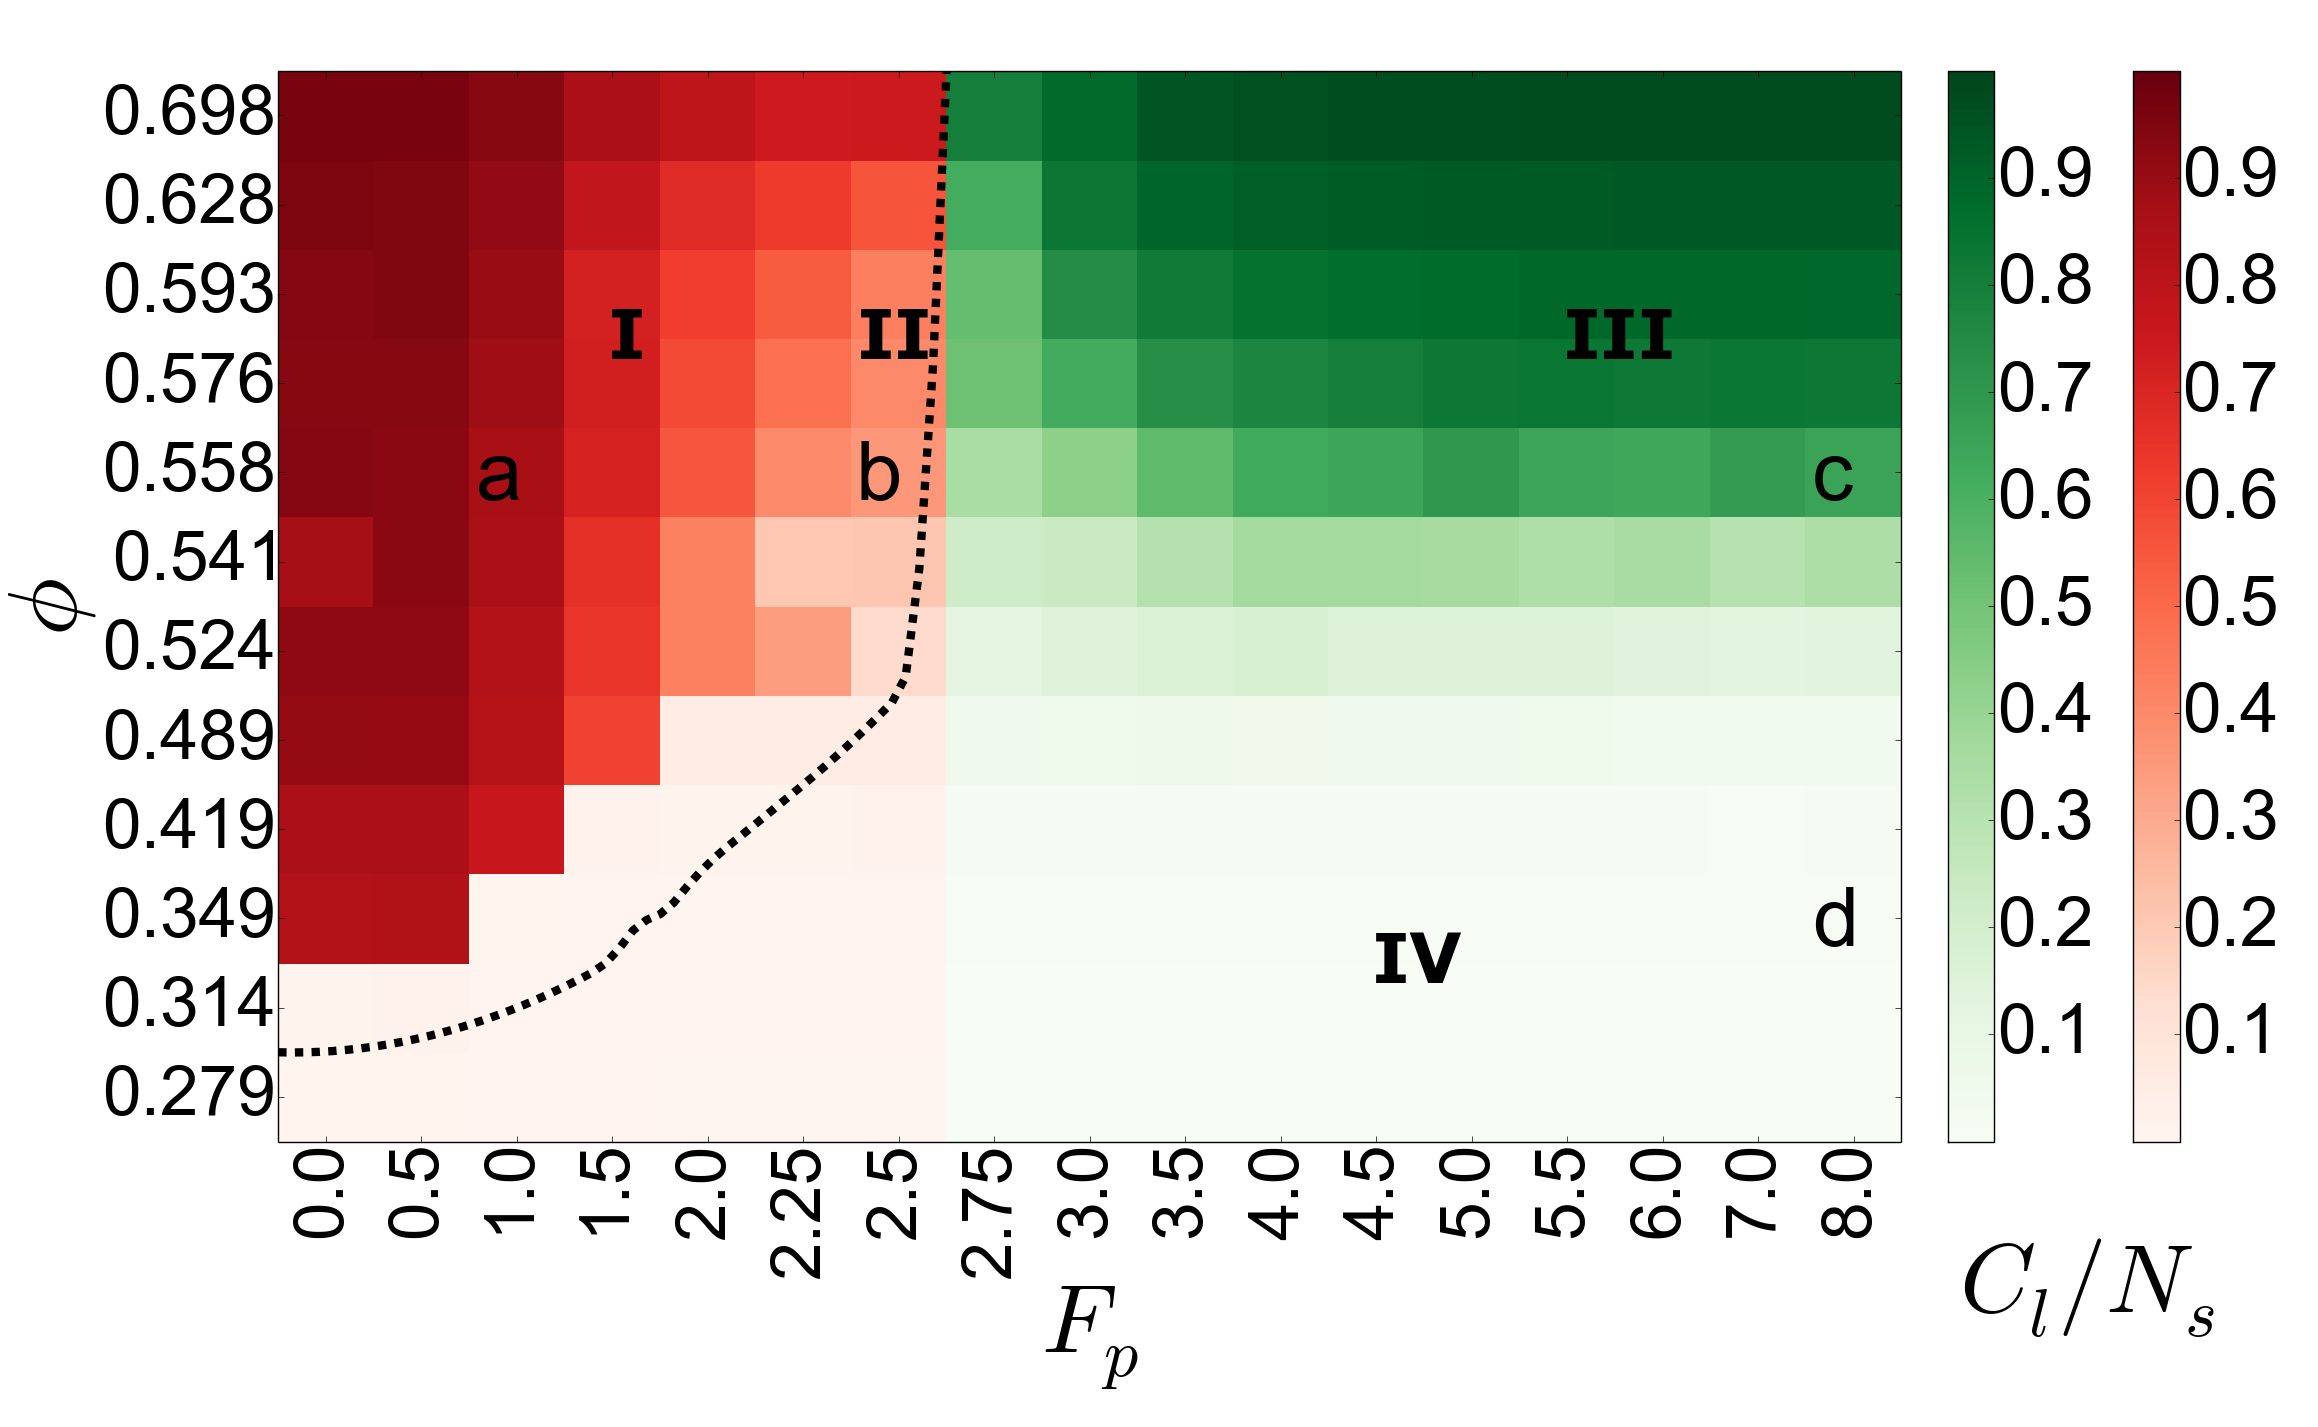
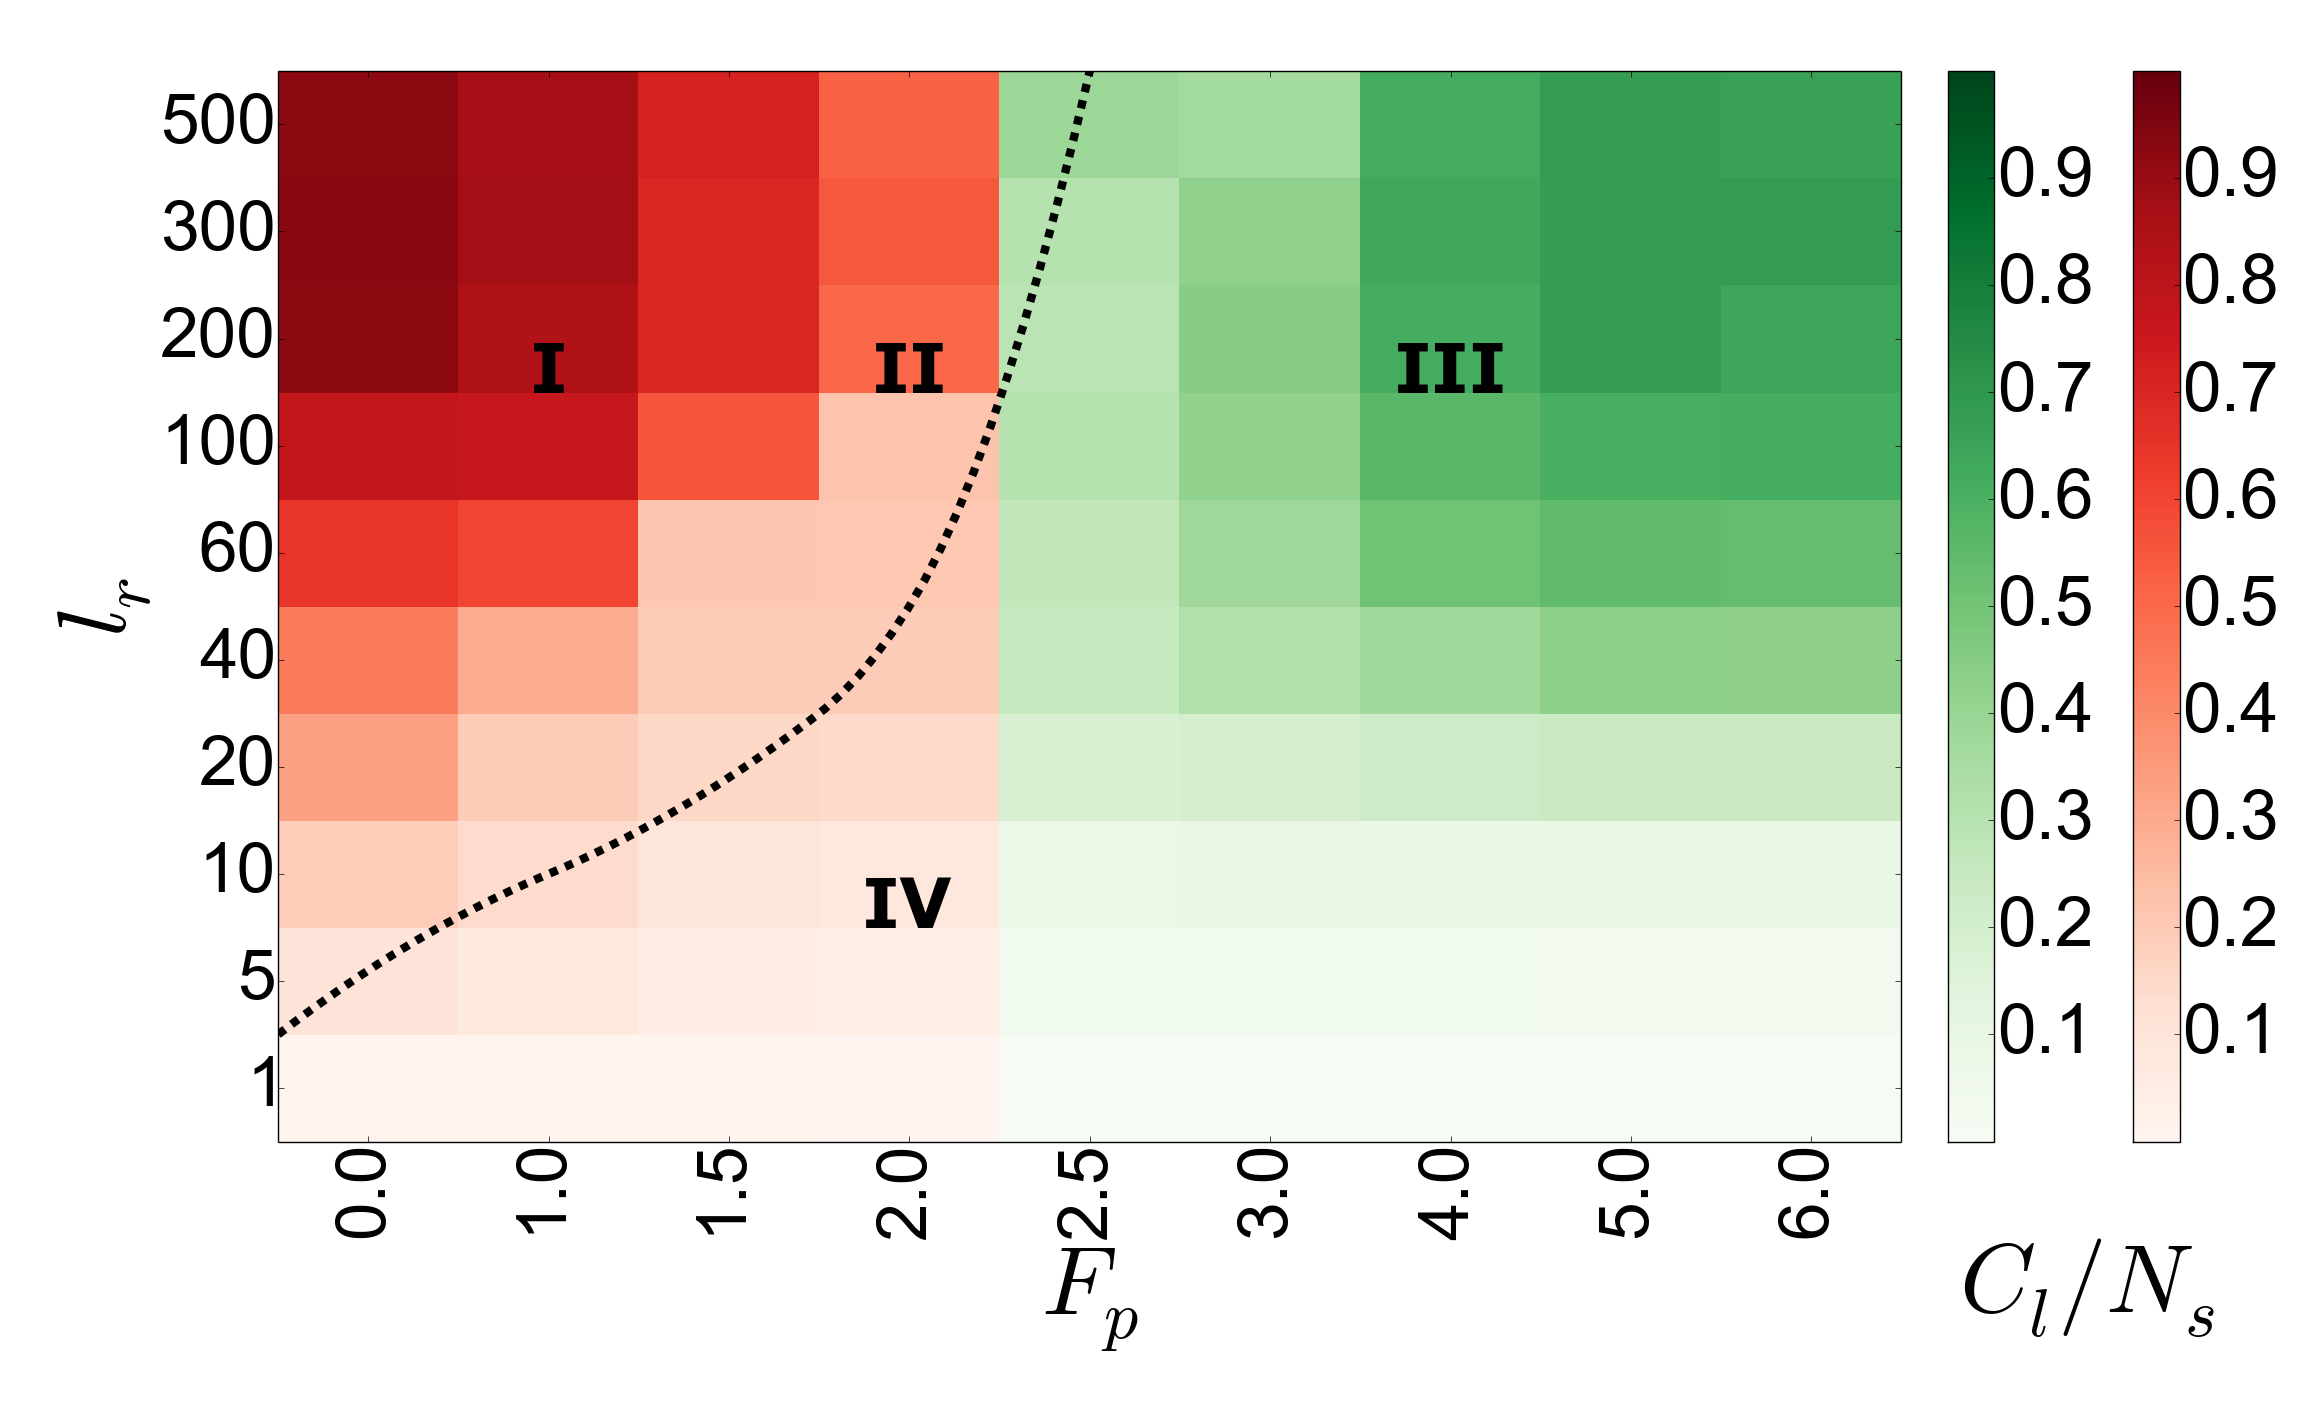
In Fig. 3(a) we show a heat map 30 based on values as a function of versus indicating the locations of phases I through IV. For , the system is too dilute to form clusters, so remains low at all values of .
A dewetting-wetting transition from phase I to phase III occurs for , with the dashed line indicating the sliver of partially wetted phase (II) that exists close to this transition. The transition from phase I to phase II is not sharply defined. For the clump-forming densities , over the range the radius of the compact clump decreases with increasing while the density of the gaslike phase surrounding the clump increases. A direct measurement of in the sample gives with and . In the dewetted phase I, there is a coexistence between a high density phase inside the clumps in which the local density is close to the monodisperse packing limit of , along with a low density phase with local density . As increases, more disks become trapped by pinning sites, so that the spatial extent of the dense phase decreases while remains constant. At the same time, increases until, at the transition to the fully wetted phase III, .
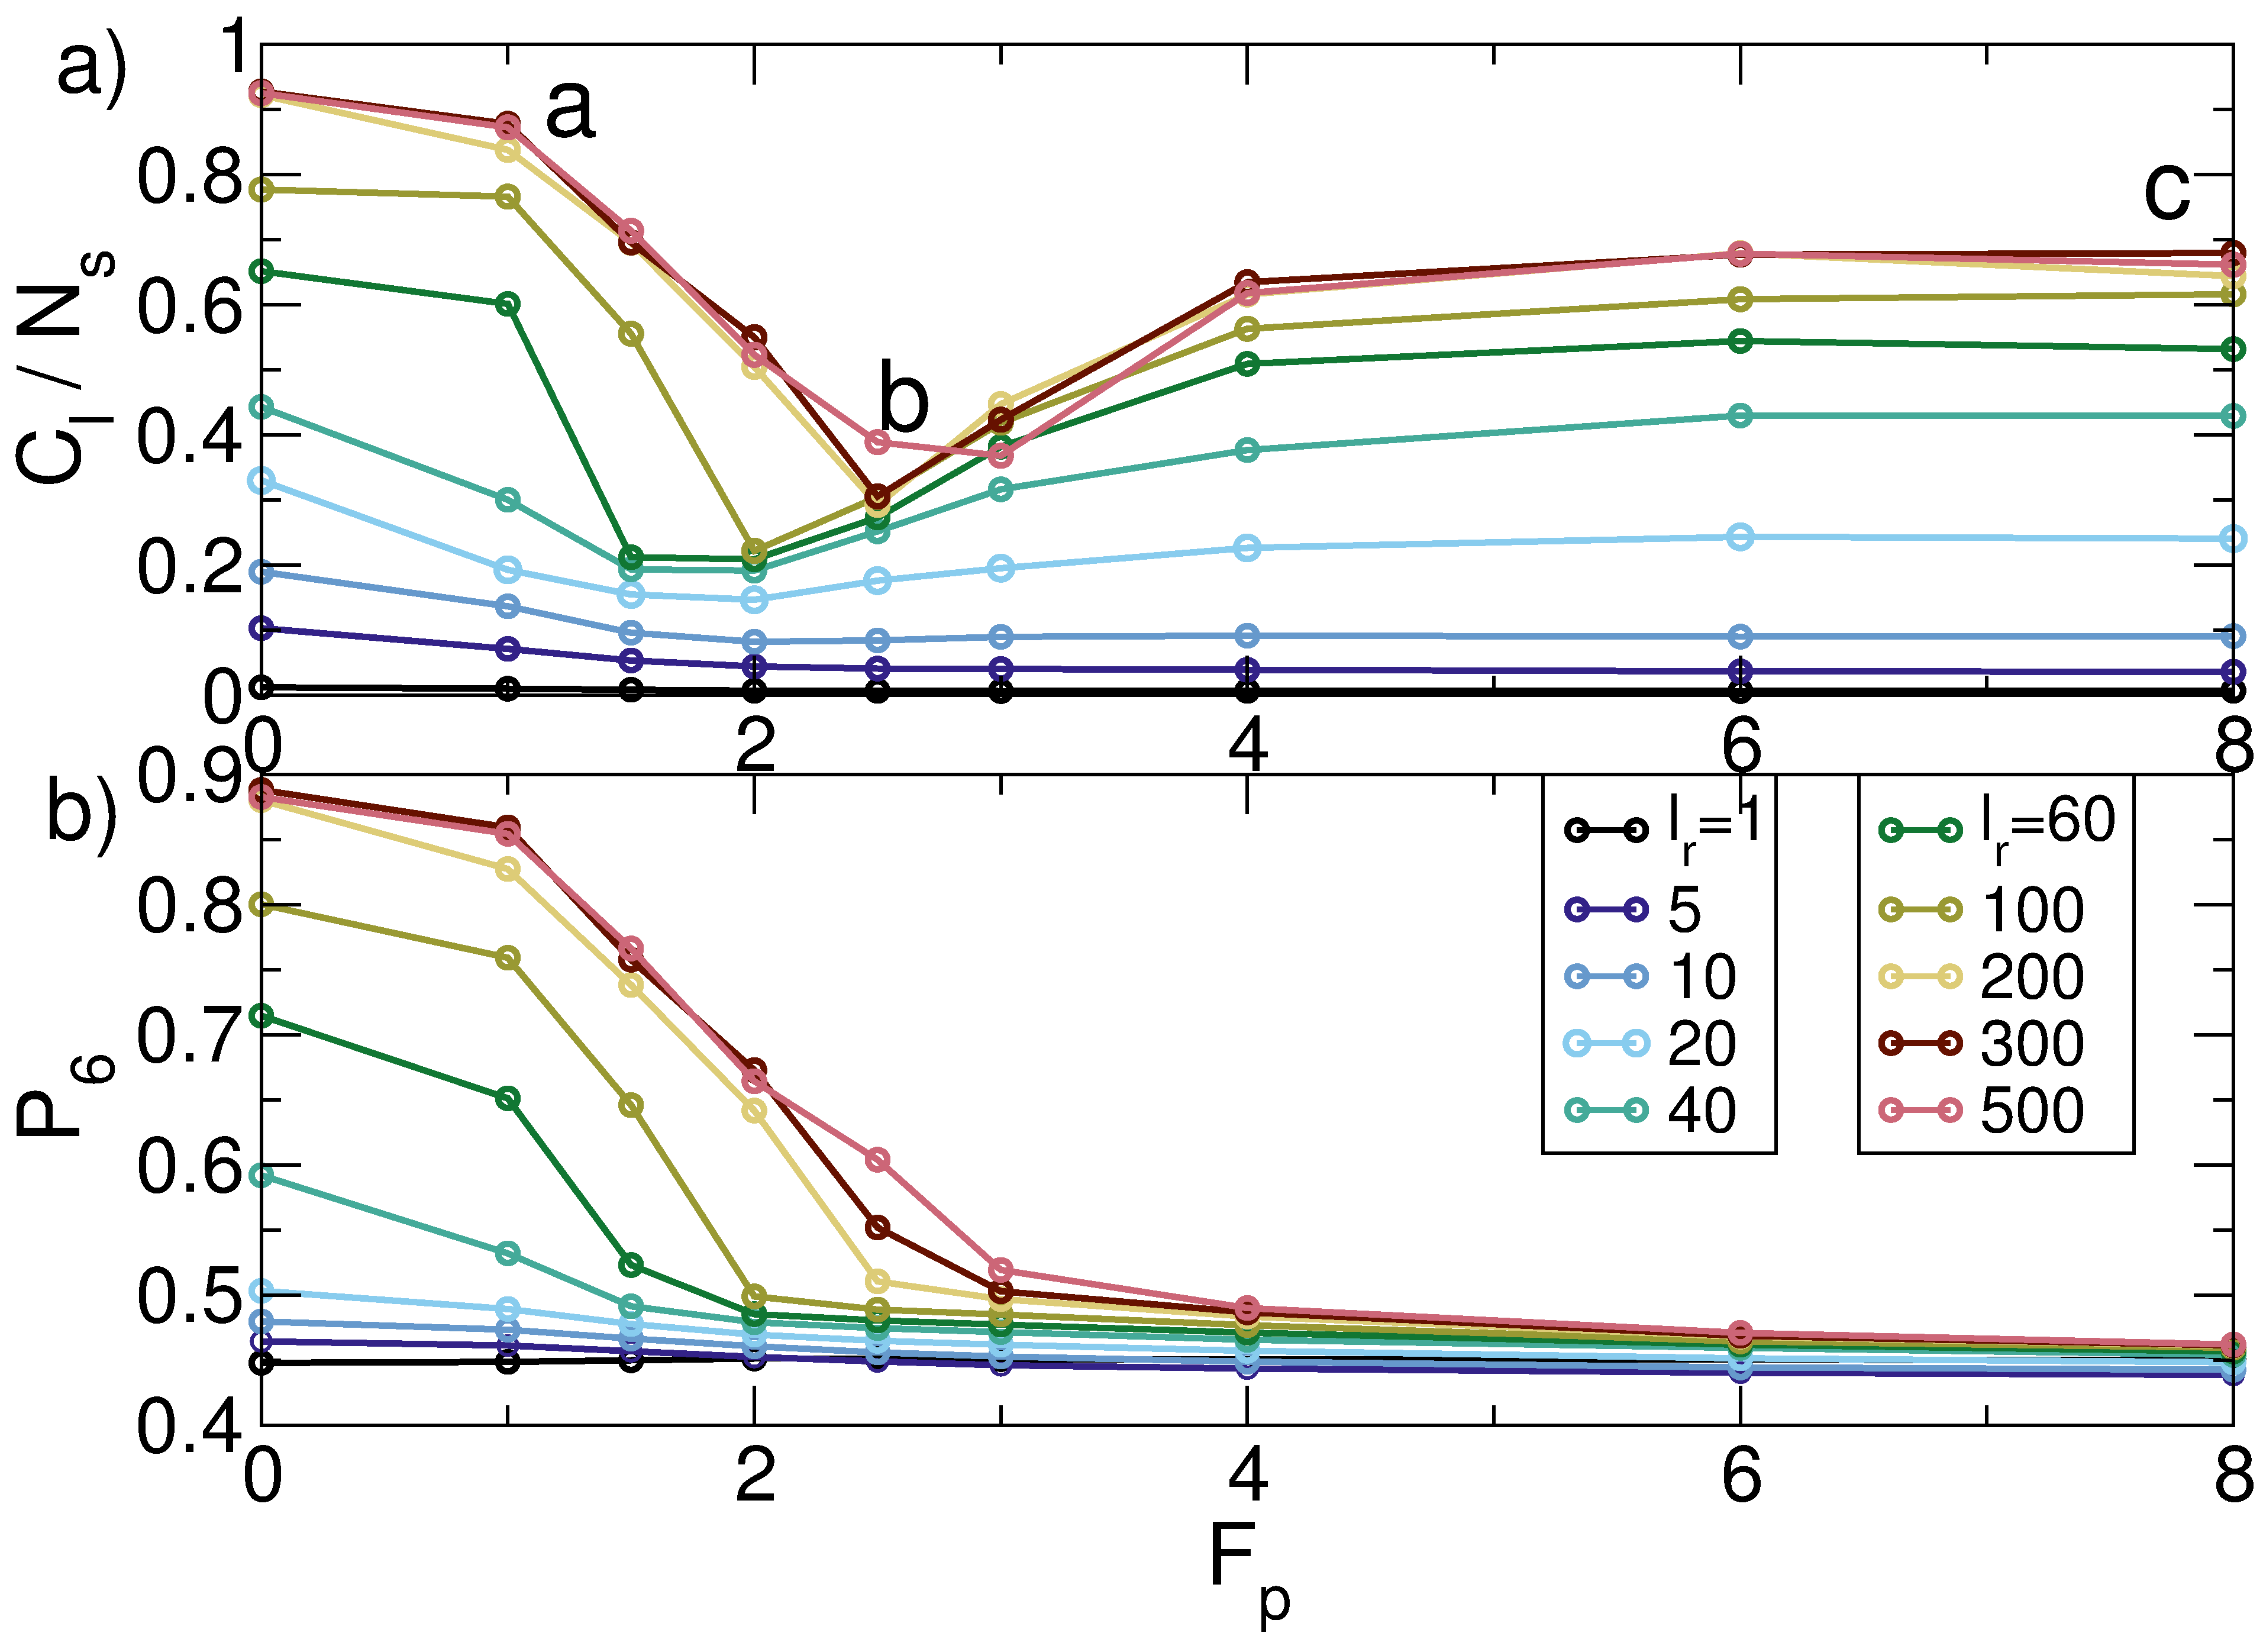
We have also considered the effect of the run length by fixing the disk density at and increasing , as shown in Fig. 4(a,b) where we plot and versus . For small , and are both low and the system is in a pinned liquid state. For large , a clump phase appears for and we observe a dip feature in and a drop in at the dewetting-wetting transition. The overall behavior is very similar to that shown for varied and fixed in Fig. 2. The heat map diagram of values in Fig. 5 as a function of versus illustrates the locations of phases I through IV.
To test the effect of the pinning site density, we fix , , and and increase the number of pinning sites . We find that at low pinning densities, a dewetted clump phase appears that transitions to a wetted phase as increases. One difference between sweeping and sweeping is that at the highest pinning densities the percolating cluster phase disappears. Since overlapping of pinning sites is not allowed, trapped disks are not likely to come into contact with each other to form a cluster, and at large almost every disk is trapped, so drops nearly to zero.
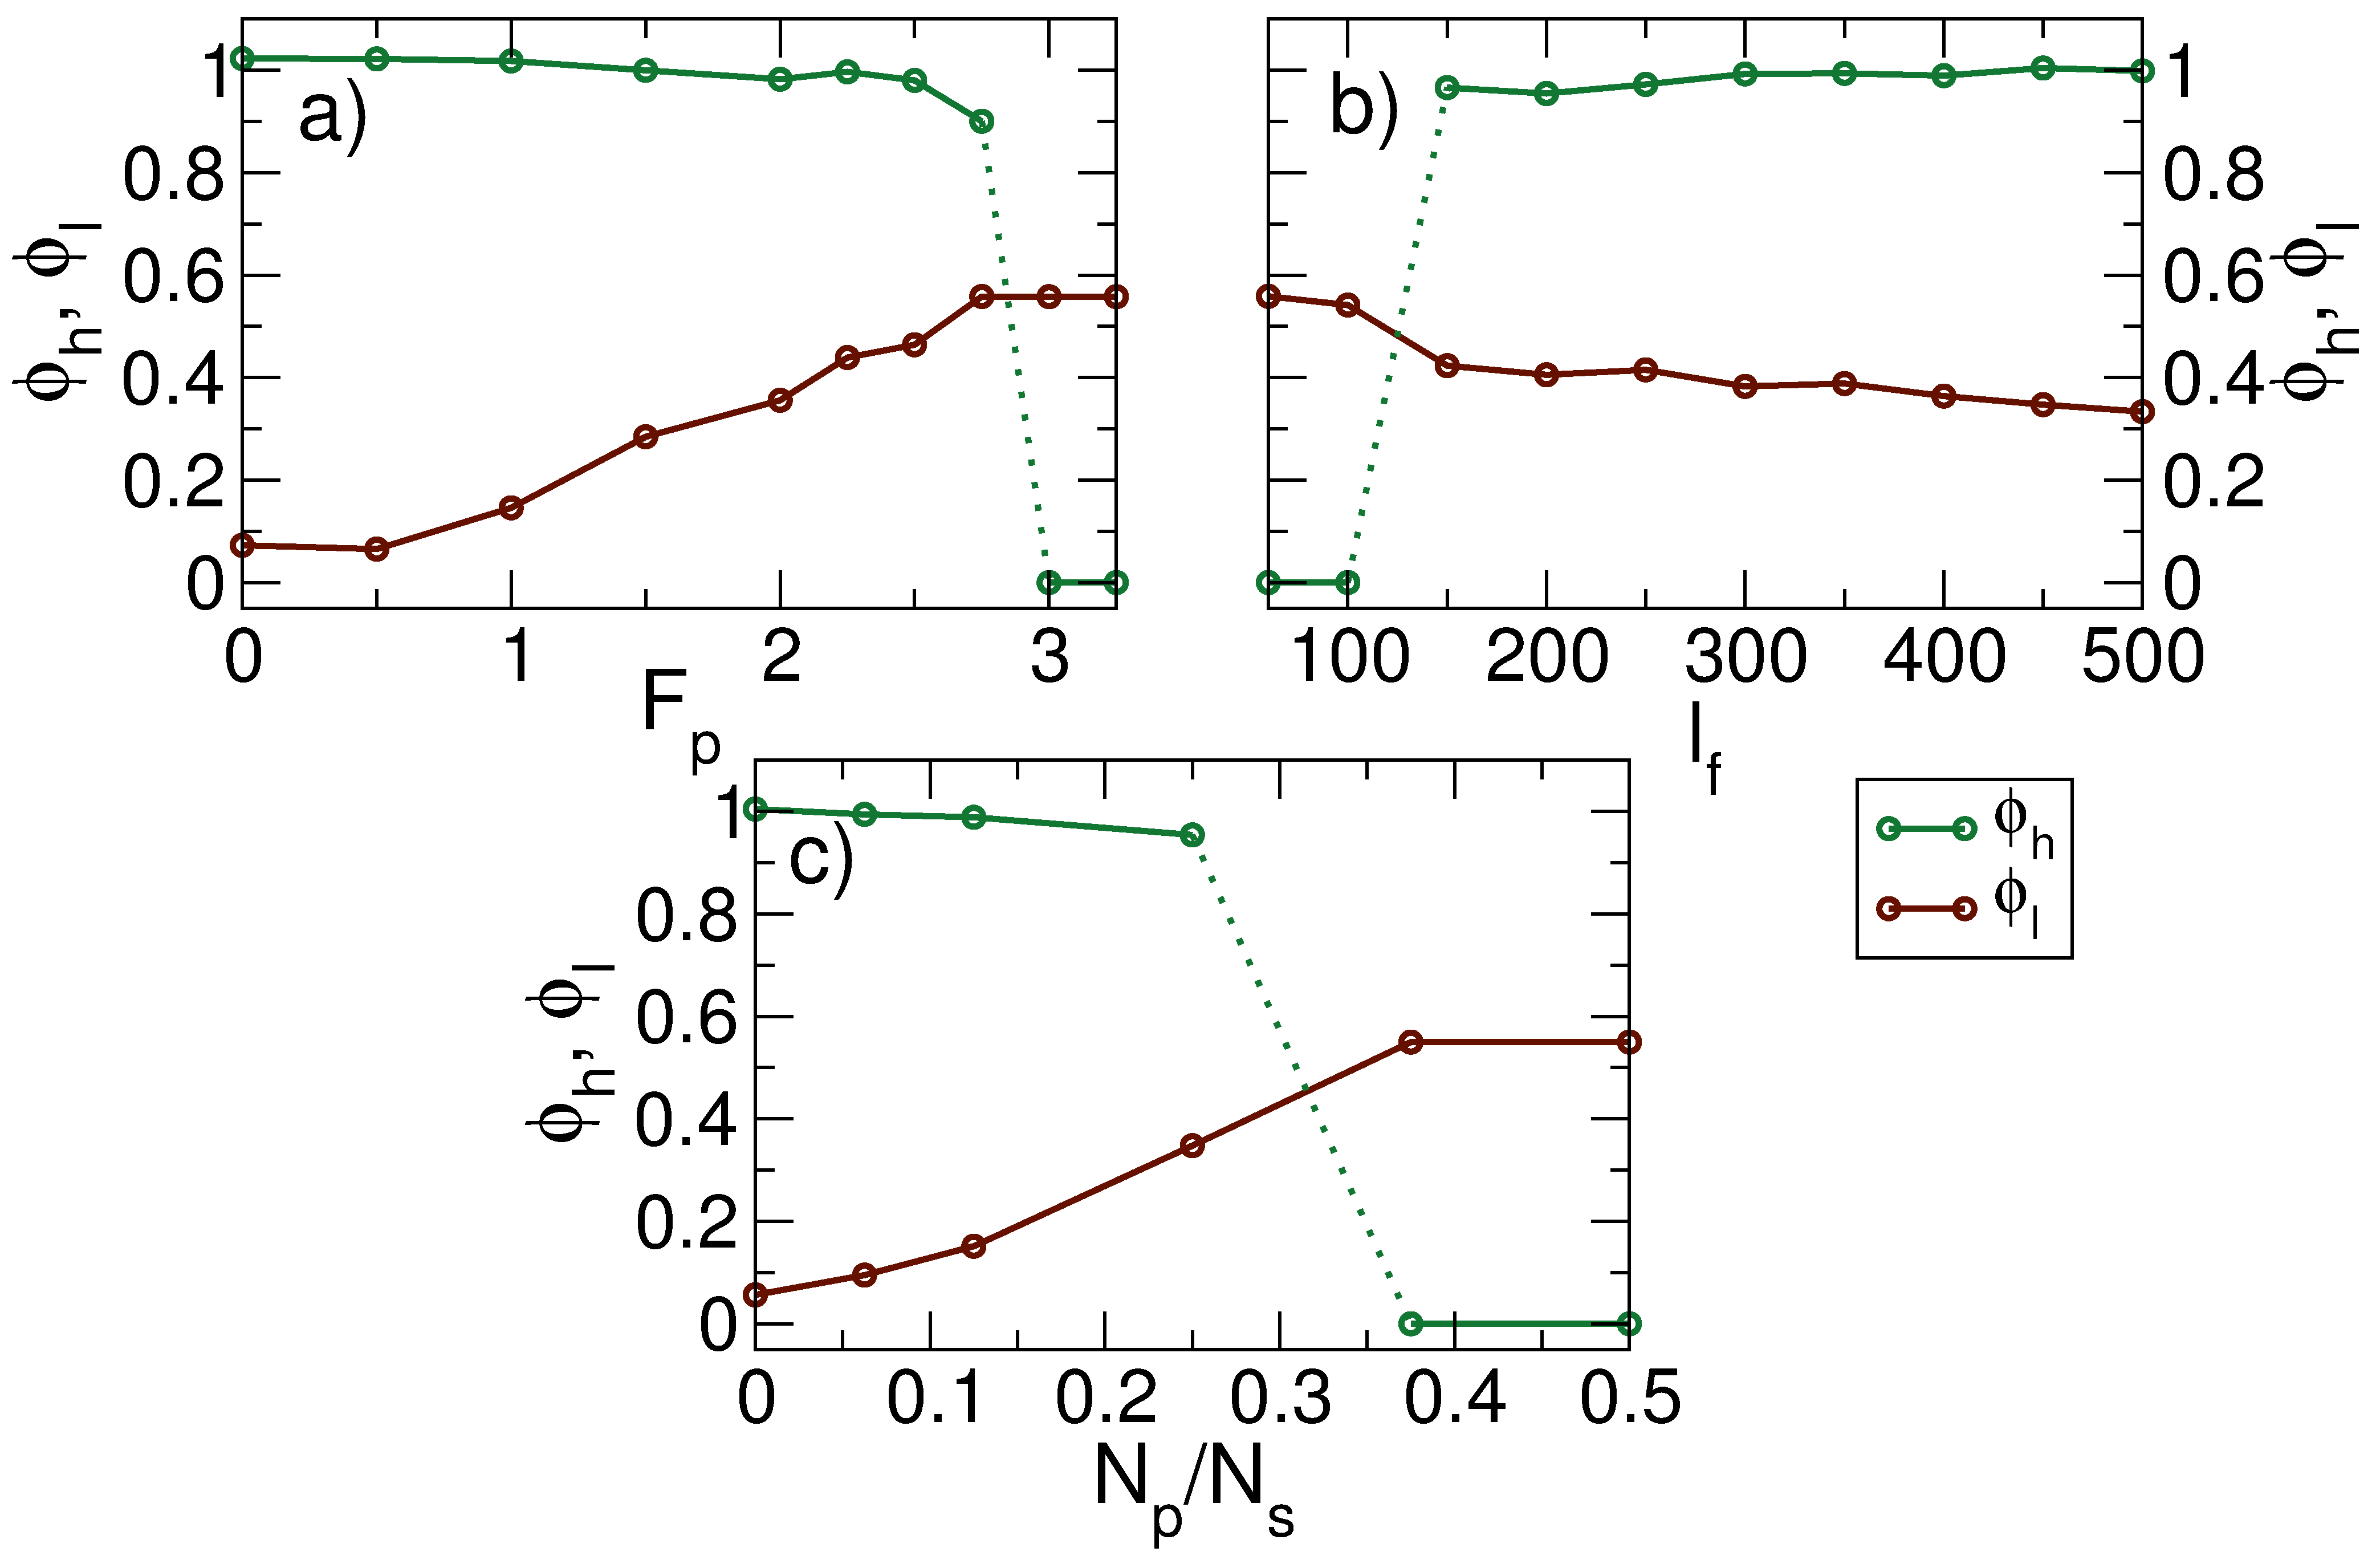
In Fig. 6 we plot the changes in the local density inside the clusters and in the gas phase as a function of , , and . In each case, decreases slightly from before suddenly dropping to when the cluster disappears and the system reaches a uniformly wetted state. At the same time, gradually increases as the transition to the fully wetted cluster-free state is approached. The gentle decrease in in the cluster state occurs since the effective pressure inside the cluster falls as the cluster shrinks. The increase in is caused by a simple conservation of mass; as disks leave the cluster they become part of the gas phase which fully wets the substrate once .
Our results could be tested using active mater systems in the presence of a rough substrate. One method that can be used to create such a substrate is optical trapping, which allows the substrate strength to be tuned by varying the light intensity. There has already been some work examining the behavior of run and tumble bacteria in optical trap arrays 31, 32. Although we focus on run and tumble systems, our results should be general to driven Brownian particle systems in which similar clustering transitions occur due to the density dependence of the particle motility 33. Since the disks in a cluster are less strongly coupled to the substrate than disks that are not part a cluster, the onset of clustering may be a useful strategy that could be exploited by living active matter to collectively escape from a disordered environment.
4 Summary
We have numerically examined run and tumble disks interacting with a random pinning substrate where we find that there can be active matter wetting-dewetting transitions as a function of pinning strength, disk density, and run length. In regimes where the pin-free system forms a cluster state, we find that increasing the substrate strength causes the size of the cluster to shrink gradually until the disk density becomes homogeneous. Here, the cluster phase can be viewed as a dewetted state while the homogeneous phase is like a wetted state. We show that the system exhibits different phases including a clump state, a partially wetted state in which clumps coexist with a gas of pinned disks, a fully wetted labyrinth state, and a pinned liquid state. Transitions between these states can be identified by measuring the size of the largest cluster and the fraction of sixfold coordinated particles. Our results indicate that pinning can induce transitions in the behavior of active matter systems that are similar to the pinning-induced order-disorder transitions in equilibrium condensed matter systems.
5 Acknowledgments
This work was carried out under the auspices of the NNSA of the U.S. DoE at LANL under Contract No. DE-AC52-06NA25396. Cs. Sándor and A. Libál thank the Nvidia Corporation for their graphical card donation that was used in carrying out these simulations.
References
- 1 E.H. Brandt, Rep. Prog. Phys. 1995, 58, 1465.
- 2 S.C. Ganguli, H. Singh, G. Saraswat, R. Ganguly, V. Bagwe, P. Shirage, A. Thamizhavel, and P. Raychaudhuri, Sci. Rep. 2015, 5, 10613.
- 3 M.-C. Cha and H.A. Fertig, Phys. Rev. Lett. 1995, 74, 4867.
- 4 D. Carpentier and P. Le Doussal, Phys. Rev. Lett. 1998, 81, 1881.
- 5 A. Pertsinidis and X.S. Ling, Phys. Rev. Lett. 2008, 100, 028303.
- 6 C. Reichhardt and C.J. Olson, Phys. Rev. Lett. 2002, 89, 078301.
- 7 S. Deutschländer, T. Horn, H. Löwen, G. Maret, and P. Keim, Phys. Rev. Lett. 2013, 111, 098301.
- 8 E.N. Tsiok, D.E. Dudalov, Yu.D. Fomin, and V.N. Ryzhov, Phys. Rev. E 2015, 92, 032110.
- 9 W. Qi and M. Dijkstra, Soft Matter 2015 11, 2852.
- 10 M.C. Marchetti, J.F. Joanny, S. Ramaswamy, T.B. Liverpool, J. Prost, M. Rao, and R.A. Simha, Rev. Mod. Phys. 2013, 85, 1143.
- 11 C. Bechinger, R. Di Leonardo, H. Löwen, C. Reichhardt, G. Volpe, and G. Volpe, Rev. Mod. Phys., in press (2016).
- 12 H.C. Berg, Random Walks in Biology (Princeton University Press, Princeton, 1983).
- 13 J.R. Howse, R.A.L. Jones, A.J. Ryan, T. Gough, R. Vafabakhsh, and R. Golestanian, Phys. Rev. Lett. 2007, 99, 048102.
- 14 G. Volpe, I. Buttinoni, D. Vogt, H.-J. Kümmerer, and C. Bechinger, Soft Matter 2011, 7, 8810.
- 15 Y. Fily and M.C. Marchetti, Phys. Rev. Lett. 2012, 108, 235702.
- 16 G.S. Redner, M.F. Hagan, and A. Baskaran, Phys. Rev. Lett. 2013, 110, 055701.
- 17 J. Palacci, S. Sacanna, A.P. Steinberg, D.J. Pine, and P.M. Chaikin, Science 2013, 339, 936.
- 18 I. Buttinoni, J. Bialk’ e, F. Kümmel, H. Löwen, C. Bechinger, and T. Speck, Phys. Rev. Lett. 2013, 110, 238301.
- 19 C. Tung, J. Harder, C. Valeriani, and A. Cacciuto, Soft Matter 2016, 12, 555.
- 20 J. Bialké, J.T. Siebert, H. Löwen, and T. Speck, Phys. Rev. Lett. 2015, 115, 098301.
- 21 J. Tailleur and M.E. Cates, Phys. Rev. Lett. 2008, 100, 218103.
- 22 A.G. Thompson, J. Tailleur, M.E. Cates, and R.A. Blythe, J. Stat. Mech.: Theor. Exp. 2011, 2011, P02029.
- 23 C. Reichhardt and C. J. Olson Reichhardt, Phys. Rev. E 2014, 90, 012701.
- 24 O. Chepizhko, E.G. Altmann, and F. Peruani, Phys. Rev. Lett. 2013, 110, 238101.
- 25 O. Chepizhko and F. Peruani, Phys. Rev. Lett. 2013, 111, 160604.
- 26 D. Quint and A. Gopinathan, Phys. Biol. 2015, 17, 046008.
- 27 D. Bonn, J. Eggers, J. Indekeu, J. Meunier, and E. Rolley, Rev. Mod. Phys. 2009, 81, 739.
- 28 S. Luding and H.J. Herrmann, Chaos 1999, 9, 673.
- 29 M. Karavelas, “2D Voronoi diagram adaptor” in CGAL User and Reference Manual (2016).
- 30 J.D. Hunter, Comput. Sci. Eng. 2007, 9, 90.
- 31 M Paoluzzi, R Di Leonardo, and L Angelani, J. Phys.: Condens. Matter 2014, 26, 375101.
- 32 E. Pince, S.K.P. Velu, A. Callegari, P. Elahi, S. Gigan, G. Volpe, and G. Volpe, Nature Commun. 2015, 7, 10907.
- 33 M.E. Cates and J. Tailleur, Europhys. Lett. 2013, 101, 20010.