The Detached Eclipsing Binary KV29 and the Age of the Open Cluster M11
Abstract
We present an extensive set of photometry and radial velocities for the detached eclipsing binary KV 29 in the intermediate-aged open cluster M11 (NGC 6705). Spectroscopy shows that the system is double-lined and all available evidence (proper motion, photometry, and position on the CMD) indicates it is a member of the cluster. We find the period of the binary to be days. We find masses and , and radii and for the primary and secondary stars, respectively. Because the primary star in the binary is rapidly evolving and is brighter than the cluster turnoff in a color-magnitude diagram, the measurement of its radius leads to a strong constraint on the cluster age. We find the age of M11 to be Myr, where the quoted uncertainties come from statistical errors in the calculated masses and radii, and systematic uncertainties due to the ambiguity of the metallicity of the open cluster and variations within the isochrone models concerning heavy elements and convective overshooting.
1 Introduction
One of the most precise ways to determine the ages of stars (besides the Sun) involves the measurement of the masses and radii of evolved stars in detached eclipsing binaries (DEBs). Masses are critical inputs for stellar models that determine the evolutionary timescales, and accurate radii can precisely identify the evolutionary states of the stars. Classical age measurement methods involving the use of isochrones in the color-magnitude (CMD) plane generally have uncertainties (often unstated) of greater than 10% due to continuing difficulties in the precise measurement of distance, reddening, and chemical composition; in theoretical uncertainties in color- relations and stellar interior physics; and due to degeneracies in the effects of each of these things on the isochrones. Fortunately, these issues can largely be avoided using DEB systems where masses and radii can be determined using straightforward physical principles.
Not all DEBs have characteristics that allow precise determinations of age. The most important requirement is that at least one component needs to be starting to rapidly evolve in size — stars that have changed significantly in radius from their zero-age main sequence value break degeneracies involving uncertainties in age, distance, reddening, model physics, and chemical composition (Southworth et al., 2004). Another requirement is that both stars in the DEB must show lines in the spectrum for radial velocity measurements and the eclipses must be strong (preferably total) so that a system inclination can be precisely determined. Lastly, for precise mass and age measurements to be made, the orbital period of the system must not be so short that interactions between the components affect the stars’ characteristics. A star evolving off the main sequence cannot have lost or gained significant mass, as this would critically affect the derived age. More subtly, interactions between the stars can lead to a host of effects from nonsphericity to modified rotation (with its own effects).
M11 is a very rich intermediate-age open cluster, which provides us with a heavily-populated CMD and maximizes our chances of finding useful DEB systems. Hargis et al. (2005) and Koo et al. (2007) surveyed M11 for variable stars, detecting 5 DEBs that potentially meet the criteria for precise age determination. In this paper, we examine the DEB KV29 (, identified as an A0 star (Lindblad, 1922). McNamara et al. (1977) report that the system has a proper motion cluster membership probability of 98%. Cantat-Gaudin et al. (2014) give it a 0% membership probability based on a radial velocity measurement, but this can be explained by binarity. The photometry of the system (; M11-1139 in the tabulation of Stetson 2000) places it brighter than the cluster’s turnoff, meaning that at least one of the stars is likely to be significantly evolved. Koo et al. (2007) showed that the system had eclipses with similar depths ( and 0.07 mag), meaning that the system was likely to be double lined. There were signs of modest ellipsoidal variation of about 0.02 mag outside of eclipse, indicating that the stars are slightly nonspherical. This is consistent with the relatively short period of 4.64576 d they reported.
For the purposes of our age analysis below, we will need to have some knowledge of the cluster metallicity and reddening, although we try to use methods that minimize their importance. In addition, it is worth keeping previous determinations of the cluster age in mind because systematic differences between our eclipsing binary methods and those using CMDs can identify failings in our understanding of the physics governing these stars. Sung et al. (1999) derived log by comparing CMDs with theoretical isochrones, and determined an interstellar reddening and a distance modulus . For the metal content of the stars, Gonzales & Wallerstein (2000) derived a mean [Fe/H] value for M11 of by analysing high-quality spectra of 10 bright K giants. As they state, this value of [Fe/H] is consistent with the expected value derived from the cluster’s position in the disk (6.9 kpc away from the galactic center) and the trend of increasing metallicity with decreasing distance from the galactic center. Santos et al. (2012) found [Fe/H] from high-resolution spectroscopy of one giant, although it should be noted that this value involved a metallicity-dependent correction that was extrapolated beyond the [Fe/H] values in the original calibrating sample. (The uncorrected value was .) Recently Cantat-Gaudin et al. (2014) found [Fe/H] from spectroscopy of 21 cluster members, and using that composition along with and photometry derived ages between 250 and 316 Myr (depending on the model isochrones used). Beaver et al. (2014) used Strömgren photometry to find the metallicity of M11 to be [Fe/H] from 162 F-type cluster main sequence stars (although there is a large dispersion of 0.59 dex in individual values), and a reddening of using 332 B-A3 type stars.
2 Observations and Data Reduction
2.1 Photometry
M11 was observed on 37 nights from June 2009 to August 2011 (with one additional night in 2013) in filters using the 1.0m telescope at Mount Laguna Observatory (hereafter, MLO) with the CCD camera field covering an area approximately , for a scale of about pixel-1. The nights of observation are listed in Table 1. Exposure times for varied between 90 and 300 s depending on filter and atmospheric conditions. The exposure time was adjusted throughout the night in order to achieve a peak of about 30,000 counts for the binary system per image. The seeing from our observations generally produced a FWHM of stellar images of arcsec. Image processing (overscan subtraction, bias subtraction, and flat-field correction) was done using standard tools in IRAF111IRAF is distributed by the National Optical Astronomy Observatory, which is operated by the Association of Universities for Research in Astronomy, Inc., under cooperative agreement with the National Science Foundation..
M11 is a heavily-populated open cluster, and crowding in the field is significant. In order to derive precise light curves, we employed point-spread function (PSF) photometry using DAOPHOT and ALLSTAR (Stetson, 1987). The PSF was iteratively fit and allowed to vary across the frame according to a quadratic polynomial. Typically around 150 relatively isolated stars were used to determine the PSF.
After photometry was derived for each frame using ALLSTAR, we applied ensemble methods (Honeycutt, 1992; Sandquist et al., 2003) to correct the photometric zeropoints for effects such as nightly variations in atmospheric transparency. Because thousands of stars could typically be measured on each image, the zeropoints are very well determined from the stellar ensemble. As the zeropoints are refined, the median instrumental magnitudes for the stars become better determined as well. The median magnitudes and frame zeropoints were iteratively recalculated until all values converged to better than 0.0005 mag.
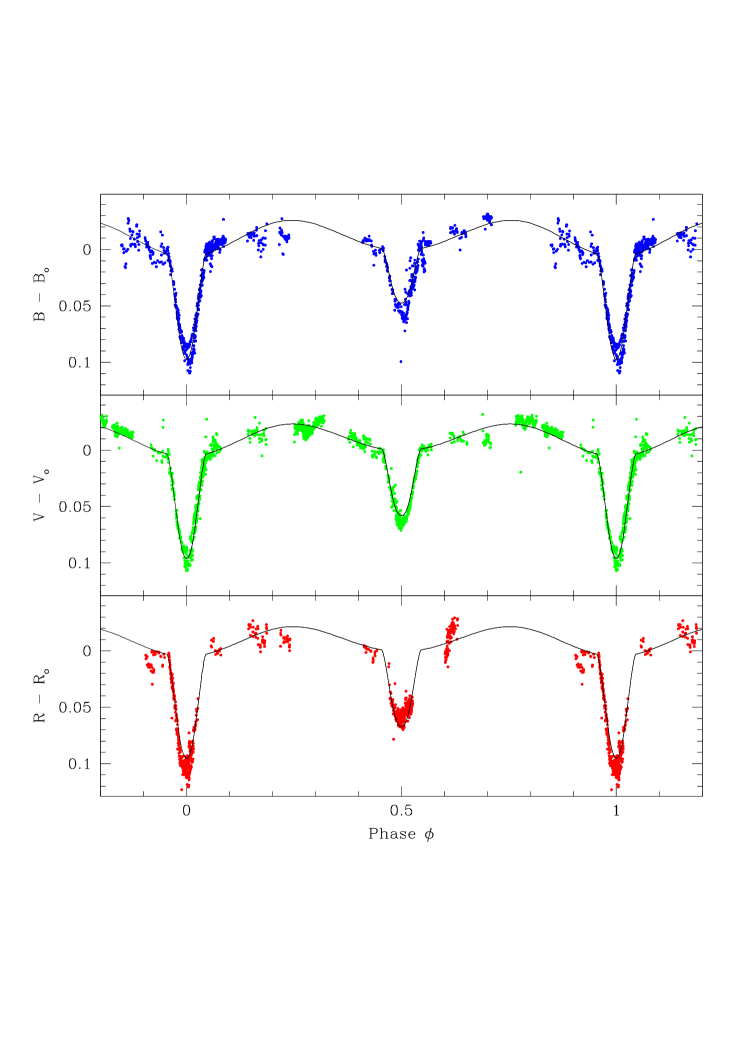
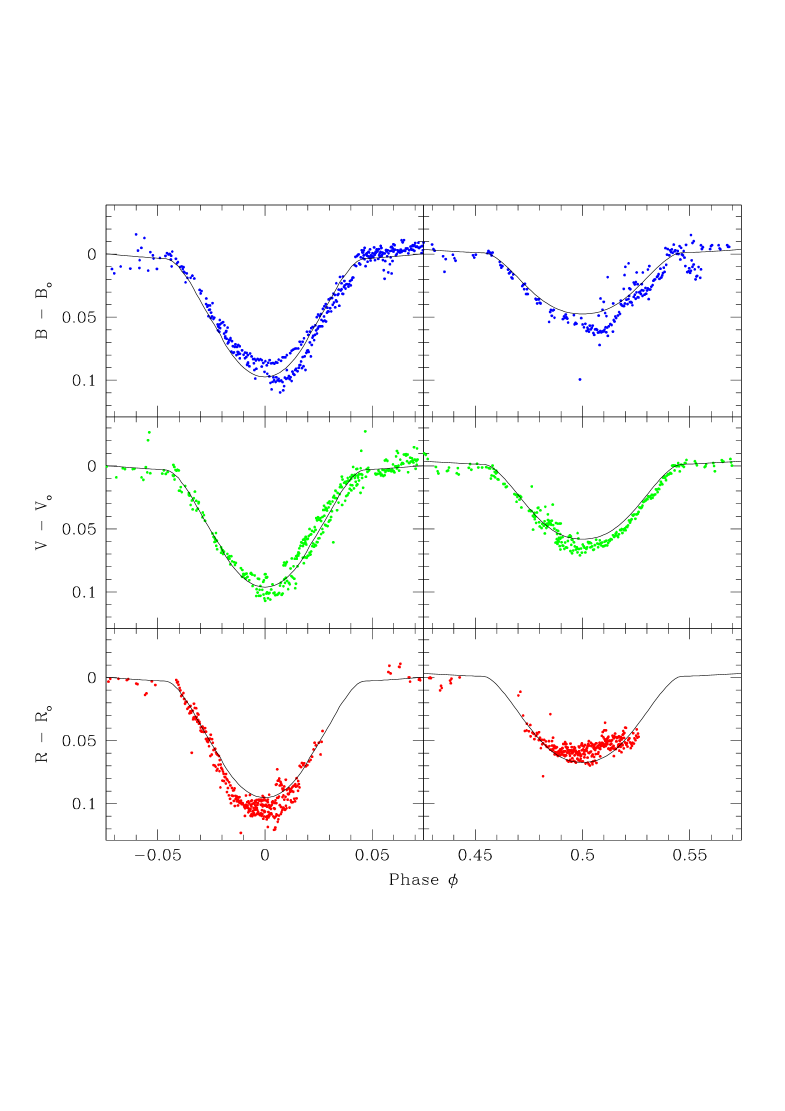
The depth of the primary eclipses are fairly consistent from filter to filter, but the secondary eclipse is deepest in () as shown in Fig. 1. The radial velocities (see §2.2) show that the cooler, less massive star is behind its companion at the time of secondary eclipse. Figures 2 and 3 show the photometry taken on individual nights of eclipse. Most importantly, the secondary eclipses show evidence of being flat at minimum (see HJDs 2455380, 2455742, and 2455756), suggesting the eclipses are total. This makes it easier to disentangle the amount of light contributed by each star.
The light curves often show variations that may be independent of the eclipses. While spots are not generally expected for stars with radiative envelopes, observations from the Kepler mission indicate that they do occur. Balona (2013) found evidence of activity among about 40% of A-type stars. The amplitude of the variations was most commonly in the tens of parts per million, but did occasionally reach mmag levels. Because the primary star is more than 3 mag brighter than the secondary star, an astrophysical source of variability almost certainly originated on the primary. However, longer term monitoring is needed to establish the nature of the variability.
2.2 Spectroscopy
Our spectra were obtained at the Hobby-Eberly Telescope (HET) with the High Resolution Spectrograph (HRS; Tull 1998) as part of normal queue-scheduled observing (Shetrone et al., 2007). The configuration of the HRS was chosen based upon the spectral line widths and strength of the secondary in the first spectrum taken of each object. KV29 was observed with a resolution , a fiber feed, and binning to approximately 2.7 pixels per resolution element. The configuration covers 4825 Å to 6750 Å with a small break at 5800 Å between the red and blue CCDs, although we used only the blue section of the spectra. Exposure times were between 480 and 700 s. The data were reduced using the echelle package within IRAF for fairly standard bias and scattered light removal, 1D spectrum extraction, and wavelength calibration.
We obtained a total of 17 spectra between May 2010 and September 2011. In two of these spectra, the lines were heavily blended (to the point that cross correlation peaks were fully blended) and two others had moderate blending. However, based on the width of the lines, the brighter star is clearly rotating more rapidly than the secondary, meaning that the spectral features of the secondary could be marginally identified in the spectra with the heaviest blending.
Our radial velocity measurement procedure made use of broadening functions (Rucinski, 1992, 2002) and spectral disentangling (González & Levato, 2006). Broadening functions (BFs) transform a sharp-lined spectrum into a broadened spectrum through a convolution, and they contain information on the Doppler shifting of the spectrum as well as broadening effects like rotation. BFs generally improve the measurement of Doppler shifts relative to cross correlation methods in the presence of substantial rotational broadening and overlapping spectral lines, and this is of great importance for a short-period binary like KV 29. We resampled to a common logarithmic wavelength spacing at approximately the same pixel resolution as the original spectra, and employed IDL routines provided publicly by S. Rucinski222http://www.astro.utoronto.ca/rucinski/SVDcookbook.html to derive the broadening function via singular value decomposition. We used different synthetic spectrum templates with temperatures and 8500 K for the two stars, but both having , and [Fe/H]. We fit the peaks in the BFs with rotational broadening profiles assuming 50 and 20 km s-1, allowing for a modest amount of variation around those values (15 and 4 km s-1, respectively). We found that restricting the analysis to wavelengths between 5000 and 5400 Å produced the clearest broadening functions because this range contained the strongest and best-measured spectral lines.
To determine precise radial velocities even for the spectra with the most heavily blended lines, we used spectral disentangling. Disentangling involves an iterative procedure of redetermining radial velocities and averaged spectra for each component of the binary repeatedly, with subtraction of the averaged spectrum of one star from each collected spectrum during the measurement of the radial velocities and averaged spectrum (shifted to the rest frame) of the other star. By removing the companion star’s spectrum as best we possibly can, we minimize systematic effects from line blending on the measured radial velocities. The technique works best when there are a sufficient number of spectra taken at different orbital phases with good velocity separation. In our case, we used the 9 spectra with the largest separation in the determination of the average spectra, and the iterations converged rapidly.
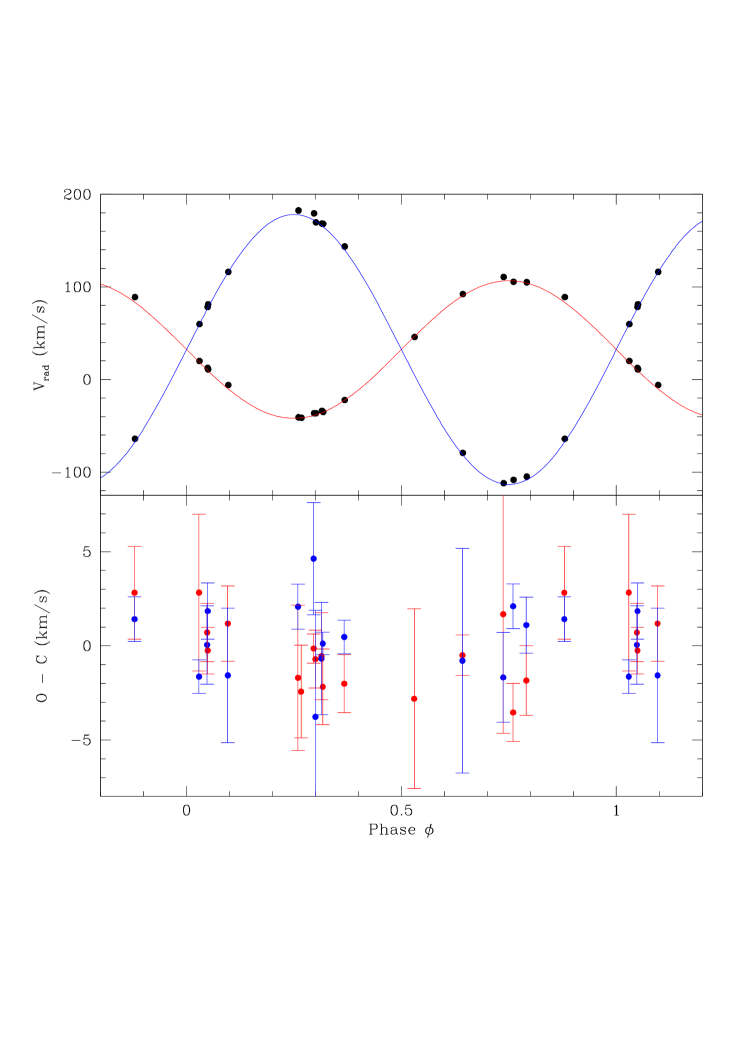
We corrected the measured values for heliocentric velocity and spectrograph zero-point offsets. Radial velocity standards were observed on most nights that the binary was, and the difference between the measurement and literature value was used as a zero-point correction for the eclipsing binary measurements. If a standard was not observed on the same night, the correction was determined by averaging measurements from nights nearest in time. From experience, the radial velocity corrections vary only slightly (by a few hundred m s-1) from night to night, but do vary significantly with instrument configuration and season. The final radial velocity values are given in Table 2 and plotted (along with an diagram) in Fig. 4.
By comparing synthetic spectra with the disentangled spectra, we derived constraints on the rotational velocities and temperatures of the two stars. We find temperatures of approximately 10000 and 7500 K, although we will hone our temperature estimates in the next section using photometry. In any case, the spectral types appear to be A0IV and A6V. (Before it reached the turnoff and evolved significantly, the primary probably had a spectral type of B9V.) We find rotation speeds of 46 and 18 km s-1 with uncertainties of approximately 4 and 2 km s-1, respectively. Based on these speeds and later determination of the stellar radii, both stars appear to be rotating approximately in synchronism with the orbit. This is somewhat surprising given that the primary star probably expanded by about a factor of two in the last 40 Myr as a result of its evolution. The rotation of the primary may be lagging behind synchronism slightly — further analysis of this system could place interesting constraints on tidal effects on the rotation.
3 Binary Star Modeling
In order to model the photometric and spectroscopic data of KV29, we used the ELC code (Orosz & Hauschildt, 2000), which employs a Markov chain Monte Carlo (Tegmark et al., 2004) algorithm to optimize the fit. Because the spectroscopic results indicate the binary orbit has zero eccentricity, some orbit parameters (namely the velocity semi-amplitude of the primary star , and the ratio of the stellar masses ) can be determined from spectroscopic velocities independent of the light curves. We therefore fitted the radial velocities first, searching for the minimum , while also examining models with alternate parameter sets in order to evaluate uncertainties. The uncertainties in the binary model parameters were derived from the range of parameter values that produce a total within 1 of the minimum value, which approximates a uncertainty (Avni, 1976). Because the velocity measurement uncertainties are used in the calculation of , it is important that these uncertainties be as realistic as possible. Usually measurement uncertainties calculated during the data reduction process are underestimated, which would inflate the total value and lead to an underestimation of the uncertainties in the binary star model parameters. With awareness of this, we scaled the uncertainty estimates of the radial velocities from the spectroscopic analysis (and later, the photometric measurements in each filter) upward to return a reduced value of 1 for each measured quantity in order to be consistent with the observed scatter around the best fit model. The results for and are tabulated in Table 3.
We then proceeded to light curve fitting. Because the degree of limb darkening has a significant effect on measured radii for systems like KV29 having shallow eclipses, we probed the potential systematic errors by fitting with different limb darkening descriptions. We first used a quadratic limb darkening law with coefficients taken from Claret & Bloemen (2011) and using PHOENIX model atmospheres (Hauschildt et al., 1997) to normalize the brightness from the centers of the visible star disks. The parameters we fit for were orbital period , time of conjunction (primary eclipse) , inclination , ratio of the stellar radii to average orbital separation and , and temperature ratio . , , and were held as external constraints. These observational constraints impose a penalty on models if the parameter values deviate from values determined earlier. The plot for the 6 parameters , , , , , and in this run (constant limb darkening coefficients) can be seen in Fig. 5. A model fit of the eclipses can be seen in Fig. 6.
We also conducted fits while allowing the limb darkening coefficients to vary, following the algorithm of Kipping (2013). Due to the scatter in the observed light curves, we examined the effects of using weighted average photometry for phase bins. (See Schiller & Milone 1988 for a similar usage for the short-period eclipsing binary DS Andromedae.) We used phase bins of 0.002 in and near eclipses (0.90 to 0.10 and 0.40 to 0.60) and 0.01 elsewhere. The uncertainty of each binned point was taken to be the error of the weighted mean. Results from both runs can be seen in Table 4, and some fitted quantities can be seen to deviate by several standard deviations (). The difference in the lightcurve shapes from filter to filter has made it difficult to fit for limb darkening coefficients, but the fitted parameters for the binned run mostly agree with those of the full data run. Although there are changes to the measured stellar radii depending on the method of fitting, it should be noted that these small differences negligibly affect our age determination in the next section because the primary star is in a phase of rapid radius evolution. The masses are more important for the age determination here, and the quantities , , from each model agree to less than .
Ellipsoidal variations are visible in the out-of-eclipse observations plotted in Fig. 1, suggesting that at least one of the stars is tidally distorted, in agreement with the expections for the short orbital period and evolved state of the primary star. The ELC code uses a Roche lobe geometry to model the non-spherical nature of the stars in the binary and its effects on the light curve. The Roche lobe filling factor for the primary star was calculated to be 0.470, much larger than that of the secondary at 0.176. Because the primary star is much brighter than the secondary star, almost all of the out-of-eclipse variation in the lightcurves is caused by the primary.
As mentioned before, we see that during the secondary eclipse the primary star is totally blocking the light of its companion. Because the primary star alone is visible then, the secondary eclipse depths allow us to disentangle the photometry of the two stars. We did this with two different methods. First, we carefully measured the secondary eclipse depths and used them to infer the brightness of the primary star. The following nights (in HJD) were used: 2455394, 2455401, 2455410, 2455417, 2455424, and 2455763 in , and 2455011, 2455380, 2455387, 2455410, 2455417, and 2455424 in . We took the average of the out-of-eclipse observations for a given night and subtracted it from the average of the points during totality. We found eclipse depths and . For stars with significant non-sphericity, the depths only provide upper limits to the luminosity ratio because we are looking down the long axis of an elongated star during the eclipses. We therefore derived luminosity ratios from ELC model fits to all of the light curve data (see Fig. 6). We found the for the luminosity ratios for each color in the fitted limb darkening run (Fig. 7) and used those to decompose the photometry of the stars. The ELC models yielded , , and , where the quoted uncertaintied are statistical. We have chosen to include a contribution to the uncertainty of 0.002 from systematic error resulting from variations in eclipse depths. The decomposed photometry for the two stars can be seen in Table 5.
Using the decomposed colors for both stars, we calculated photometric values using the transformation equations of Casagrande et al. (2010). For that purpose, we used a cluster reddening (Sung et al., 1999) and metallicity [Fe/H] (Gonzales & Wallerstein, 2000). By this method, was found to be K and K. This value for is roughly consistent with what can be derived from the value of and the temperature ratio derived from the fitted limb darkening run ( K). Uncertainties in the effective temperatures come from uncertainty in the reddening and metallicity, and in the temperature ratio provided by ELC. Abundance uncertainties (such as the difference between the Gonzales & Wallerstein spectroscopic results and the Beaver et al. (2014) determination of [Fe/H] using Strömgren photometry) have negligible effects ( K) on this calculation.
4 Discussion and Analysis
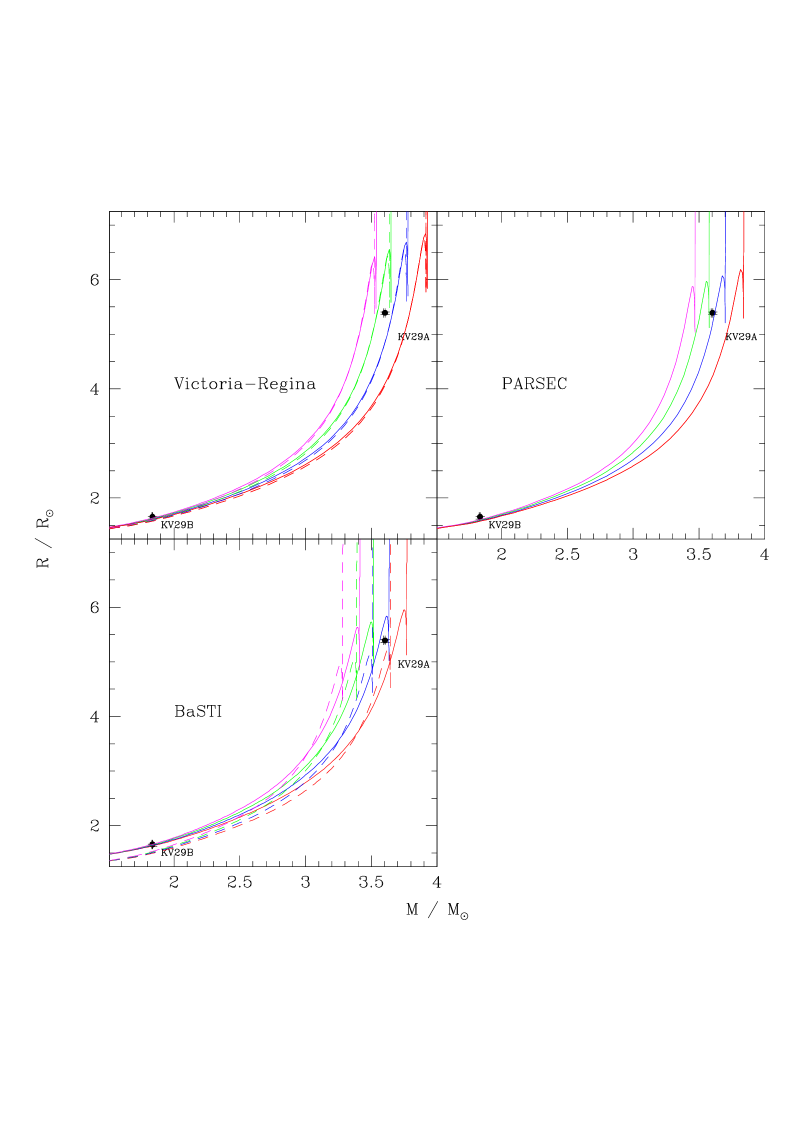
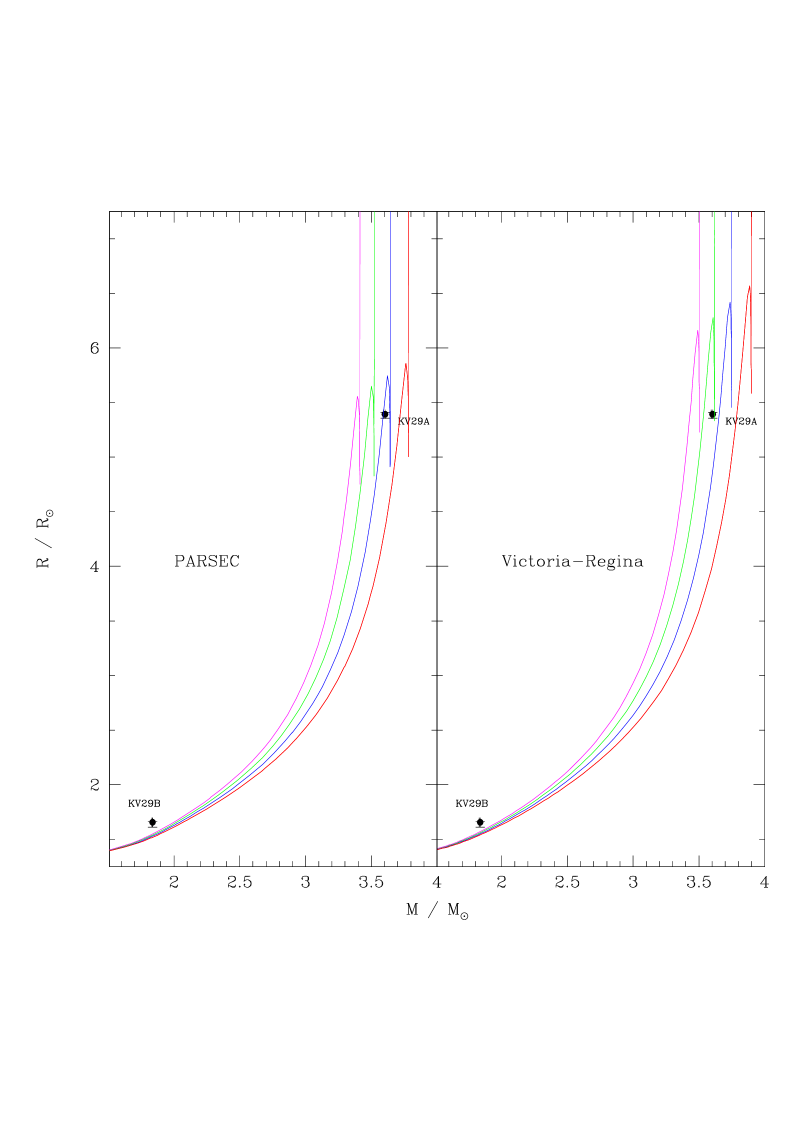
The radii of evolved stars can make excellent age indicators because they can be measured to high precision in eclipsing binary systems and their use avoids systematic errors that are commonly present in other indicators. However, the translation from stellar radius to age requires the use of theoretical mass-radius isochrones. Every isochrone set employs an assumed value for the heavy element content of the Sun () because it is not a directly measured quantity. Because the metallicity ([Fe/H], and therefore ) of other stars is judged relative to the Sun, this has a potentially significant effect on the age determination if the Sun’s metal content is systematically different from what is assumed. After a thorough re-examination of the solar abundance mix, Asplund et al. (2009) found , which is lower than most values assumed in models. If the Asplund et al. value is correct, we should select the heavy element abundance of the models based on the revised . Using this new value of and the Gonzales & Wallerstein (2000) spectroscopic [Fe/H] value, the M11 metal content should be . While the PARSEC models allow direct input of a particular value, we had to choose values as close as possible to that of M11 for the Victoria-Regina and BaSTI isochrone models. The PARSEC isochrones (Bressan et al., 2012) will be used as our primary theoretical isochrone set, with the Victoria-Regina (VandenBerg et al., 2006) and BaSTI (Pietrinferni et al., 2004) models as comparisons.
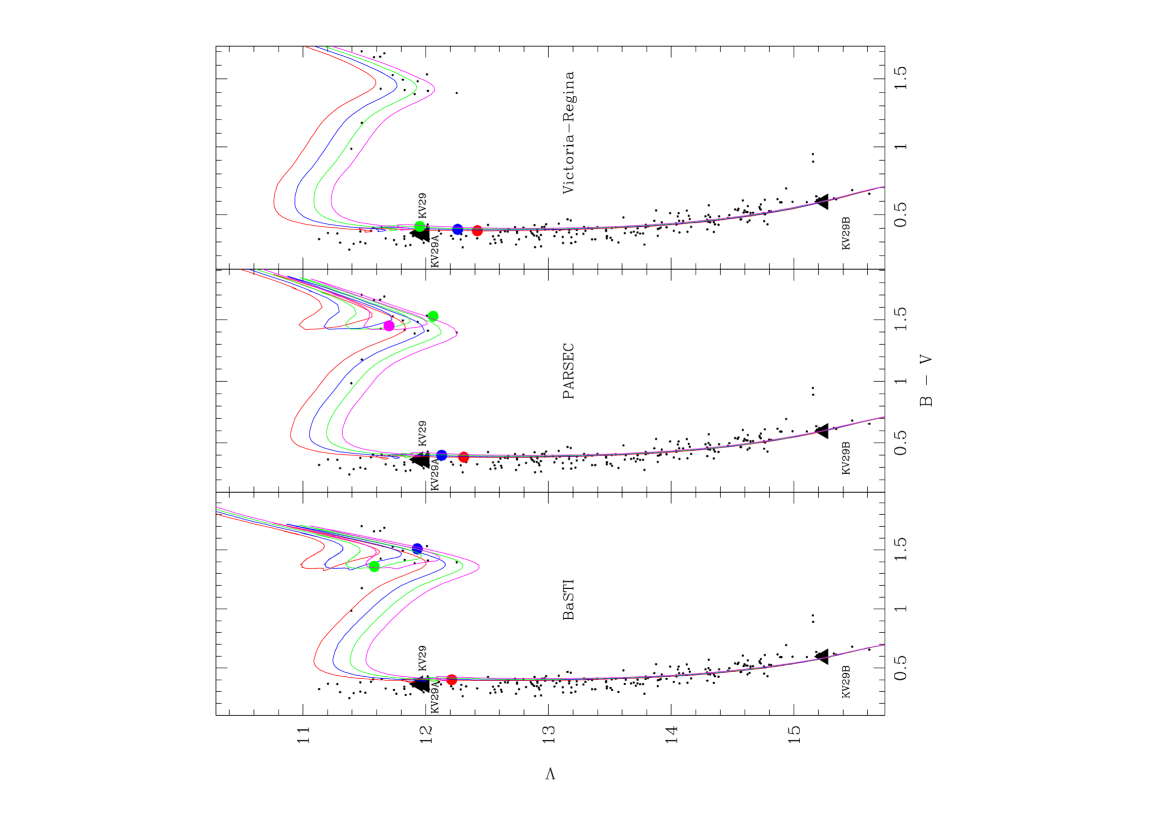
Fig. 8 contains comparisons with mass versus radius () isochrones. The uncertainty in KV29B’s radius encompasses all four isochrones depicted at its measured mass — it is not sensitive to age because it has not changed significantly in radius since the zero-age main sequence. While the fractional uncertainty in the radius for KV29A is larger than that of the mass (0.6% versus 0.3%), the uncertainty in the derived age is rather small because stellar radii increase quite rapidly near the turnoff, so that mass becomes the more important quantity for determining age. Using the mass and radius of KV29A, the PARSEC isochrones return an age for M11 of Myr. The first set of quoted uncertainties are from the statistical measurement uncertainties for the mass and radius, but systematic errors are currently a larger contributor to the age uncertainty at present. As discussed earlier, Beaver et al. (2014) determined a lower metallicity for M11 ([Fe/H]) using Strömgren photometry, and their [Fe/H] along with the Asplund et al. solar abundance implies . The lower metallicity PARSEC models yield a younger age of 221 Myr, and this is the basis of the quoted Myr uncertainty. The comparisons for lower metallicity isochrones in the PARSEC and Victoria-Regina sets are shown in Fig. 9. For the Victoria-Regina isochrones in Fig. 9, we displayed tracks for only, as it is very close to the target value of . The prefered still lies in the range chosen for the BaSTI model of Fig. 8, and shows a younger age near 215 Myr by the same method. We note that a higher value (possibly because the Asplund et al. 2009 value for is underestmated) would improve the agreement between the models and the combination for the secondary star and would increase the measured age.
Differences in the physics incorporated in different sets of model isochrones can also produce age uncertainties, and we estimate the size of these uncertainties by examining Victoria-Regina and BaSTI isochrones. Interpolating between the Victoria-Regina isochrones with and , we find an age near 235 Myr. Interpolating between BaSTI models with and , we find an age near 215 Myr. Based on these factors, we estimate a systematic error due to model physics of approximately Myr.
Previous work on M11 has derived ages between 250 and 320 Myr — almost a 30% range in ages. Our preferred age is approximately 9% lower than previously determined by Sung et al. (1999) but marginally consistent. The measurement uncertainty in the age is less than 4%, but it must be remembered that this is model dependent and rests on the validity of the chemical composition and physics used in the stellar models. One of the most important physics issues is convective core overshooting because it critically affects the amount of hydrogen that is burned during the main sequence phase — more overshooting brings more fuel into the core, delays core hydrogen exhaustion, and produces younger looking stars. BaSTI isochrones employ a larger amount of convective core overshooting than the other models (which affects core hydrogen exhaustion and the “kink” at the cluster turnoff in the isochrones in the CMD).
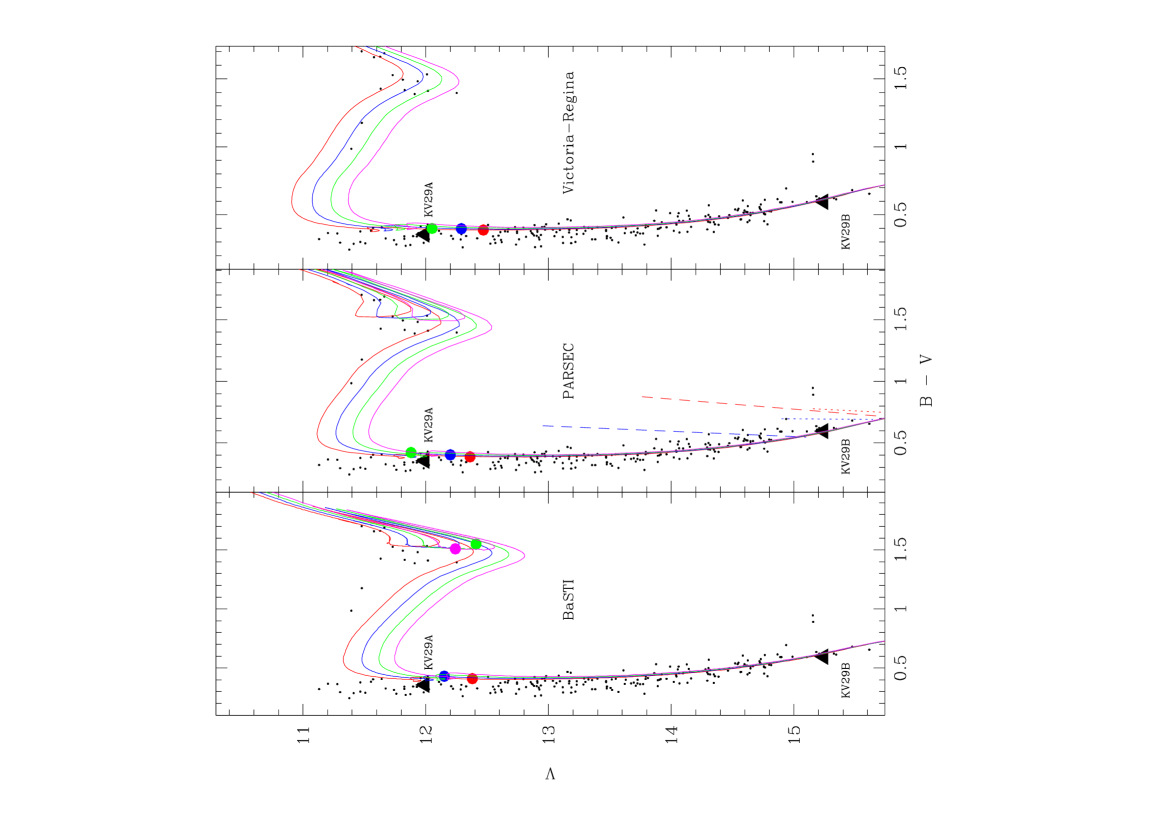
The primary reason there has been such a large amount of disagreement among earlier age studies is that there is little reason to prefer an age based on isochrone shape alone. With a combination of the masses and photometry we bring to bear here, it is unnecessary to fit isochrone shape. In Section 3.2, we derived the photometry for the two stars using the photometry for KV29 and luminosity ratios for each filter band from the binary star models. In Fig. 10, we plot each component on a CMD. The photometry for the CMDs was taken from Stetson (2000), and the stars chosen for the CMD are high probability members of M11 based on proper motions from McNamara et al. (1977). Each isochrone was shifted to match the secondary star’s mass and photometry simultaneously. The secondary star is an unevolved main sequence star, and its position should be relatively insensitive to physics in the stellar models. The primary star’s mass and photometry then constrain the cluster’s age, as do the CMD positions of upper main sequence stars. In Fig. 10, the predicted position of the primary star (given its measured mass) is marked as a circle matching the color of the isochrone for each age. (For some ages, a star with the primary’s mass would have already evolved off the main sequence, and is not visible in the figure.) Roughly speaking, each isochrone set predicts a CMD position for the primary star that is in rough agreement with what is expected from the diagrams discussed above.
For young clusters like M11, the lack of subgiant stars makes it difficult to precisely identify where the turnoff lies. None of the isochrone sets does a particularly good job of matching the characteristics of the upper main sequence, although an unidentified population of unresolved binaries there could be influencing that comparison. Binary stars on the main sequence obscure where single stars terminate in the CMD: the combined light of a brighter MS star at the turnoff with a fainter companion can displace an unresolved binary vertically in the CMD. The theoretical models all predict that there is a large acceleration in the rate of radius change at the cluster turnoff where there is a small kink in the CMD. However, there are seemingly main sequence stars brighter than this point in the CMD, as can be seen in Fig. 10. Based on the expectations for a rapid decrease in the evolutionary timescale after central hydrogen exhaustion and the observed lack of stars on the subgiant branch, there should be few or no stars on the main sequence brighter than this kink. This leads to the prediction that the stars brighter than KV29A will be found to be either blue stragglers or unidentified binaries after more detailed examination. The fact that the brightest of the main sequence stars is a little more than 0.75 mag brighter than KV29A provides some additional evidence that KV29A may be a star that is very close to central hydrogen exhaustion.
On a final note, the giant clump tends to be too bright in the PARSEC models compared to the observations. However, this is not necessarily a way of distinguishing between metallicities because of the effects that different physics (like convective mixing length) and color-temperature transformations can have.
There are several ways in which the isochrone comparisons can be improved with future work. Along with KV29, Koo et al. (2007) found two other detached binary candidates near the turnoff (KV35 and KV36), and there may be others. Characterization of systems like these will improve the precision of the age comparison and can also provide constraints on chemical composition variables like the difficult-to-measure helium abundance (Brogaard et al., 2011). Both systems are more challenging to analyze fully: KV35 has strong spot modulation in its light curve, and KV36 has a period very near 12 sidereal days. We currently have both systems under study, but new discoveries would help more clearly establish the cluster age by allowing us to check the fidelity of the isochrones and the physics that goes into them. In addition, radial velocity information on the brightest cluster members (e.g. Mathieu et al., 1986) would help clean the CMD of unresolved binaries that conceal the position of the cluster evolutionary sequence, especially at the bright end of the main sequence and subgiant branch. Cantat-Gaudin et al. (2014) presented radial velocities for a large sample of cluster stars, and find several stars brighter than KV29 that are radial velocity members, although these were not monitored for a long enough period to be certain that they are single. Stars that could be validated as single cluster members would produce a significant constraint on the age. Although there are cluster members with colors between the main sequence and red clump, the evidence so far is that these are binary stars. Two stars with and (identifiers MPS 926 and 1223 in McNamara et al. 1977) are single-lined spectroscopic binaries that each probably contain a giant and a main sequence star, while another (MPS 1364) has a velocity that is slightly offset from the cluster mean, possibly indicating binarity (Lee et al., 1989). We identified one other likely cluster member (MPS 670) that is closer to, but redder than, the main sequence and should be studied to identify whether it is a binary or a subgiant.
As a final task, we can calculate a luminosity for each star in KV29 using the photometric effective temperatures and radii from the binary analysis. With and K, the primary star has a luminosity of . The secondary star, with and K, has a luminosity of . Using a bolometric correction (; Flower 1996) along with and , we can compute the distance modulus . We find and from the primary star. Distance modulus calculations using the secondary star (; Flower 1996) give . In both cases, the uncertainty is dominated by the temperature uncertainty, but we have included contributions from the radius and bolometric corrections (probably at the level of a few centimag: for example, values from VandenBerg & Clem (2003) are and 0.02 for the two stars). So, the binary star measurements are very consistent with each other, giving a weighted average of . This is consistent with the dereddened distance modulus given by Sung et al. (1999) of if we use their reddening and a traditional extinction factor .
5 Conclusion
We have presented a study of the characteristics of the stars in the eclipsing binary KV29 that is a member of the open cluster M11 and is found at the cluster turnoff. The DEB follows a nearly circular orbit with a period of 4.6428 d, and it shows a total eclipse of the secondary star. The primary star is significantly evolved, possessing a radius that is significantly larger than a main sequence star of the same mass, which puts the star at the turnoff of the CMD for the cluster. We have derived an age of Myr for M11 using isochrone models with the most up-to-date physics inputs with uncertainties stemming from errors in the calculated masses and radii, and the systematic uncertainities from the metallicity of the open cluster and differences in the physics used in different isochrone models. We have also determined a distance modulus , incorporating uncertainties in the extinction, metallicity, and temperature.
The stars in the binary appear to be rotating close to synchronism, despite the relatively rapid radius evolution of the primary about over the last . The binary appears to have fairly strong tidal interactions now, and is clearly destined for strong interactions in the near future. Models indicate that the primary star will expand up to over the next 15 Myr. After a short contraction back to near its present size, it will rapidly expand and overflow its Roche lobe shortly after beginning to transit the Hertzsprung gap on a thermal timescale. Strong mass transfer will be aided by shrinkage of the orbital separation and of the primary’s Roche lobe, and will make it impossible for the lower-mass secondary star to accomodate the donated gas, leading to a contact phase. After the system’s mass ratio has been reversed, the current primary star will eventually complete its mass transfer, and the system will be fairly quiescent until the current secondary star evolves and expands and starts an Algol mass-transfer phase in the system.
The light curves for KV29 showed significant amounts of variation, making it challenging to precisely determine the radii of the two components. We binned the lightcurves in phase in order to smooth these variations. We find uncertainties in the primary and secondary radii of 0.6% and 2.7%, respectively. In spite of these errors, the age uncertainty is rather low due to the evolved nature of the primary star. The age of the primary is very sensitive to the value of its mass (Southworth et al., 2004), and as a result we have improved the precision of the cluster age over CMD-based methods that are subject to more substantial systematic errors related to interstellar extinction. Our age determination is lower than all previous CMD-based determinations, and has considerably higher precision.
With the precision of M11’s age, it can be put confidently in perspective relative to other clusters, and this allows calibration of other age indicators. Stellar rotation (Barnes, 2007) is an important age indicator because it can potentially be applied to individual field stars and it retains sensitivity to age on the main sequence when many other characteristics of stars are changing minimally. The primary limitation of gyrochronology is the need for calibrators of known age, and open clusters like M11 provide that. When the calibrating clusters have precisely known ages, there is no ambiguity as to the relative ages of different clusters. With an age uncertainty of a few percent, the rotation periods measured for M11 stars (Messina et al., 2010) as a function of mass (or rather, its proxy, color) can be reliably compared with clusters of similar age like M35 (Meibom et al., 2009), M34 (Meibom et al., 2011), and M37 (Messina et al., 2008).
The photometry of the secondary star in the eclipsing binary appears to put it in the instability strip where it crosses the main sequence. This part of the instability strip is inhabited by Scuti and Doradus pulsating stars, and more than a dozen Sct stars have previously been detected via their photometric variability (Hargis et al., 2005; Koo et al., 2007; Lee et al., 2010). Seven Sct are likely cluster members according to proper motions (McNamara et al., 1977), but these are likely to be just the stars with the highest pulsation amplitudes. With higher precision photometry, the pulsation characteristics of the stars in this cluster ensemble may enable an independent determination of the cluster distance modulus. The measured mass of the secondary star could also help directly constrain the properties of the pulsators in M11 and produce stronger tests of how well we understand their pulsation spectra.
The measurement precision on the characteristics of KV29 will improve with additional spectroscopic and photometric eclipse observations that allow us to reduce the influence of the observed variability in the light curve shape. Improved determination of the effective temperatures would improve the distance modulus and the spectral typing of both components, and would have some effect on the eclipse modelling through the limb darkening prescription. Photometric data in additional colors (like band) and improved spectroscopic constraints would improve this. As mentioned before, we are in the process of investigating other DEBs in M11 that are known to display eclipses. With the high-precision study of multiple eclipsing systems in the cluster, we will be able to statistically hone the cluster age.
References
- Alard (2000) Alard, C. 2000, A&AS, 144, 363
- Asplund et al. (2009) Asplund, M., Grevesse, N., Sauval, A.J., Scott, P. 2009, ARA&A, 47, 481
- Avni (1976) Avni, Y. 1976, ApJ, 210, 642
- Balona (2013) Balona, L. A. 2013, MNRAS, 431, 2240
- Barnes (2007) Barnes, S. A. 2007, ApJ, 669, 1167
- Beaver et al. (2014) Beaver, J., Kaltcheva N., Briley M., & Piehl D. 2014, PASP, 125, 934
- Bressan et al. (2012) Bressan, A., Marigo, P., Girardi, L., Salasnich, B., Dal Cero, C., Rubele, S., & Nanni, A. 2012, MNRAS, 427, 127
- Brogaard et al. (2011) Brogaard, K., Bruntt, H., Grundahl, F., et al. 2011, A&A, 525, A2
- Cantat-Gaudin et al. (2014) Cantat-Gaudin, T., Vallenari, A., Zaggia, S., et al. 2014, A&A, 569, A17
- Casagrande et al. (2010) Casagrande, L., Ramirez, I., Melendez, J., Bessell, M., & Asplund, M., 2010, A&A, 512, A54
- Charbonneau (1995) Charbonneau, P. 1995, ApJS, 101, 309
- Claret & Bloemen (2011) Claret, A. & Bloemen, S. 2011, A&A, 529, 75
- Flower (1996) Flower, P.J. 1996, ApJ, 469, 355
- Gonzales & Wallerstein (2000) Gonzales, G. & Wallerstein, G., 2000, PASP, 112, 1081
- González & Levato (2006) González, J. F., & Levato, H. 2006, A&A, 448, 283
- Hargis et al. (2005) Hargis, J. R., Sandquist, E. L., & Bradstreet, D. H. 2005, AJ, 130, 2824 (HSB05)
- Hartman et al. (2004) Hartman, J. D., Bakos, G., Stanek, K. Z., & Noyes, R. W. 2004, AJ, 128, 1761
- Hauschildt et al. (1997) Hauschildt, P. H., Baron, E., & Allard, F. 1997, ApJ, 483, 390
- Hinkle et al. (2000) Hinkel, K., Wallace, L., Harmer, D., Ayres, T., & Valenti, J. 2000, IAU Meeting 24, Joint Discussion 1, Atomic and Molecular Data for Astrophysics: New Developments, Case Studies, and Future Needs
- Honeycutt (1992) Honeycutt, R. K. 1992, PASP, 104, 435
- Kipping (2013) Kipping, D. M. 2013, MNRAS, 435, 2152
- Koo et al. (2007) Koo, J.R., Kim, S.L., Rey, S.C., Lee, C.U., Kim, Y.H., Kang, Y.B., & Jeon, Y.B., 2007, MNRAS, 119, 1233
- Lee et al. (2010) Lee, C.-U., Koo, J.-R., Kim, S.-L., et al. 2010, Journal of Astronomy and Space Sciences, 27, 289
- Lee et al. (1989) Lee, C. W., Mathieu, R. D., & Latham, D. W. 1989, AJ, 97, 1710
- Lindblad (1922) Lindblad, B. 1922, ApJ, 55, 85
- Mathieu et al. (1986) Mathieu, R. D., Latham, D. W., Griffin, R. F., & Gunn, J. E. 1986, AJ, 92, 1100
- McNamara et al. (1977) McNamara, B. J., Pratt, N. M., & Sanders, W. L. 1977, A&AS, 27, 117
- Meibom et al. (2009) Meibom, S., Mathieu, R. D., & Stassun, K. G. 2009, ApJ, 695, 679
- Meibom et al. (2011) Meibom, S., Mathieu, R. D., Stassun, K. G., Liebesny, P., & Saar, S. H. 2011, ApJ, 733, 115
- Messina et al. (2008) Messina, S., Distefano, E., Parihar, P., et al. 2008, A&A, 483, 253
- Messina et al. (2010) Messina, S., Parihar, P., Koo, J.-R., et al. 2010, A&A, 513, A29
- Metcalfe (1999) Metcalfe, T. S. 1999, AJ, 117, 2503
- Orosz & Hauschildt (2000) Orosz, J.A. & Hauschildt, P.H. 2000, A&A, 364, 265
- Orosz et al. (2002) Orosz, J. A., Groot, P. J., van der Klis, M., et al. 2002, ApJ, 568, 845
- Pietrinferni et al. (2004) Pietrinferni, A., Cassisi, S., Salaris, M., & Castelli, F. 2004, AJ, 612, 168
- Rucinski (1992) Rucinski, S. M. 1992, AJ, 104, 1968
- Rucinski (2002) Rucinski, S. M. 2002, AJ, 124, 1746
- Sandquist et al. (2003) Sandquist, E. L., Latham, D. W., Shetrone, M. D., & Milone, A. A. E. 2003, AJ, 125, 810
- Santos et al. (2012) Santos, N. C., Lovis, C., Melendez, J., et al. 2012, A&A, 538, A151
- Shetrone et al. (2007) Shetrone, M., et al. 2007, PASP, 119, 556
- Schiller & Milone (1988) Schiller S.J. & Milone E.F., 1988, AJ, 95, 5
- Southworth et al. (2004) Southworth, J., Zucker, S., Maxted, P.F.L., & Smalley, B., 2004, MNRAS, 355, 986
- Stetson (1987) Stetson, P. B. 1987, PASP, 99, 191
- Stetson (2000) Stetson, P. B, 2000, PASP, 112, 925
- Sung et al. (1999) Sung, H., Bessell, M.S., Lee, H.W., Kang, Y.H., & Lee, S.W., 1999, MNRAS, 310, 982
- Tegmark et al. (2004) Tegmark, M., Strauss, M. A., Blanton, M. R., et al. 2004, Phys. Rev. D, 69, 103501
- Tull (1998) Tull, R.G. 1998, Proc. SPIE, 3355, 387
- Uytterhoeven et al. (2011) Uytterhoeven, K., Moya, A., Grigahcène, A., et al. 2011, A&A, 534, A125
- Van Hamme (1993) Van Hamme, W. 1993, AJ, 106, 2096
- VandenBerg et al. (2006) VandenBerg, D. A., Bergbusch, P. A., & Dowler, P. D. 2006, ApJS, 162, 375
- VandenBerg & Clem (2003) VandenBerg, D. A., & Clem, J. L. 2003, AJ, 126, 778
- Wilson (1990) Wilson, R.E. 1990, ApJ, 356, 613


| Civil Date | HJD | |||
|---|---|---|---|---|
| 28 June 2009 | 5011 | 131 | ||
| 29 June 2009 | 5012 | 83 | ||
| 30 June 2009 | 5013 | 48 | ||
| 1 June 2010 | 5349 | 111 | ||
| 2 June 2010 | 5350 | 114 | ||
| 10 June 2010 | 5358 | 111 | ||
| 17 June 2010 | 5365 | 124 | ||
| 25 June 2010 | 5373 | 21 | ||
| 2 July 2010 | 5380 | 146 | ||
| 9 July 2010 | 5387 | 104 | ||
| 16 July 2010 | 5394 | 130 | ||
| 23 July 2010 | 5401 | 133 | ||
| 30 July 2010 | 5408 | 22 | ||
| 1 August 2010 | 5410 | 42 | 45 | |
| 8 August 2010 | 5417 | 52 | 52 | |
| 15 August 2010 | 5424 | 41 | 42 | |
| 18 August 2010 | 5427 | 27 | ||
| 1 September 2010 | 5441 | 24 | 24 | |
| 6 September 2010 | 5446 | 23 | 23 | |
| 7 September 2010 | 5447 | 21 | 20 | |
| 10 September 2010 | 5450 | 14 | 15 | |
| 14 September 2010 | 5454 | 21 | 21 | 19 |
| 17 September 2010 | 5457 | 17 | 17 | 17 |
| 19 September 2010 | 5459 | 82 | ||
| 21 September 2010 | 5461 | 11 | 14 | 15 |
| 26 September 2010 | 5466 | 74 | ||
| 27 May 2011 | 5709 | 60 | ||
| 22 June 2011 | 5735 | 150 | ||
| 29 June 2011 | 5742 | 79 | ||
| 6 July 2011 | 5749 | 151 | ||
| 13 July 2011 | 5756 | 147 | ||
| 20 July 2011 | 5763 | 83 | ||
| 7 August 2011 | 5781 | 40 | ||
| 13 August 2011 | 5787 | 37 | 36 | 34 |
| 18 August 2011 | 5792 | 25 | 26 | |
| 27 May 2013 | 6439 | 59 |
| UT Date | HJD | Phase | (km s-1)aaErrors are scaled to return a reduced | (km s-1)aaErrors are scaled to return a reduced |
|---|---|---|---|---|
| 6 May 2010 | 5322.9402 | 0.049 | ||
| 6 May 2010 | 5322.9461 | 0.050 | ||
| 15 June 2010 | 5362.8405 | 0.643 | ||
| 25 June 2010 | 5372.8164 | 0.792 | ||
| 28 July 2010 | 5405.7272 | 0.880 | ||
| 1 August 2010 | 5409.7096 | 0.738 | ||
| 13 August 2010 | 5421.6892 | 0.318 | ||
| 5 September 2010 | 5444.6364 | 0.261 | ||
| 12 September 2010 | 5451.6024 | 0.761 | ||
| 19 September 2010 | 5458.5978 | 0.268 | - | |
| 24 August 2011 | 5797.6628 | 0.297 | ||
| 29 August 2011 | 5802.6365 | 0.368 | ||
| 7 September 2011 | 5811.6120 | 0.301 | ||
| 20 September 2011 | 5824.5937 | 0.097 | ||
| 21 September 2011 | 5825.6048 | 0.315 | ||
| 22 September 2011 | 5826.6063 | 0.531 | - | |
| 29 September 2011 | 5833.5679 | 0.030 |
| Parameter | Value |
|---|---|
| (km s-1) | |
| (K) | |
| (km s-1) | |
| 0.2710 | |
| 0.4228 | |
| 0.3504 | |
| 0.3981 | |
| 0.2159 | |
| 0.3824 | |
| 0.2765 | |
| 0.3764 | |
| 0.1634 | |
| 0.3416 | |
| 0.1947 | |
| 0.1241 |
| Parameter | Constant LD aaUsed all photometry. Prefered fit. | Fitted LDbbUsed phase-binned light curves. |
|---|---|---|
| () | ||
| (d) | ||
| (HJD) | ||
| log (cgs) | ||
| log (cgs) | ||
| () | ||
| () | ||
| (km s-1)ccCalculated assuming synchronous rotation. | ||
| (km s-1)ccCalculated assuming synchronous rotation. |