The History of GRB Outflows: Ejection Lorentz Factor and Radiation Location of X-ray Flares
Abstract
We present time-resolved spectral analysis of the steep decay segments of 29 bright X-ray flares of gamma-ray bursts (GRBs) observed with the Swift/X-ray telescope, and model their lightcurves and spectral index evolution behaviors with the curvature effect model. Our results show that the observed rapid flux decay and strong spectral index evolution with time can be well fit with this model, and the derived characteristic timescales () are in the range of seconds. Using an empirical relation between the peak luminosity and the Lorentz factor derived from the prompt gamma-rays, we estimate the Lorentz factors of the flares (). We obtain with a median value of , which is smaller than the initial Lorentz factors of prompt gamma-ray fireballs. With the derived and , we constrain the radiating regions of 13 X-ray flares, yielding cm, which are smaller than the radii of the afterglow fireballs at the peak times of the flares. A long evolution feature from prompt gamma-ray phase to the X-ray epoch is found by incorporating our results with a sample of GRBs whose initial Lorentz factors are available in literatures, i.e., . These results may shed lights on the long term evolution of GRB central engines.
1 Introduction
Gamma-ray bursts (GRBs) are the most extreme explosive events in the universe. The duration of the prompt gamma-rays ranges from milliseconds to thousands of seconds (Kouveliotou et al., 1993), and afterglows following the prompt gamma-ray phase were found in the X-ray, optical, and radio bands. It is generally believed that the prompt gamma-rays are from internal shocks of collisions among fireball shells and the afterglows are from external shocks when the fireball shells propagate into the circum medium (e.g., Mészáros & Rees, 1993; Rees & Mészáros, 1994; Mészáros & Rees, 1997; Piran, 2004; Zhang & Mészáros, 2004). With promptly slewing capacity, the X-ray telescope (XRT) onboard the Swift mission observed erratic flares during the prompt gamma-ray phase and even up to several days post the GRB trigger (e.g., Burrows et al., 2005; Zhang et al., 2006; Nousek et al., 2006; O’Brien et al., 2006; Falcone et al., 2006; Falcone et al., 2007; Chincarini et al., 2007; Chincarini et al., 2010). These flares are found to be internal origin and they sinal the restart of the GRB central engine after the prompt gamma-rays (e.g., Burrows et al., 2005; Fan & Wei, 2005; Zhang et al., 2006; Dai et al., 2006; Proga & Zhang, 2006; Perna et al., 2006; Romano et al., 2006; Liang et al., 2006; Wu et al., 2006 ; Margutti et al., 2010; Maxham & Zhang, 2009)111Alternatively, Hascoet et al. (2015) suggested that X-ray flares may be produced by the long-lived reverse shock when it crosses the tail of the GRB ejecta. Although this scenario may produce the observed temporal feature of the flares, it seems to be difficult in explaining the observed strong spectral variation in the flares (e.g., Butler& Kocevski, 2007).. Taking these flares into account, the duration of the GRB central engines are much longer than the duration of the prompt gamma-rays (Qin et al., 2013; Virgili et al., 2013; Levan et al., 2014; Zhang et al., 2014).
X-ray flares are one of the most powerful diagnostic tools for the GRB central engines, especially their long term evolution behaviors (e.g., Dai et al., 2006). The radiation region and the bulk Lorentz factor of fireballs for early prompt gamma-rays and late X-ray flares are of great theoretical interest. Although it is still quite uncertain, the radiation region of the prompt gamma-rays is generally believed to be around cm and the fireballs are ultra-relativistic with a Lorentz factor () being greater than 100 (e.g., Mészáros & Rees, 1993; Rees & Mészáros, 1994; Piran, 2004; Zhang & Mészáros, 2004). With the deceleration timescale observed in the afterglow lightcurves, the derived values are usually in the range from 100 to 1000 (Sari & Piran, 1999; Kobayashi & Zhang, 2007; Molinari et al., 2007), and they are tightly correlated with the isotropic gamma-ray energy () and luminosity () of the prompt gamma-rays ( relation; Liang et al. 2010, 2013; Lü et al., 2012). Furthermore, Liang et al. (2015) discovered a tight relation, where is the peak energy of the spectrum of prompt gamma-rays in the burst frame. The value of may be also estimated with the high energy cutoff in the prompt gamma-ray spectrum based on “compactness” argument (Fenimore et al., 1993; Woods & Loeb, 1995; Baring & Harding, 1997; Lithwick & Sari, 2001; Gupta & Zhang, 2008). More recently, Tang et al. (2014) systematically searched for such a high energy spectral cutoff/break in GRBs observed with Fermi/LAT. They estimated the values for 9 GRBs with the observed cutoffs by assuming that these cutoffs are caused by pair-production absorption within the sources. They found values are also larger than 100, and confirmed the relation. For late X-ray flares, the Lorentz factor () was suggested to be smaller than that of the fireballs producing the prompt gamma-rays (e.g., Fan & Wei, 2005; c.f. Burrows et al. 2005). With the thermal emission observed in X-ray flares, Peng et al. (2014) obtained being around . The curvature effect, which is due to the observer receiving the progressively delayed emission from higher latitudes (Fenimore et al., 1996;Kumar & Panaitescu, 2000; Qin, 2002; Dermer, 2004; Uhm & Zhang, 2014), may present tight constraint on the emission region and its Lorentz factor of X-ray flares (e.g., Zhang et al., 2006; Lazzati & Begelman, 2006). Jin et al. (2010) estimated with both the thermal emission in the flares and the curvature effect on the decay phases of the flares and found that ranges around tens. The radiation regions of the X-ray flares () are even more poorly known. Troja et al. (2014) analyzed the flares with peaking time at seconds post the GRB trigger. They showed that cm with in the framework of internal shock model if the variability timescale is significantly shorter than the observed flare duration.
As mentioned above, the origin of the flares may be the same as that of prompt gamma-rays. One may estimate by assuming that the flares follow the same relation. Further more, it is believed that the steep decay observed in the X-ray flares is due to the curvature effect (Fan & Wei 2005; Dyks et al., 2005; Liang et al., 2006; Zhang et al., 2006; Panaitescu et al. 2006; Wu et al., 2006; Zhang et al., 2007; Zhang et al., 2009; Qin, 2008; c.f., Hascoët et al. 2015). This paper dedicates to study and of X-ray flares based the relation and the curvature effect on the X-ray flare tails. We select a sample of 29 bright X-ray flares (§2) and fit the lightcurve and the evolving spectral index during the steep decay phases of these X-ray flares based on our curvature effect model (§3). We constrain and values based on our fitting results in §4. Conclusions and discussions are presented in §5. Notation in cgs units are adopted.
2 Sample and Data Analysis
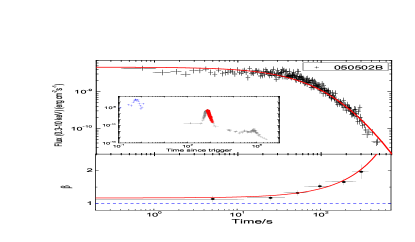
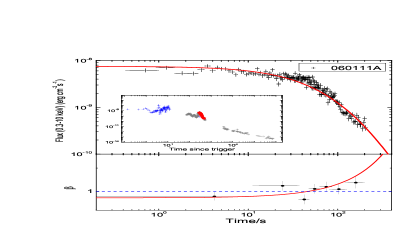
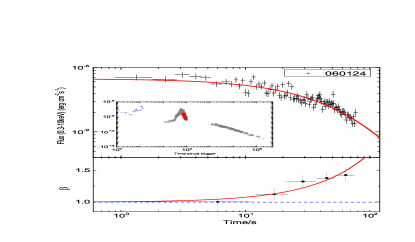
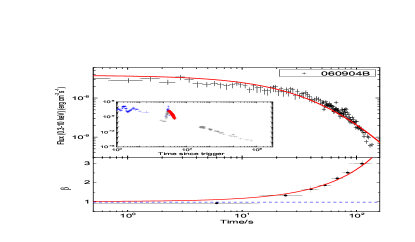
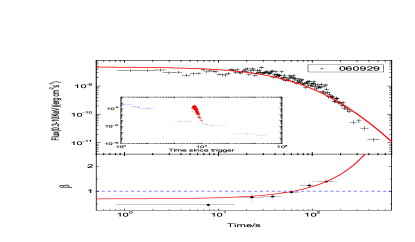
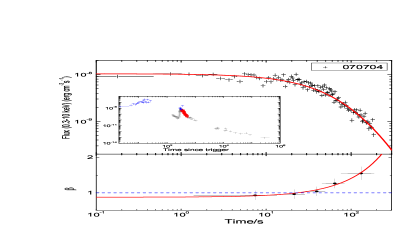
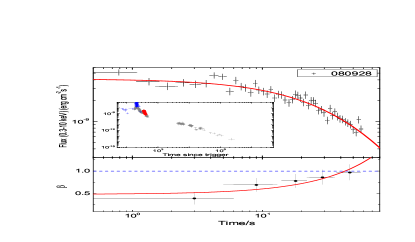
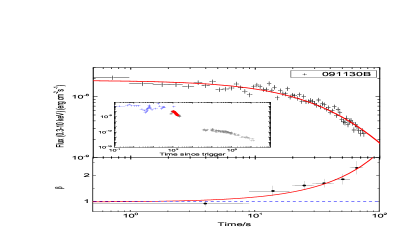
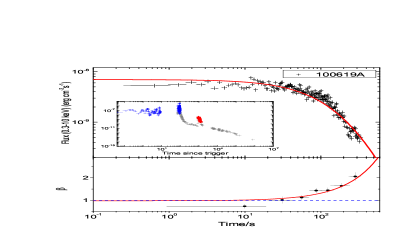
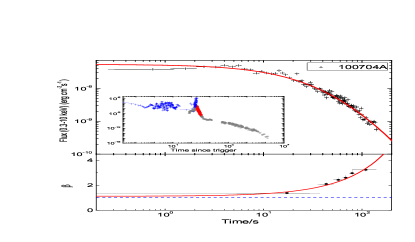
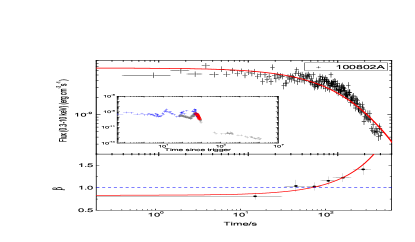
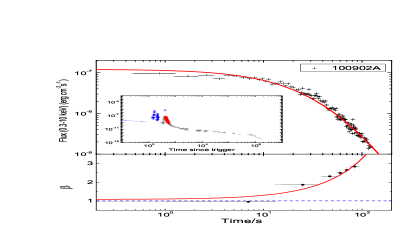
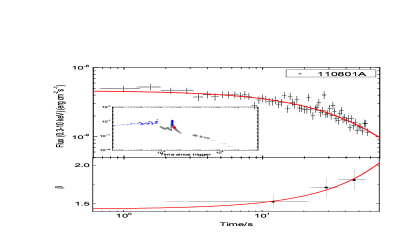
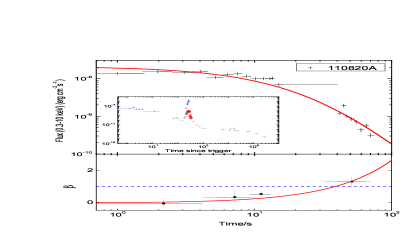
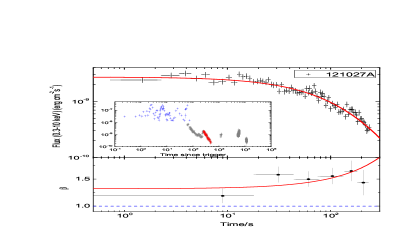
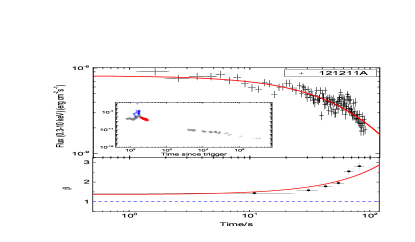
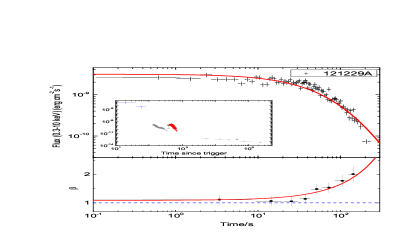
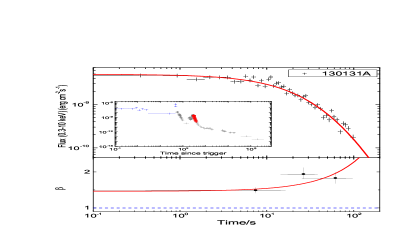
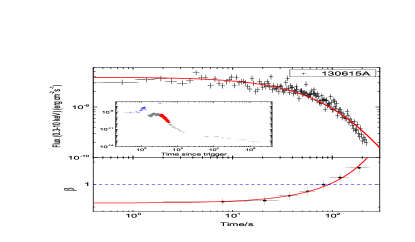
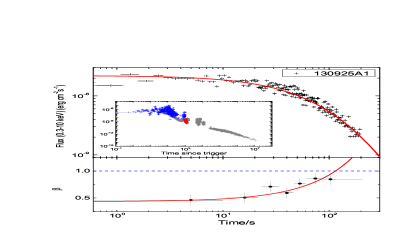
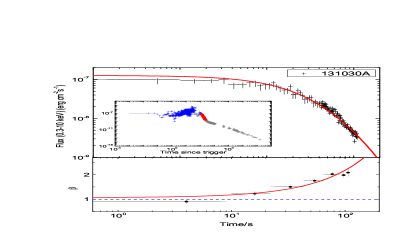
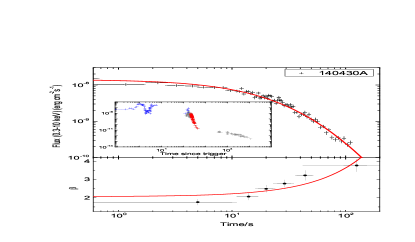
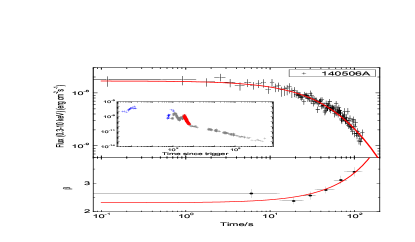
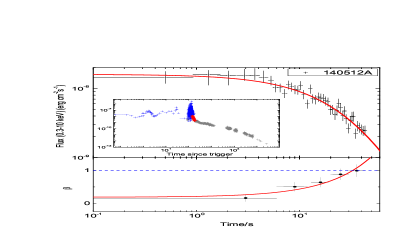
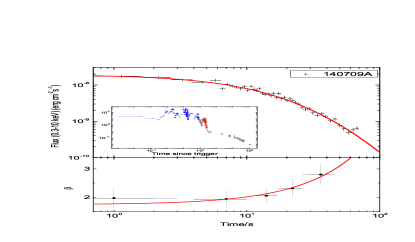
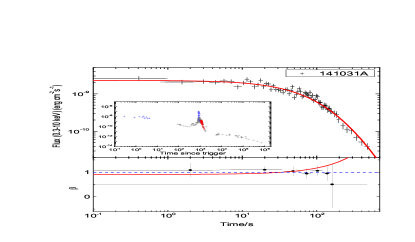
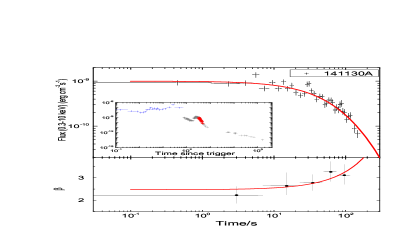
We present an extensive temporal and spectral analysis for the X-ray flares observed with Swift/XRT during 10 observation years (from 2005 to 2014). The XRT lightcurve data are downloaded from the website http://www.swift.ac.uk/ (Evans et al., 2009) and fitted with a multi-component model composing of single power-law and broken power-law functions. This analysis focuses on the steep decay segments of the flares only. We obtain a sample of 29 X-ray flares which satisfy the following criteria. First, they are bright with , where and are the peak flux of the flares and the flux of the underlying afterglow component. Second, the decay segments of the flares clearly decline without superimposing other flares or significant fluctuations. The time-resolved spectral analysis for the steep decay segments of flares are made with an absorbed single power-law model, i.e., and with known redshift and unknown redshift, where “wabs” and “zwabs” are the photoelectric absorbtion of both our Galaxy and GRB host galaxies, respectively. Since the gas-to-dust ratio of GRB host galaxies are very uncertain (Starling et al., 2007; Li et al., 2008; Schady et al., 2012), we ignore the dust scattering effect in calculation of values and adopt the same absorbtion model as that of our Galaxy for the GRB host galaxies at redshift . We derive the value of the host galaxy from the X-ray afterglow data for a given burst and make the time-resolved spectral analysis by keeping this value as a constant. The spectral analysis results are reported in Table 1. The evolution of the spectral index with time is also shown in Figure 1, where the peak time of the X-ray flare is set as the beginning time () of the steep decay segment for our analysis.
3 Modeling the Steep Decay Segments in the Curvature Effect Scenario
As mentioned in §1, the steep decaying segment of the flares with a slope would be due to the curvature effect, where is the power-law index of the radiation spectrum (e.g., Fenimore et al., 1996; Kumar & Panaitescu, 2000; Dermer, 2004; Liang et al., 2006; Zhang et al., 2007). The curvature effect is a combination of the time delay and the Doppler shifting of the intrinsic spectrum for high latitude emission with respect to that in the light of sight. The time delay of photons from radius and latitude angle with respect to those from and is given by
| (1) |
where is the redshift of the studied source and is the speed of light. For a relativistic moving jet with a Lorentz factor , the comoving emission frequency is boosted to in the observer s frame, where is the Doppler factor described as
| (2) |
where is the jet velocity, and is a characteristic timescale of the curvature effect, which is
| (3) |
In case of a single power-law radiation spectrum, the observed spectral index would do not evolve with time (e.g., Fenimore et al. 1996; Dermer et al. 2004; Liang et al. 2006). The observed significant spectral softening as shown in Figure 1 would be due to the curvature effect on a curved radiation spectrum (e.g., Zhang et al. 2007; 2009). Following Zhang et al. (2009), we fit the lightcurves and the spectral evolution features of the steep decay segments in our sample in the curvature effect scenario. We take the intrinsic radiation spectrum as a cut-off power-law parameterized as (Zhang et al. 2009) 222The choice of this function was also due to the fact that the spectral evolution of some GRB tails can be fitted by such an empirical model (Campana et al. 2006; Zhang et al. 2007; Yonetoku et al. 2008).,
| (4) |
where is the photon index and is the cut-off energy. Parameter measures the steepness of the spectrum at , as shown in Figure 2. We normally take in this analysis. Zhang et al. (2009) showed that such an intrinsic radiation spectrum can present the observed spectral index and flux evolution behaviors of GRB 050814 with the curvature effect model. The observed flux at photon energy then can be calculated with , i.e.,
| (5) |
where and are the observed on-axis flux and cut-off photon energy (corresponding to ), respectively. The observed flux in the XRT band then can be given by
| (6) |
We simply calculate the observed spectral index in the XRT band at with
| (7) |
We make jointed fits to the lightcurves and evolution with Eqs. (6) and (7). The peak time of flares is set as the zero time in these equations 333Note that our fits by setting as a free parameter may lead to unreasonable results being due to the degeneracy of and in our model. Liang et al. (2006) showed that the values are in the rising segment of the corresponding pulses or flares. Since the flux of flares usually rapidly increase in the rising segment, we simply set the zero time of the flares at the peak times in this analysis.. The goodness of our fits is evaluated with the total reduced by weighting the data points between that in the lightcurves and in the spectral evolution. The total value is given by , where subscripts “LC” and “” indicate the lightcurves and the evolution curves. We minimize in our fits.
Only 13 GRBs in our sample have redshift measurement. Our fit curves are displayed in Figure 1, and the model parameters, including , , , and , are reported in Table 2. One can observed that our model can represent the observed flux decay and spectral index evolution in these flares. The values range from to seconds, as shown in Figure 3.
4 The Lorentz Factor and Radiation Location of X-Ray Flares
As shown in Eq. (3), one may estimate or with the derived if one of them is available by another way. By deriving with a tentative jet break, Jin et al. (2010) got for GRBs 050502B and 050724, respectively. Note that a tight or relations were found by Liang et al. (2010) and Lü et al. (2012)444Ghirlanda et al. (2012) used a different method to estimate the values. Their method applies the Blandford CMckee (BM) self-similar deceleration solution (Blandford& McKee, 1976) and extrapolates it backward to derive . They derived a different slope of the relation.. Assuming that the flares follow the relation, one can use this relation to estimate , then derive with Eq. (3).
Lü et al. (2012) derived the relation by using the average luminosity of the prompt gamma-rays. Since burst durations depend on the energy band selected (e. g., Qin et al. 2013), it is difficult to accurately measure the duration of flares. Therefore, we use the peak luminosity of the flares for our analysis. In addition, Lü et al. (2012) adopted the ordinary least-square regression method to obtain the regression line. For regression analysis, the fitting results depend on the specification of dependent and independent variables (Isobe et al., 1990). One may find discrepancy of the relations among variables by specifying different dependent variables for a given data set, especially when the data have large error bars or scatters. To avoid specifying independent and dependent variables in the best linear fits, we adopt the algorithm of the bisector of two ordinary least-squares to re-do the regression analysis. The derived relation is
| (8) |
It is roughly consistent with that reported in Lü et al. (2012). We check if X-ray flares follow this relation with a flare observed in GRB 050724. With its erg/s, we get , which is comparable to that reported by Jin et al. (2010), i.e., . We thus use this correlation to estimate the with the peak luminosity of the flares for the 13 GRBs whose redshifts are available. Our results are reported in Table 3. One can find that , with a median value of . The derived values are generally consistent with that reported in previous papers (e.g., Fan & Wei, 2005; Falcone et al., 2006; Panaitescu, 2006).
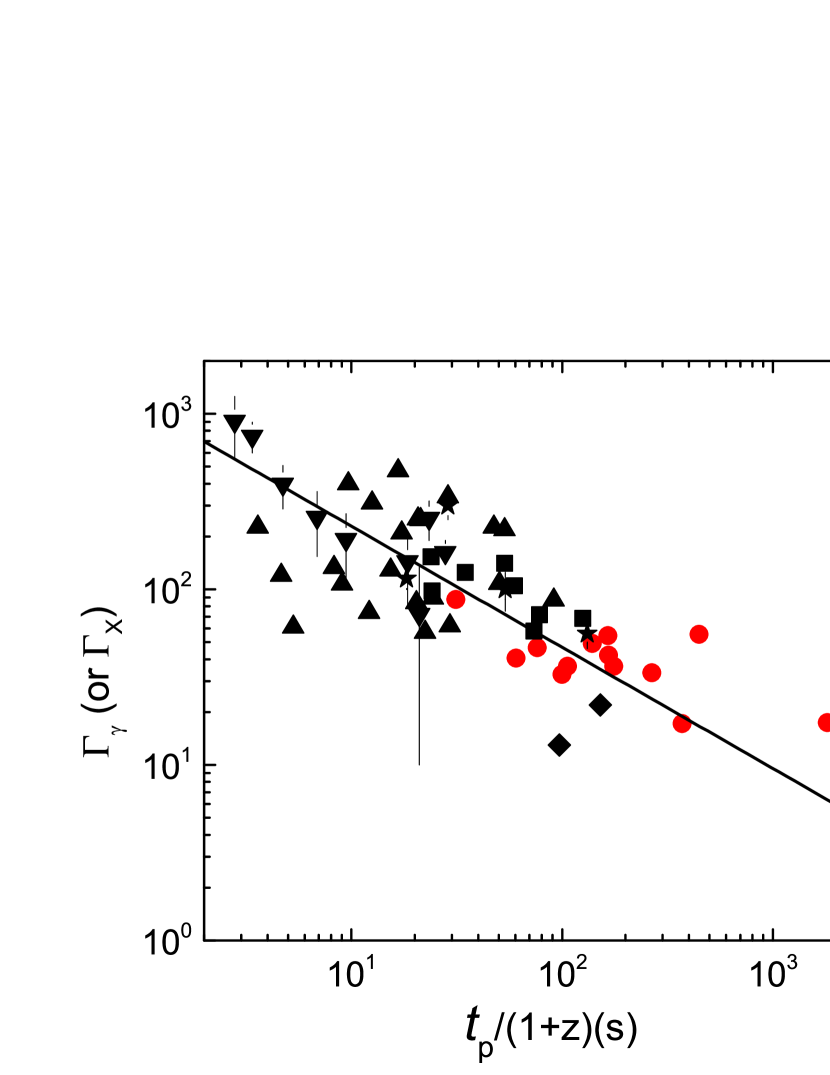
It is generally believed that X-ray flares are powered by the late activities of the GRB central engine. The derived values in this analysis are systematically smaller than the values of the prompt gamma-rays as that reported in Liang et al. (2010, 2013) and Tang et al. (2014). In addition, with the thermal emission observed in the joint BAT and XRT spectra of 13 early flares, which are usually observed at the end of the prompt gamma-ray phase, Peng et al. (2014) derived the values for these flares by assuming that the thermal emission is the photosphere emission of the GRB fireballs. They found that the Lorentz factors range between 50 and 150. They are also systematically larger than the values of late flares in our analysis. To explore possible evolution feature of the Lorentz factor, we plot as a function of in the burst frame for prompt gamma-rays and X-ray flares in Figure 4 with samples from Liang et al. (2013), Peng et al. (2014), Troja et al. (2014), Tang et al. (2014), and Fan & Wei (2005), where the of prompt gamma-rays is taken as the middle of burst duration. One can observe a trend that values (both and ) decay with time. The Spearman correlation analysis yields a correlation coefficient and a chance probability . This may illustrate a long term evolution feature of the GRB central engines (e.g., Lazzati et al., 2008). We derive the relation of to with the algorithm of the bisector of two ordinary least-squares, which yields .
With the derived , we calculate values for the 13 GRBs with Eq. (8). The results are also reported in Table 3. It is found that cm, with a median value of cm. The radiation regions of the flares are within the regions of the prompt gamma-rays and afterglows. It was generally accepted that the locations of the prompt gamma-rays and afterglows are cm and cm (e.g., Zhang & Mészáros, 2004) , respectively. Troja et al. (2014) analyzed the flares with peaking time at seconds post the GRB trigger. They found cm with in the framework of internal shock models, if the variability timescale is significantly shorter than the observed flare duration. Their values are consistent with that producing early prompt gamma-rays. However, as shown in Peng et al. (2014), the photosphere radii of the flares at the end of the prompt gamma-ray emission phase in their sample are usually cm. The internal shock regions of these flares should be beyond the photosphere radius, i.e., cm. The values for the late flares in this analysis are in the range of cm, which is much larger than that of the prompt gamma-rays. We estimate the fireball radii of the afterglows at the flare epochs with (Chevalier & Li, 2000), where is the kinetic energy of the fireballs and is the wind parameter. We calculate values with , where is the radiative efficiency of prompt emission and it is taken as (Frail et al., 2001; Molinari et al., 2007; Liang et al., 2010). The wind parameter is set as . Figure 5 shows the comparison of with . We find that they are satisfied with , indicating that the emission regions of the flares are in a broad range, but they are smaller than the radii of the fireballs for the afterglows. The narrow distribution of of the flares in this analysis would be due to the sample selection effect since we select only late flares in order to eliminate the contamination of adjacent flares.
5 Conclusions and Discussion
We have fit the lightcurves and the spectral evolution during the steep decay segment in 29 late X-ray flares with the curvature effect model. We show that this model may well represent both the spectral and temporal behaviors in the steep decay segments. The derived characteristic timescale are in the range of seconds, spreading about one order of magnitude. Using the relation between the peak luminosity and the Lorentz factor derived from the prompt gamma-rays, we estimate the Lorentz factors of the flares and find with a median value of . With the flares in our sample, together with samples collected from literature for prompt gamma-ray emission and early X-ray flares, we find a tentative correlation between the Lorentz factor and the peak time of the flares (or the middle time of the prompt gamma-ray duration), i.e., . With the derived and , we constrain the radiating region as cm, with a median value of cm. The radiation regions of the flares are within the regions of the prompt gamma-rays and afterglows, and the narrow distribution of of the flares in this analysis would be due to the sample selection effect since we select only late flares in order to eliminate the contamination of adjacent flares.
The derived anti-correlation indicates the decay of the Lorentz factor of ejecta. It may feature the long-term evolution of central engines. With the relation of and Eq. (8), one can obtain . Lazzati et al. (2008) derived a similar power-law index for the correlation between the mean luminosity and the peak time of the individual flares for 10 long GRBs that have multiple flares. They suggested that accretion onto a compact object could explain this feature. Statistics for bright flares gives (Chincarini et al. 2010). Margutti et al. (2011) found the average peak luminosity of the early flares ( seconds) decays as . They argued that this feature could be triggered by a rapid outward expansion of an accretion shock in the material feeding a convective disc in hyper-accreting black hole scenario. Note that the discrepancy of the derived power-law indices would be due to the sample selection.
Note that the luminosity values of the flares in our work are calculated in the XRT band. They may be underestimated, especially for the early X-ray flares. It is well known that the GRB spectra are usually well fit with the Band function in a broad energy band (e.g., Zhang et al. 2011). As shown in Peng et al. (2014), some early X-ray flares are the soft extension of the gamma-ray pulses and the values of their spectra are higher than the XRT band. Their X-ray luminosity values observed in the XRT band are only a small fraction of their bolometric luminosity. Looking at Table 1, one can observe for some flares, indicating that their energy fluxes would go up to a higher energy band. For those flares with , the luminosity observed in the XRT band could be a good representative of the bolometric luminosity, and the values derived from Eq. (8) with measured in the XRT band is only lower limits of . Then, the true relation would become shallower than that derived in this analysis. In addition, with spectral information of prompt gamma-rays collected from Butler et al. (2007), Ghirlanda et al. (2008),and Heussa et al. (2013), we also derive the luminosity at 10 keV () for the GRBs reported in LV (2012) and checked whether it is still tightly correlated with . We found that it is not. This is reasonable since is only a very small fraction of the radiation luminosity. Although is tightly correlated with the bolometric luminosity, it is not necessary to be correlated with any selected mono-frequency luminosity. Therefore, in case of that the luminosity in the XRT band is not a good representative of the bolometric luminosity, the derived with Eq. (8) may be quite uncertain.
The values derived in this analysis are between the prompt gamma-ray and afterglow radiating regions. Since may be underestimated as we mentioned above, the inferred with Eq. (3) thus ma ybe also underestimated, which is somewhat compensated by the assumption that the flare decay timescale is set by the curvature effect. It could be that is dominated by something else, and the reported here may overestimate the true curvature timescale. Recently, Uhm & Zhang (2015) found that the decay slope is steeper than the standard value from the curvature effect model if the jet is undergoing bulk acceleration when the emission ceases. They showed that the decay properties of flares demand that the emission region is undergoing significant bulk acceleration (seel also Jia et al. 2016). Therefore, the dynamical timescale and the magnetic field decay timescale would dominate the flare decay timescale and the value may be smaller, hence the real would be smaller than that reported in this analysis.
References
- Baring & Harding (1997) Baring, M. G., & Harding, A. K. 1997, ApJ, 491, 663
- Burrows et al. (2005) Burrows, D. N., Romano, P., Falcone, A., et al. 2005, Science, 309, 1833
- Butler et al. (2007) Butler, N. R., Kocevski, D., Bloom, J. S., & Curtis, J. L. 2007, ApJ, 671, 656
- Butler& Kocevski (2007) Butler, N. R., & Kocevski, D. 2007, ApJ, 668, 400
- Chevalier & Li (2000) Chevalier, R. A., & Li, Z.-Y. 2000, ApJ, 536, 195
- Blandford& McKee (1976) Blandford, R. D., & McKee, C. F. 1976, Physics of Fluids, 19, 1130
- Chincarini et al. (2010) Chincarini, G., Mao, J., Margutti, R., et al. 2010, MNRAS, 406, 2113
- Chincarini et al. (2007) Chincarini, G., Moretti, A., Romano, P., et al. 2007, ApJ, 671, 1903
- Dai et al. (2006) Dai, Z. G., Wang, X. Y., Wu, X. F., & Zhang, B. 2006, Science, 311, 1127
- Dermer (2004) Dermer, C. D. 2004, ApJ, 614, 284
- Dyks et al. (2005) Dyks, J., Zhang, B., & Fan, Y. Z. 2005, arXiv:astro-ph/0511699
- Evans et al. (2009) Evans, P. A., Beardmore, A. P., Page, K. L., et al. 2009, MNRAS, 397, 1177
- Falcone et al. (2006) Falcone, A. D., Burrows, D. N., Lazzati, D., et al. 2006, ApJ, 641, 1010
- Falcone et al. (2007) Falcone, A. D., Morris, D., Racusin, J., et al. 2007, ApJ, 671, 1921
- Fan & Wei (2005) Fan, Y. Z., & Wei, D. M. 2005, MNRAS, 364, L42
- Fenimore et al. (1993) Fenimore, E. E., Epstein, R. I., & Ho, C. 1993, A&AS, 97, 59
- Fenimore et al. (1996) Fenimore, E. E., Madras, C. D., & Nayakshin, S. 1996, ApJ, 473, 998
- Frail et al. (2001) Frail, D. A., Kulkarni, S. R., Sari, R., et al. 2001, ApJ, 562, L55
- Ghirlanda et al. (2008) Ghirlanda, G., Nava, L., Ghisellini, G., Firmani, C., & Cabrera, J. I. 2008, MNRAS, 387, 319
- Ghirlanda et al. (2012) Ghirlanda, G., Nava, L., Ghisellini, G., et al. 2012, MNRAS, 420, 483
- Gupta & Zhang (2008) Gupta, N., & Zhang, B. 2008, MNRAS, 384, L11
- Hascoet et al. (2015) Hascoet, R., Beloborodov, A. M., Daigne, F., & Mochkovitch, R. 2015, arXiv:1503.08333
- Heussaff et al. (2013) Heussaff, V., Atteia, J.-L., & Zolnierowski, Y. 2013, A&A, 557, A100
- Jin et al. (2010) Jin, Z.-P., Fan, Y.-Z., & Wei, D.-M. 2010, ApJ, 724, 861
- Kobayashi & Zhang (2007) Kobayashi, S., & Zhang, B. 2007, ApJ, 655, 973
- Kouveliotou et al. (1993) Kouveliotou, C., Meegan, C. A., Fishman, G. J., et al. 1993, ApJ, 413, L101
- Kumar & Panaitescu (2000) Kumar, P., & Panaitescu, A. 2000, ApJ, 541, L51
- Lü et al. (2012) Lü, J., Zou, Y.-C., Lei, W.-H., et al. 2012, ApJ, 751, 49
- Lazzati & Begelman (2006) Lazzati, D., & Begelman, M. C. 2006, ApJ, 641, 972
- Lazzati & Perna (2007) Lazzati, D., & Perna, R. 2007, MNRAS, 375, L46
- Lazzati et al. (2008) Lazzati, D., Perna, R., & Begelman, M. C. 2008, MNRAS, 388, L15
- Levan et al. (2014) Levan, A. J., Tanvir, N. R., Starling, R. L. C., et al. 2014, ApJ, 781, 13
- Li et al. (2008) Li, Y., Li, A., & Wei, D. M. 2008, ApJ, 678, 1136
- Liang et al. (2006) Liang, E. W., Zhang, B., O’Brien, P. T., et al. 2006, ApJ, 646, 351
- Liang et al. (2013) Liang, E.-W., Li, L., Gao, H., et al. 2013, ApJ, 774, 13
- Liang et al. (2010) Liang, E.-W., Yi, S.-X., Zhang, J., et al. 2010, ApJ, 725, 2209
- Liang et al. (2015) Liang, E.-W., Lin, T.-T., Lü, J., et al. 2015, ApJ, 813, 116
- Lithwick & Sari (2001) Lithwick, Y., & Sari, R. 2001, ApJ, 555, 540
- Isobe et al. (1990) Isobe, T., Feigelson, E. D., Akritas, M. G., & Babu, G. J. 1990, ApJ, 364, 104
- Jia et al. (2016) Jia, L.-W., Uhm, Z. L., & Zhang, B. 2016, ApJS, 2016, 225, 17
- Margutti et al. (2010) Margutti, R., Guidorzi, C., Chincarini, G., et al. 2010, MNRAS, 406, 2149
- Margutti et al. (2011) Margutti, R., Bernardini, G., Barniol Duran, R., et al. 2011, MNRAS, 410, 1064
- Maxham & Zhang (2009) Maxham, A., & Zhang, B. 2009, ApJ, 707, 1623
- Mészáros & Rees (1993) Mészáros, P., & Rees, M. J. 1993, ApJ, 405, 278
- Mészáros & Rees (1997) Mészáros, P., & Rees, M. J. 1997, ApJ, 476, 232
- Molinari et al. (2007) Molinari, E., Vergani, S. D., Malesani, D., et al. 2007, A&A, 469, L13
- Nousek et al. (2006) Nousek, J. A., Kouveliotou, C., Grupe, D., et al. 2006, ApJ, 642, 389
- Norris et al. (1996) Norris, J. P., Nemiroff, R. J., Bonnell, J. T., et al. 1996, ApJ, 459, 393
- O’Brien et al. (2006) O’Brien, P. T., Willingale, R., Osborne, J., et al. 2006, ApJ, 647, 1213
- Panaitescu (2006) Panaitescu, A. 2006, MNRAS, 367, L42
- Peng et al. (2014) Peng, F.-K., Liang, E.-W., Wang, X.-Y., et al. 2014, ApJ, 795, 155
- Perna et al. (2006) Perna, R., Armitage, P. J., & Zhang, B. 2006, ApJ, 636, L29
- Piran (2004) Piran, T. 2004, Reviews of Modern Physics, 76, 1143
- Proga & Zhang (2006) Proga, D., & Zhang, B. 2006, MNRAS, 370, L61
- Qin (2002) Qin, Y.-P. 2002, A&A, 396, 705
- Qin (2008) Qin, Y.-P. 2008, ApJ, 683, 900
- Qin et al. (2013) Qin, Y., Liang, E.-W., Liang, Y.-F., et al. 2013, ApJ, 763, 15
- Rees & Mészáros (1994) Rees, M. J., & Mészáros, P. 1994, ApJ, 430, L93
- Romano et al. (2006) Romano, P., Moretti, A., Banat, P. L., et al. 2006, A&A, 450, 59
- Sari & Piran (1999) Sari, R., & Piran, T. 1999, ApJ, 520, 641
- Schady et al. (2012) Schady, P., Dwelly, T., Page, M. J., et al. 2012, A&A, 537, AA15
- Starling et al. (2007) Starling, R. L. C., Wijers, R. A. M. J., Wiersema, K., et al. 2007, ApJ, 661, 787
- Tang et al. (2014) Tang, Q.-W., Peng, F.-K., Wang, X.-Y., & Tam, P.-H. T. 2014, arXiv:1412.3342
- Troja et al. (2014) Troja, E., Piro, L., Vasileiou, V., et al. 2014, arXiv:1411.1415
- Uhm & Zhang (2014) Uhm, Z. L., & Zhang, B. 2014, arXiv:1411.0118
- Virgili et al. (2013) Virgili, F. J., Mundell, C. G., Pal’shin, V., et al. 2013, ApJ, 778, 54
- Woods & Loeb (1995) Woods, E., & Loeb, A. 1995, ApJ, 453, 583
- Wu et al. (2006) Wu, X. F., Dai, Z2010ApJ…725.1965L. G., Wang, X. Y., et al. 2006, 36th COSPAR Scientific Assembly, 36, 731
- Zhang et al. (2006) Zhang, B., Fan, Y. Z., Dyks, J., et al. 2006, ApJ, 642, 354
- Zhang & Mészáros (2004) Zhang, B., & Mészáros, P. 2004, International Journal of Modern Physics A, 19, 2385
- Zhang et al. (2007) Zhang, B.-B., Liang, E.-W., & Zhang, B. 2007, ApJ, 666, 1002
- Zhang et al. (2009) Zhang, B.-B., Zhang, B., Liang, E.-W., & Wang, X.-Y. 2009, ApJ, 690, L10
- Zhang et al. (2014) Zhang, B.-B., Zhang, B., Murase, K., Connaughton, V., & Briggs, M. S. 2014, ApJ, 787, 66
- Uhm & Zhang (2015) Uhm, Z. L., & Zhang, B. 2015, ApJ, 808, 33


| GRB | interval | mean time | C_stat/bin††footnotemark: | ||
|---|---|---|---|---|---|
| (s) | (s) | ( cm-2) | |||
| 050502B | 714 - 767 | 760 | 0.03 | 878/859 | |
| – | 768 - 792 | 780 | – | – | |
| – | 793 - 825 | 808 | – | – | |
| – | 827 - 887 | 853 | – | – | |
| – | 892 - 1021 | 945 | – | – | |
| – | 1031 - 1130 | 1062 | – | – | |
| 060111A | 283 - 294 | 288 | 0.13 | 810/743 | |
| – | 295 - 319 | 308 | – | – | |
| – | 320 - 331 | 326 | – | – | |
| – | 332 - 347 | 339 | – | – | |
| – | 347 - 370 | 358 | – | – | |
| – | 371 - 410 | 387 | – | – | |
| – | 413 - 483 | 443 | – | – | |
| 060124 | 761 - 771 | 766 | 0.13 | 630/623 | |
| – | 772 - 782 | 777 | – | – | |
| – | 782 - 797 | 789 | – | – | |
| – | 798 - 813 | 805 | – | – | |
| – | 814 - 836 | 824 | – | – | |
| 060904B | 172 - 184 | 178 | 0.49 | 692/645 | |
| – | 187 - 220 | 196 | – | – | |
| – | 207 - 252 | 212 | – | – | |
| – | 219 - 278 | 225 | – | – | |
| – | 233 - 308 | 240 | – | – | |
| – | 249 - 340 | 256 | – | – | |
| – | 268 - 396 | 284 | – | – | |
| 060929 | 527 - 542 | 535 | 0.11 | 500/470 | |
| – | 543 - 557 | 550 | – | – | |
| – | 557 - 574 | 565 | – | – | |
| – | 575 - 600 | 587 | – | – | |
| – | 602 - 640 | 620 | – | – | |
| – | 642 - 709 | 668 | – | – | |
| 070520B | 180 - 184 | 182 | 0.20 | 563/453 | |
| – | 185 - 197 | 190 | – | – | |
| – | 197 - 214 | 205 | – | – | |
| – | 216 - 239 | 227 | – | – | |
| – | 239 - 269 | 253 | – | – | |
| – | 270 - 340 | 298 | – | – | |
| 070704 | 338 - 350 | 344 | 0.32 | 977/924 | |
| – | 351 - 365 | 358 | – | – | |
| – | 366 - 386 | 376 | – | – | |
| – | 387 - 420 | 401 | – | – | |
| – | 428 - 523 | 468 | – | – | |
| 080928 | 355 - 361 | 358 | 0.38 | 259/257 | |
| – | 361 - 368 | 364 | – | – | |
| – | 369 - 377 | 373 | – | – | |
| – | 378 - 391 | 384 | – | – | |
| – | 392 - 412 | 402 | – | – | |
| 091130B | 103 - 112 | 107 | 0.31 | 657/665 | |
| – | 112 - 122 | 117 | – | – | |
| – | 123 - 132 | 128 | – | – | |
| – | 134 - 146 | 139 | – | – | |
| – | 147 - 161 | 154 | – | – | |
| – | 163 - 177 | 169 | – | – | |
| 100619A | 949 - 968 | 959 | 0.47 | 818/772 | |
| – | 969 - 991 | 980 | – | – | |
| – | 992 - 1019 | 1005 | – | – | |
| – | 1020 - 1052 | 1036 | – | – | |
| – | 1053 - 1097 | 1073 | – | – | |
| – | 1100 - 1191 | 1137 | – | – | |
| – | 1195 - 1286 | 1234 | – | – | |
| 100704A | 196 - 228 | 208 | 0.31 | 1064/820 | |
| – | 228 - 242 | 234 | – | – | |
| – | 242 - 254 | 248 | – | – | |
| – | 255 - 264 | 259 | – | – | |
| – | 265 - 275 | 270 | – | – | |
| – | 270 - 330 | 300 | – | – | |
| 100802A | 507 - 538 | 522 | 0.03 | 995/826 | |
| – | 541 - 564 | 552 | – | – | |
| – | 567 - 594 | 581 | – | – | |
| – | 598 - 635 | 615 | – | – | |
| – | 640 - 707 | 668 | – | – | |
| – | 719 - 818 | 784 | – | – | |
| 100902A | 418 - 431 | 424 | – | – | |
| – | 432 - 454 | 442 | – | – | |
| – | 457 - 473 | 464 | – | – | |
| – | 473 - 482 | 477 | – | – | |
| – | 482 - 492 | 487 | – | – | |
| – | 493 - 511 | 501 | – | – | |
| 110801A | 453 - 472 | 462 | – | 1103/833 | |
| – | 473 - 486 | 479 | – | – | |
| – | 487 - 507 | 496 | – | – | |
| 110820A | 258 - 262 | 260 | – | 181/157 | |
| – | 262 - 267 | 265 | – | – | |
| – | 267 - 271 | 269 | – | – | |
| – | 298 - 328 | 309 | – | – | |
| 121027A | 259 - 277 | 268 | 1.33 | 338/322 | |
| – | 278 - 303 | 290 | – | – | |
| – | 305 - 337 | 320 | – | – | |
| – | 339 - 392 | 363 | – | – | |
| – | 397 - 441 | 418 | – | – | |
| – | 446 - 494 | 467 | – | – | |
| 121211A | 182 - 203 | 192 | 1.20 | 1211/818 | |
| – | 204 - 228 | 215 | – | – | |
| – | 229 - 241 | 235 | – | – | |
| – | 242 - 253 | 247 | – | – | |
| – | 253 - 265 | 259 | – | – | |
| – | 265 - 277 | 271 | – | – | |
| 121229A | 458 - 467 | 462 | 0.50 | 352/309 | |
| – | 468 - 478 | 473 | – | – | |
| – | 479 - 489 | 484 | – | – | |
| – | 490 - 501 | 496 | – | – | |
| – | 490 - 518 | 510 | – | – | |
| – | 490 - 545 | 531 | – | – | |
| – | 490 - 585 | 564 | – | – | |
| – | 490 - 619 | 601 | – | – | |
| 130131A | 293 - 310 | 301 | 0.30 | 281/219 | |
| – | 311 - 332 | 320 | – | – | |
| – | 335 - 391 | 355 | – | – | |
| 130615A | 356 - 368 | 362 | 0.00 | 764/659 | |
| – | 368 - 383 | 375 | – | – | |
| – | 384 - 400 | 391 | – | – | |
| – | 401 - 421 | 411 | – | – | |
| – | 422 - 451 | 436 | – | – | |
| – | 453 - 501 | 474 | – | – | |
| – | 505 - 591 | 540 | – | – | |
| 130925A1 | 997 - 1007 | 1002 | 1.59 | 874/862 | |
| – | 1008 - 1019 | 1013 | – | – | |
| – | 1020 - 1031 | 1025 | – | – | |
| – | 1032 - 1043 | 1037 | – | – | |
| – | 1044 - 1057 | 1050 | – | – | |
| – | 1058 - 1086 | 1071 | – | – | |
| – | 1087 - 1131 | 1107 | – | – | |
| 130925A2 | 5020 - 5031 | 5026 | 1.59 | 1189/1218 | |
| – | 5032 - 5042 | 5037 | – | – | |
| – | 5043 - 5060 | 5051 | – | – | |
| – | 5061 - 5083 | 5071 | – | – | |
| – | 5084 - 5111 | 5097 | – | – | |
| – | 5112 - 5162 | 5135 | – | – | |
| – | 5163 - 5249 | 5203 | – | – | |
| 131030A | 116 - 125 | 120 | 0.61 | 907/769 | |
| – | 126 - 138 | 132 | – | – | |
| – | 140 - 160 | 149 | – | – | |
| – | 160 - 181 | 170 | – | – | |
| – | 182 - 207 | 193 | – | – | |
| – | 208 - 218 | 213 | – | – | |
| – | 219 - 225 | 222 | – | – | |
| 140430A | 222 - 233 | 227 | 0.91 | 319/298 | |
| – | 233 - 239 | 236 | – | – | |
| – | 239 - 246 | 242 | – | – | |
| – | 247 - 257 | 251 | – | – | |
| – | 259 - 274 | 266 | – | – | |
| 140506A | 359 - 372 | 365 | 0.64 | 772/567 | |
| – | 373 - 384 | 378 | – | – | |
| – | 385 - 394 | 389 | – | – | |
| – | 395 - 417 | 405 | – | – | |
| – | 417 - 440 | 428 | – | – | |
| – | 441 - 483 | 459 | – | – | |
| 140512A | 144 - 150 | 147 | 0.20 | 346/304 | |
| – | 151 - 156 | 153 | – | – | |
| – | 157 - 163 | 160 | – | – | |
| – | 164 - 173 | 169 | – | – | |
| – | 175 - 187 | 180 | – | – | |
| 140709A | 189 - 192 | 190 | 0.28 | 187/187 | |
| – | 193 - 199 | 196 | – | – | |
| – | 200 - 206 | 203 | – | – | |
| – | 207 - 216 | 211 | – | – | |
| – | 218 - 235 | 225 | – | – | |
| 141031A | 1104 - 1109 | 1106 | 0.12 | 263/220 | |
| – | 1111 - 1139 | 1124 | – | – | |
| – | 1141 - 1164 | 1152 | – | – | |
| – | 1167 - 1187 | 1177 | – | – | |
| – | 1191 - 1225 | 1206 | – | – | |
| – | 1229 - 1256 | 1241 | – | – | |
| – | 1262 - 1578 | 1264 | – | – | |
| 141130A | 329 - 336 | 332 | 0.20 | 110/126 | |
| – | 338 - 352 | 344 | – | – | |
| – | 355 - 376 | 364 | – | – | |
| – | 380 - 404 | 391 | – | – | |
| – | 409 - 445 | 425 | – | – |
| GRB | |||||
|---|---|---|---|---|---|
| () | (keV) | (s) | |||
| 050502B | 1.77 0.05 | 1.69 0.04 | 5.72 0.24 | 171.71 3.38 | 1.32 |
| 060111A | 2.28 0.07 | 1.51 0.04 | 7.76 0.24 | 121.13 2.17 | 3.03 |
| 60124 | 2.74 0.16 | 1.04 0.06 | 2.90 0.12 | 123.25 4.58 | 1.80 |
| 060904B | 16.46 0.72 | 0.93 0.18 | 2.54 0.24 | 65.39 1.41 | 3.98 |
| 60929 | 1.37 0.07 | 1.10 0.06 | 4.62 0.16 | 121.01 2.00 | 8.31 |
| 070520B | 2.33 0.12 | 1.56 0.06 | 3.28 0.10 | 138.59 2.71 | 3.76 |
| 70704 | 3.58 0.19 | 1.17 0.06 | 3.96 0.12 | 129.90 2.39 | 4.42 |
| 80928 | 1.03 0.08 | 0.68 0.10 | 3.42 0.26 | 67.73 3.13 | 1.36 |
| 091130B | 9.05 0.52 | 0.28 0.53 | 1.64 0.46 | 86.13 2.34 | 2.09 |
| 100619A | 2.73 0.10 | 1.12 0.05 | 3.22 0.06 | 253.92 3.21 | 6.51 |
| 100704A | 24.07 0.99 | 1.11 0.16 | 2.74 0.20 | 49.50 1.13 | 3.32 |
| 100802A | 2.14 0.07 | 1.23 0.05 | 4.62 0.16 | 242.57 4.42 | 2.93 |
| 100902A | 52.50 1.65 | 1.12 0.15 | 2.88 0.24 | 43.86 0.76 | 6.64 |
| 110801A | 2.40 0.41 | 1.46 0.08 | 2.84 0.14 | 113.27 5.56 | 1.24 |
| 110820A | 2.59 0.56 | 0.31 0.28 | 4.32 1.08 | 23.98 1.19 | 6.01 |
| 121027A | 1.06 0.14 | 1.81 0.05 | 5.38 0.14 | 264.63 8.92 | 1.64 |
| 121211A | 5.96 0.23 | 0.10 0.08 | 1.22 0.02 | 179.31 6.44 | 2.22 |
| 121229A | 1.26 0.06 | 1.35 0.07 | 3.74 0.16 | 130.88 3.18 | 3.69 |
| 130131A | 2.02 0.16 | 2.00 0.05 | 5.92 0.20 | 57.87 1.75 | 3.24 |
| 130615A | 1.05 0.04 | 0.88 0.06 | 3.94 0.16 | 156.82 3.20 | 2.34 |
| 130925A1 | 5.18 0.14 | 0.66 0.04 | 3.56 0.04 | 157.63 1.35 | 13.79 |
| 130925A2 | 6.61 0.15 | 0.39 0.04 | 2.38 0.02 | 247.51 1.45 | 18.70 |
| 131030A | 47.79 1.86 | 1.46 0.14 | 4.54 0.54 | 54.61 1.40 | 1.76 |
| 140430A | 7.25 0.64 | 2.25 0.07 | 3.42 0.12 | 51.52 1.36 | 2.48 |
| 140506A | 11.43 1.38 | 1.96 0.97 | 2.04 1.14 | 129.17 21.95 | 1.21 |
| 140512A | 3.11 0.26 | 0.10 0.54 | 2.54 0.12 | 43.60 2.83 | 0.88 |
| 140709A | 10.43 1.76 | 1.82 0.11 | 3.00 0.12 | 33.55 1.16 | 1.90 |
| 141031A | 0.73 0.05 | 1.44 0.07 | 5.86 0.16 | 180.30 6.71 | 1.39 |
| 141130A | 0.66 0.35 | 2.11 0.17 | 2.04 0.14 | 167.56 10.17 | 1.78 |
| GRB | z | model | ||||||||
|---|---|---|---|---|---|---|---|---|---|---|
| 060124 | 2.297 | – | – | power-law | 1.01 | |||||
| 060904B | 0.703 | – | – | band | 1.08 | |||||
| 080928 | 1.692 | – | – | power-law | 1.01 | |||||
| 110801A | 1.858 | – | – | power-law | 0.99 | |||||
| 121027A | 1.773 | – | – | power-law | 1.05 | |||||
| 121211A | 1.023 | band | 1.98 | |||||||
| 121229A | 2.707 | – | – | power-law | 1.14 | |||||
| 130925A1 | 0.347 | – | – | power-law | 1.01 | |||||
| 130925A2 | 0.347 | – | – | power-law | 0.98 | |||||
| 131030A | 1.293 | band | 1.15 | |||||||
| 140430A | 1.6 | – | – | power-law | 0.96 | |||||
| 140506A | 0.889 | – | – | power-law | 1.36 | |||||
| 140512A | 0.725 | band | 1.45 |