Size Dependence of Oxygen-annealing Effects on Superconductivity of Fe1+yTe1-xSx
Abstract
For the Fe-based superconductor Fe1+yTe1-xSx, superconductivity is induced by annealing treatment in oxygen atmosphere, whereas as-grown samples do not show superconductivity. We have investigated the sample-size dependence of O2-annealing effects in Fe1.01Te0.91S0.09. The annealing conditions are fixed to be 1 atm, 200 ∘C, and 2 hours. We have carried out magnetic susceptibility and specific heat measurements in order to evaluate the superconducting volume fraction. We have found that Fe1+yTe1-xSx has an optimal size for the induction of bulk superconductivity by O2 annealing. Our results indicate that O2 annealing is probably effective near the surface of samples over a length of a few tens of micro meters.
1 Introduction
Numerous iron-based superconductors have been reported since the discovery of superconductivity in LaOFeP and La(O1-xFx)FeAs [1, 2]. Among them, iron chalcogenide materials such as FeSe, Fe1+yTe1-xSex, and Fe1+yTe1-xSx are categorized as 11-systems[3]. The 11-system attracts researchers’ attention because of the simplest crystal structure. The crystal structure of Fe1+yTe is tetragonal and the space group is . Fe1+yTe () does not show superconductivity, but exhibits a structural phase transition to a monoclinic () phase at K. The transition is accompanied by a magnetic phase transition to a commensurate antiferromagnetic phase with a wave vector of . In the higher iron concentration range of , tetragonal Fe1+yTe undergoes a structural phase transition to an orthorhombic () phase and a magnetic phase transition with an incommensurate magnetic structure with , where for Fe1.141Te [4, 5, 6, 7, 8]. The substitution of S for Te in Fe1+yTe suppresses the structural and the magnetic phase transition temperatures. While as-grown samples of Fe1+yTe1-xSx exhibits no superconductivity for all the compositions of and [9], superconductivity can be induced in Fe1+yTe1-xSx by several kinds of treatments. Examples of such treatments are leaving in the air for a long time[10], annealing in O2 atmosphere (O2 annealing)[11, 12, 13], annealing in S atmosphere [14], and soaking in hot alcoholic beverages or aqueous organic solutions, e.g. red wine or malic acid[15, 16]. After the soaking treatment in the aqueous organic solutions, an Fe component has been detected in the solutions[16]. Hence, it is inferred that the deintercalation of excess Fe may be a key for the induction of superconductivity in Fe1+yTe1-xSx.
In another 11 system, Fe1+yTe1-xSex, superconductivity can be also induced by various treatments [17, 18, 19, 20, 21, 14]. Among the treatments, annealing in low-pressure oxygen atmosphere or in vacuum can induce bulk superconductivity, and a large critical current density and a discontinuity of the specific heat have been observed [20, 17, 18]. By contrast, no evidence for bulk superconductivity in Fe1+yTe1-xSx has been observed thus far, although zero electrical resistivity and large diamagnetic susceptibility in zero-field-cooled (ZFC) condition have been observed in Fe1+yTe1-xSx samples after similar treatments. Therefore, it is speculated that the superconducting state could be realized only within particular regions of the samples.
In the present work, we have investigated the sample-size dependence of the O2-annealing effects by means of ZFC and field-cooled (FC) susceptibility and specific heat measurements. We have chosen the O2-annealing condition to be 1 atm, 2 hours, and 200 ∘C, following Ref. \citenmizuguchi2010evolution. We observed a jump of the specific heat around the superconducting transition temperature in relatively small O2-annealed samples. To the best of our knowledge, this is the first observation of bulk superconductivity in Fe1+yTe1-xSx. We deduce that the superconducting region induced by O2 annealing is probably near the surface of samples over a length of a few tens of micro meters.
2 Experimental Procedure
The single crystalline samples of Fe1+yTe1-xSx used in the present study were prepared by a self flux method described in Ref. \citenmizuguchi2011single. Fe shot (5N), Te shot (6N), and S shot (6N) with a nominal composition of were sealed in evacuated quartz ampoule under atmosphere of 0.3-atm argon. The ampoule was heated by an electric furnace to 1050 ∘C. Subsequently, the temperature was kept for 20 hours and then cooled to 650 ∘C at a rate of C / h. All the samples used in this work were obtained from the same batch. The dimensions of the single crystalline sample for measurements were 3 mm 3 mm 0.5 mm3 (class #1). We prepared powder samples by crushing single crystals, and classified them by size using sieves into the following dimensions; 106–250m (class #2), 75–106m (class #3), 20–75m (class #4), and 0–20m (class #5). The samples were annealed in O2 atmosphere . The pressure, temperature, and duration for the O2 annealing were fixed to be 1 atm, 200 ∘C, and 2 hours, respectively.
The actual composition of the samples were determined to be Fe1.01Te0.91S0.09 using an electron probe micro analyzer EPMA (JEOL, JXA-8100). X-ray powder diffraction measurements with Fe-Kα radiation were performed using RIGAKU, RAD-C.
We measured the magnetic susceptibility using a superconducting quantum interference device (SQUID) magnetometer (Quantum Design, MPMS). For the magnetic susceptibility measurements, the applied field was 20 Oe. The single crystalline sample (sample class #1) was mounted in a plastic straw so that the applied field is along the longest dimension. The powder samples (sample class #2–#5) were wrapped in cling film and mounted in plastic straws. We have also measured the specific heat by a thermal relaxation method (Quantum Design, PPMS). For specific heat measurements for class #3 (75–106 m), the sample was wrapped in copper foil; the heat capacity and the specific heat of the samples were evaluated by subtracting the heat capacity of the copper foil as described in Ref. \citenshi2010accurate. For the subtraction, the data of the specific heat measured for copper in Ref. \citenmartin1960specific were used. For the other samples, pellets, prepared by pressing small pieces of crystals, were used for specific heat measurements. The samples used for magnetic susceptibility, specific heat, and X-ray diffraction measurements are labeled with a, b, and c, respectively, preceded by the class number, e. g. sample 1a.
3 Experimental Results
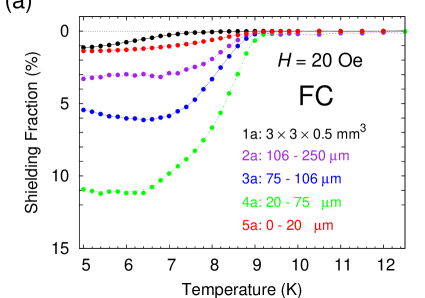
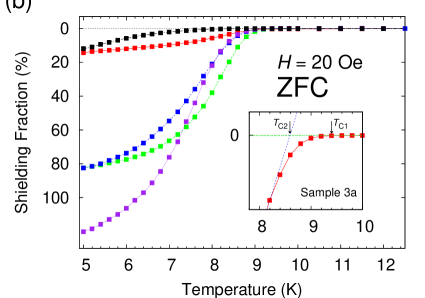
Figures 1(a) and (b) show the temperature dependences of the superconducting shielding fraction (SF) of size-classified O2-annealed Fe1.01Te0.91S0.09 evaluated from the magnetic susceptibility, K), measured (a) in the zero-field-cooled (ZFC) condition and (b) field-cooled (FC) condition. In this work, the demagnetizing field effects are ignored. The onset of the superconducting transition temperature (onset ) for single crystalline sample 1a is 8.8 K, and the onset rises to 9.4 K for the powder samples. The inset of Fig. 1(b) depicts an example of the definition of the onset . The SF at 5 K for sample 1a in the ZFC condition is 12%. and the SF at 5 K for samples 2a–4a (20–250 m) is enhanced and is over 80% in the ZFC condition. For the smallest sample 5a (0–20 m), however, the SF is suppressed to 14% at 5 K. On the other hand, the SF in the FC condition for sample 1a (single crystal) is only about 1%. The SF in the FC condition increases with decreasing sample size except for sample 5a. For sample 5a, the SF in the FC condition is only 1%. The SF measured in the FC condition is correlated with the superconducting volume fraction (SVF). Accordingly, we use the SF in the FC condition as a measure of the SVF. The sample-size dependence of the SF measured in the FC condition is summarized in Table 1. The results indicate that the O2-annealing effects for the Fe1+yTe1-xSx strongly depends on the sample size, and there appears to be an optimum sample size to maximize the SVF.
| Sample | size | SF-FC (%) | onset (K) | onset (K) |
|---|---|---|---|---|
| 1a | 3 3 0.5 mm3 | 1.1 | 8.8 | 7.0 |
| 2a | 106–250 m | 3.2 | 9.4 | 8.4 |
| 3a | 75–106 m | 6.2 | 9.4 | 8.6 |
| 4a | 20–75 m | 11.0 | 9.4 | 8.8 |
| 5a | 0–20 m | 1.2 | 9.2 | 8.9 |
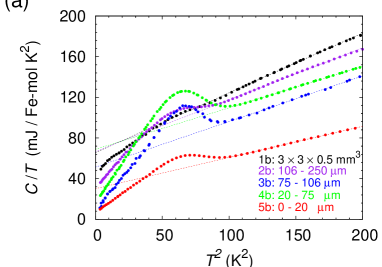
The specific heat provides quantitative and reliable information about the SVF. The specific heat divided by temperature, , against is plotted in Fig. 2 (a). Peaks associated with the superconducting transition were observed in the O2-annealed powder samples 2a - 5a, although such a peak was hardly observed in the single crystalline sample 1b. As will be described later, these samples used include several kinds of impurities, e. g. FeTe2. It is, therefore, difficult to distinguish the specific heat of Fe1.01Te0.91S0.09 from those of the impurities. Here we analyze the specific heat data assuming the following simple formula for the temperature range of 100 K2 196 K2 ,
| (1) |
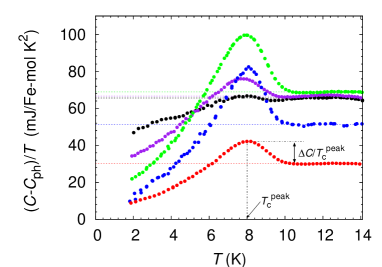
where and mainly come from the electronic and the lattice specific heat coefficients of Fe1.01Te0.91S0.09 , respectively. Figure. 2(b) shows the electronic part of the specific heat obtained from the data on the assumption of the functional form of equation (1). This analysis apparently fails to extract the electronic contribution of Fe1.01Te0.91S0.09 because the entropy balance is not conserved in Fig. 2(b). Nevertheless, the peaks observed in the specific heat are so clear that their attributions to the superconducting transition appear to be plausible. The onset temperature of the peak (onset ), the peak temperature (), and the parameters obtained from the fitting procedure are tabulated in Table 2. Note that fitting the experimental data to equation (1) yields and including the contributions from the impurities. The Debye temperature estimated from in sample 1b is 149 K, which is close to a Debye temperature of 141 K for the parent compound Fe1.05Te reported in Ref.\citenchen2009electronic. The onset temperature of the peak increases to about 10.2 K with decreasing sample size for samples 2b–4b and that of sample 5b slightly decreases. The peak temperature is about 8.0 K in the sample 2b–5b. The peak heights of samples 3b and 4b are very close (31 mJ/Fe-mol K2) and are the greatest among the samples.
| Sample | size | (mJ/K4mol) | (K) | (mJ/Fe-mol K2) | onset- (K) | (K) | (mJ/Fe-mol K2) |
|---|---|---|---|---|---|---|---|
| 1b | 3 3 0.5 mm3 | 0.59 | 149 | 66 | (9.0) | (8.0) | - |
| 2b | 106 - 250 m | 0.51 | 156 | 67 | 9.5 | 7.8 | 9.3 |
| 3b | 75 - 106 m | 0.45 | 163 | 51 | 9.6 | 8.1 | 31 |
| 4b | 20 - 75 m | 0.41 | 169 | 69 | 10.2 | 8.0 | 31 |
| 5b | 0 - 20 m | 0.31 | 185 | 30 | 10.0 | 8.0 | 12 |
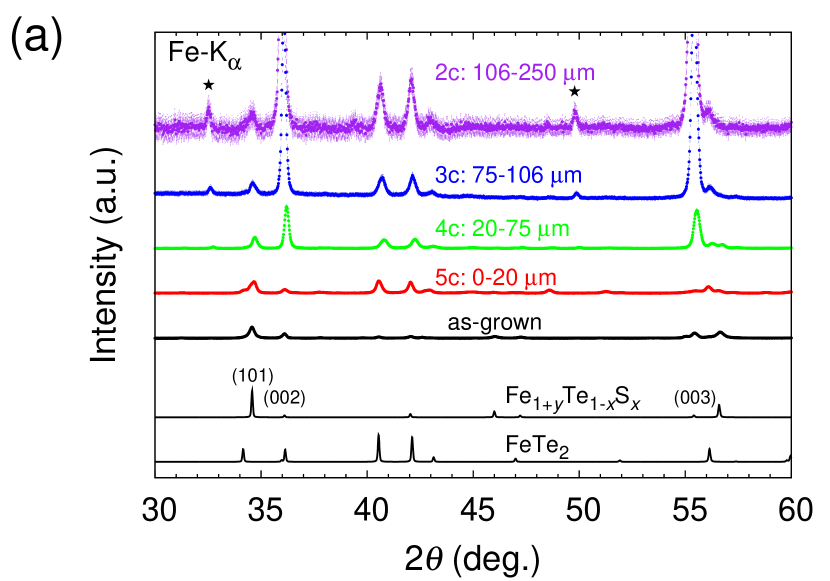
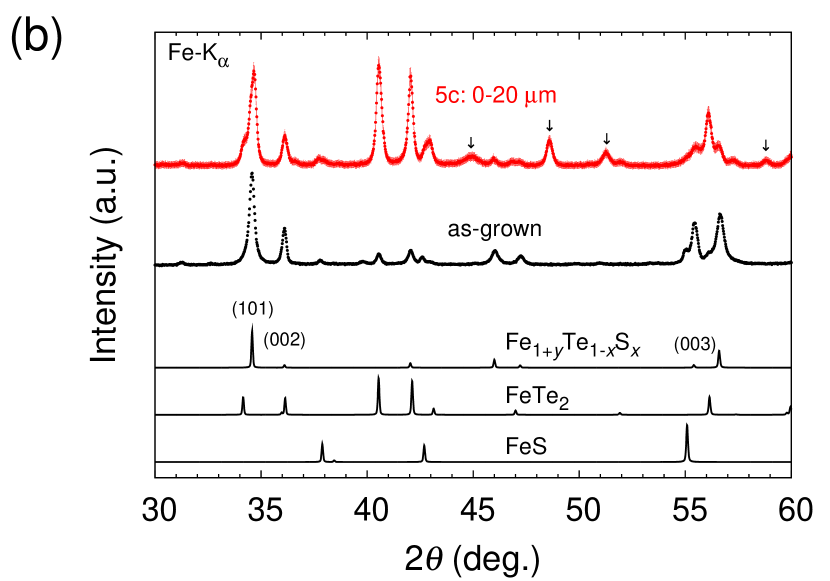
The size dependence observed in the susceptibility and the specific heat measurements indicates that the O2 annealing affects due to the distance from surface. To identify the materials created in the samples through O2 annealing, X-ray diffraction measurements were carried out. Figure 3(a) shows the X-ray diffraction patterns of size-classified O2-annealed samples of Fe1.01Te0.91S0.09, and those of an as-grown sample for comparison. While the as-grown sample was ground for the measurements, the O2-annealed samples were mounted on the glass plates without being ground. Consequently, the X-ray diffraction data for O2-annealed samples reflect the composition of the materials near the surface; the penetration depth of the X-ray used is about 5 m. The data were scaled by the (101) peak intensity because of quite a high intensity of peaks owing to the O2-annealed samples being naturally oriented. Figure 3(b) shows an enlarged view of the data for the as-grown sample and the smallest sample 5c. In the as-grown sample, small peaks from FeS and FeTe2 are also seen in addition to the peaks of Fe1.01Te0.91S0.09. Since sulfur has a solubility limit[9], the surplus sulfur might react and form these impurities. Therefore, these impurities could be inevitable in the single crystalline sample grown by the self flux method. Besides this, the two peaks at 40.5∘ and 42.1∘ attributable to FeTe2 are clearly observed for the O2-annealed samples. FeTe2 is probably generated by the O2 annealing at surfaces of Fe1.01Te0.91S0.09. FeTe2 has been observed also in Fe1+yTe1-xSx annealed in the oxygen at temperatures higher than 300 ∘C[11]. For all of the samples annealed in oxygen atmosphere, reflections attributable to Fe2O3 or Fe3O4 were not observed. In the smallest powder sample 5c, many additional peaks were observed. Although they have not been identified, other impurity peaks indicated by arrows are also seen. Other unidentified materials are produced by O2 annealing especially in the smallest sample 5c.
4 Discussion
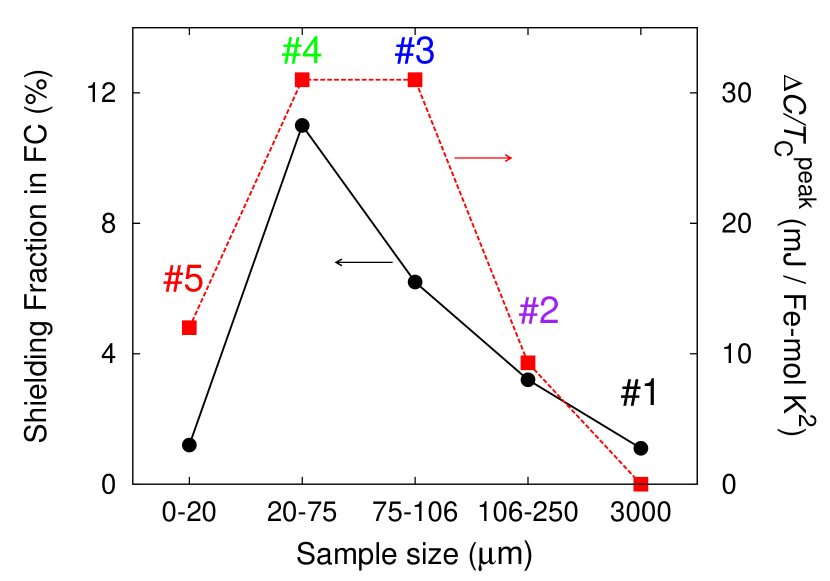
The sample-size dependences of the SVF in O2-annealed Fe1.01Te0.91S0.09 evaluated from FC susceptibility and from specific heat measurements show almost the same trend as illustrated in Fig. 4. The SVF becomes greater with decreasing sample size down to 20 m, but it becomes lower in smaller samples. The results indicate two types of effects of O2 annealing in Fe1.01Te0.91S0.09: creation and deterioration of superconducting regions. It is unable to evaluate the accurate SVF from these results because of the difficulty of the analysis for the specific heat as mentioned above. The volume fraction, however, may be roughly estimated to be dozens of percent of order by assuming the BCS theory, comparing observed in sample 3b and 4b are from 0.4–0.6, which is in the BCS theory.
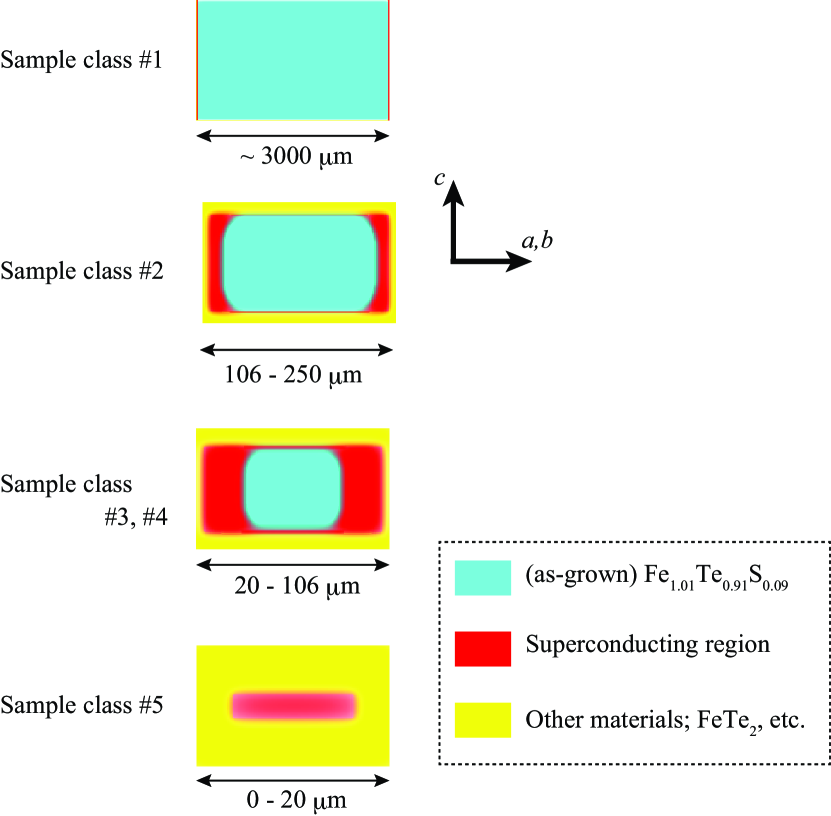
From the sample-size dependence of the superconducting volume fraction, the superconducting regions probably exist within a thickness of a few tens of micro meters from the surface. Figure 5 shows schematic diagrams of the O2-annealing effects we propose. In order to construct these diagrams, we have made the following assumptions:
-
1.
O2 annealing mostly affects regions close to sample surfaces.
-
2.
As a consequence of the O2 annealing, two distinct layers are formed near the surfaces. The outer layer contains a large amount of non-superconducting materials such as FeTe2 while the inner layer mostly consists of superconducting regions that encloses almost the whole sample. The core region surrounded by the two layers remains unchanged after the annealing.
-
3.
The thicknesses of those two layers are anisotropic due to the anisotropy of the crystal structure, but are independent of the sample size, and may be regarded as somewhat similar to a penetration depth of the annealing effects.
In fact, the formation of layers responsible for superconductivity,which enclose almost the whole sample, is consistent with the large difference between the SF in ZFC and FC conditions. Indeed, these assumptions reasonably well account for the observations concerning the SVF. The SVF will increase with decreasing sample size when the dimensions of the sample is considerably larger than the thickness of the two layers. On the other hand, when the dimensions of the sample becomes less than the thickness of the layers, the inner superconducting layer will naturally diminish and the SVF will decrease. As shown in Table 2, the electronic specific heat coefficient of the sample class #5 is relatively small. This result is consistent with our view shown in Fig 5 because FeTe2, which is an insulator (), is one of the major impurities in the smallest sample class #5[25]. As stated earlier, the X-ray diffraction measurements did not detect oxidized iron such as Fe2O3 or Fe3O4 in the O2-annealed samples. Nevertheless, we observed an oxygen component at surfaces of the O2-annealed samples in EPMA measurements. We conjecture that oxygen could be diffused in Fe1+yTe1-xSx and intercalated between adjacent atomic layers as suggested in Ref.\citenmizuguchi2010evolution. Such intercalation perhaps reduces the effects of excess iron and induces superconductivity.
5 Conclusions
We have investigated the sample-size dependence of the O2-annealing effects by means of ZFC and the FC susceptibility and specific heat measurements. We observed a jump of the specific heat around superconducting transition temperature in the O2-annealed small samples. As far as we know, this is the first observation of the bulk superconductivity in Fe1+yTe1-xSx. It implies that the superconducting region induced by O2 annealing is distributed probably near the surface of samples over a length of a few tens of micro meters in the annealing condition of 1 atm, 2 hours, and 200 ∘C.
Acknowledgements
This work was partly carried out under the Visiting Researcher’s Program of the Institute for Solid State Physics, the University of Tokyo. We would like to thank H. Yoshizawa for his support in the specific heat measurements.
We are grateful to K. Motoya and T. Moyoshi for allowing us to use electron probe microanalyzer (EPMA) and equipment for sample synthesis.
References
- [1] Y. Kamihara, H. Hiramatsu, M. Hirano, R. Kawamura, H. Yanagi, T. Kamiya, and H. Hosono: J. Am. Chem. Soc. 128 (2006) 10012.
- [2] Y. Kamihara, T. Watanabe, M. Hirano, and H. Hosono: J. Am. Chem. Soc. 130 (2008) 3296.
- [3] K. Deguchi, Y. Takano, and Y. Mizuguchi: Sci. Technol. Adv. Mater. 13 (2012).
- [4] S. Li, C. de La Cruz, Q. Huang, Y. Chen, J. Lynn, J. Hu, Y.-L. Huang, F.-C. Hsu, K.-W. Yeh, M.-K. Wu, et al.: Phys. Rev. B 79 (2009) 054503.
- [5] W. Bao, Y. Qiu, Q. Huang, M. Green, P. Zajdel, M. Fitzsimmons, M. Zhernenkov, S. Chang, M. Fang, B. Qian, et al.: Phys. Rev. Lett. 102 (2009) 247001.
- [6] R. Hu, E. S. Bozin, J. Warren, and C. Petrovic: Phys. Rev. B 80 (2009) 214514.
- [7] P. Zajdel, P.-Y. Hsieh, E. E. Rodriguez, N. P. Butch, J. D. Magill, J. Paglione, P. Zavalij, M. R. Suchomel, and M. A. Green: J. Am. Chem. Soc. 132 (2010) 13000.
- [8] C. Koz, S. Rößler, A. A. Tsirlin, S. Wirth, and U. Schwarz: Phys. Rev. B 88 (2013) 094509.
- [9] Y. Mizuguchi, K. Deguchi, T. Ozaki, M. Nagao, S. Tsuda, T. Yamaguchi, and Y. Takano: Appl. Supercond. 21 (2011) 2866.
- [10] Y. Mizuguchi, K. Deguchi, S. Tsuda, T. Yamaguchi, and Y. Takano: Phys. Rev. B 81 (2010) 214510.
- [11] Y. Mizuguchi, K. Deguchi, S. Tsuda, T. Yamaguchi, and Y. Takano: Europhys. Lett. 90 (2010) 57002.
- [12] Y. Kawasaki, Y. Mizuguchi, K. Deguchi, T. Watanabe, T. Ozaki, S. Tsuda, T. Yamaguchi, and Y. Takano: Physica C 471 (2011) 611.
- [13] V. Awana, A. Pal, A. Vajpayee, B. Gahtori, and H. Kishan: Physica C 471 (2011) 77.
- [14] K. Deguchi, A. Yamashita, T. Yamaki, H. Hara, S. Demura, S. Denholme, M. Fujioka, H. Okazaki, H. Takeya, T. Yamaguchi, et al.: Journal of Applied Physics 115 (2014) 053909.
- [15] K. Deguchi, Y. Mizuguchi, Y. Kawasaki, T. Ozaki, S. Tsuda, T. Yamaguchi, and Y. Takano: Supercond. Sci. Technol. 24 (2011) 055008.
- [16] K. Deguchi, D. Sato, M. Sugimoto, H. Hara, Y. Kawasaki, S. Demura, T. Watanabe, S. Denholme, H. Okazaki, T. Ozaki, et al.: Supercond. Sci. Technol. 25 (2012) 084025.
- [17] T. Noji, M. Imaizumi, T. Suzuki, T. Adachi, M. Kato, and Y. Koike: J. Phys. Soc. Jpn. 81 (2012) 054708.
- [18] M. Imaizumi, T. Noji, T. Adachi, and Y. Koike: J. Phys.: Conf. Ser. 400 (2012) 022034.
- [19] Y. Kawasaki, K. Deguchi, S. Demura, T. Watanabe, H. Okazaki, T. Ozaki, T. Yamaguchi, H. Takeya, and Y. Takano: Solid State Commun. 152 (2012) 1135.
- [20] Y. Sun, T. Taen, Y. Tsuchiya, Z. Shi, and T. Tamegai: Supercond. Sci. Technol. 26 (2012) 015015.
- [21] E. E. Rodriguez, C. Stock, P.-Y. Hsieh, N. P. Butch, J. Paglione, and M. A. Green: Chemical Science 2 (2011) 1782.
- [22] Q. Shi, C. L. Snow, J. Boerio-Goates, and B. F. Woodfield: J. Chem. Therm. 42 (2010) 1107.
- [23] D. L. Martin: Can. J. Phys. 38 (1960) 17.
- [24] G. Chen, Z. Chen, J. Dong, W. Hu, G. Li, X. Zhang, P. Zheng, J. Luo, and N. Wang: Phys. Rev. B 79 (2009) 140509.
- [25] E. Westrum Jr, C. Chou, and F. Gronvold: J. Chem. Phys. 30 (1959) 761.