Doped carbon nanotubes as a model system of biased graphene
Abstract
Albeit difficult to access experimentally, the density of states (DOS) is a key parameter in solid state systems which governs several important phenomena including transport, magnetism, thermal, and thermoelectric properties. We study DOS in an ensemble of potassium intercalated single-wall carbon nanotubes (SWCNT) and show using electron spin resonance spectroscopy that a sizeable number of electron states are present, which gives rise to a Fermi-liquid behavior in this material. A comparison between theoretical and the experimental DOS indicates that it does not display significant correlation effects, even though the pristine nanotube material shows a Luttinger-liquid behavior. We argue that the carbon nanotube ensemble essentially maps out the whole Brillouin zone of graphene thus it acts as a model system of biased graphene.
I Introduction
There is a compelling link and similarity between the physical and chemical properties of the two carbon allotropes, graphene Novoselov et al. (2004) and single-wall carbon nanotubes Iijima and Ichihashi (1993); Bethune et al. (1993). Both contain carbon in a nearly sp2 configuration and both consist essentially of a surface only. Concerning electronic properties, a linear energy dispersion is present for both materials but the differing dimensionality results in different energy dependence of the electronic density of states: for graphene, it is a smooth linear function of the energy Castro Neto et al. (2009), whereas for SWCNTs, it contains Van Hove singularities Hamada et al. (1992); Mintmire et al. (1992) whose presence is a fingerprint of the one-dimensional electronic character of SWCNTs. The similarity is even more striking for graphene nanoribbons (GNR) Son et al. (2006) and SWCNTs Hamada et al. (1992); Mintmire et al. (1992): the electron confinement within the nanoribbon also gives rise to quantized states in a very similar manner to that of the SWCNTs. However, the quantization also means that SWCNTs and GNRs only map part of the graphene Brillouin-zone since only a subset of the graphene -points are allowed for the two former materials.
In general, charge doping of graphite-based nanocarbon Dresselhaus and Dresselhaus (2002) provides a way to yield insight into the electronic and vibrational properties as a function of the chemical potential (which is measured with respect to the charge neutral state). E.g. for graphite, a highly charge doped (or stage I) phase has the KC8 stoichiometry for potassium doping, which involves a Fermi level shift of eV (Ref. Grüneis et al. (2009)). Compelling examples in graphene and SWCNTs, when charge doping led to interesting insights, include the emergence of intra-band transitions in graphene Mak et al. (2008), the bleaching of resonance Raman enhancement in SWCNTs Rao et al. (1997a, b) and the Luttinger to Fermi liquid crossover in SWCNTs Rauf et al. (2004).
The electronic density of states, or DOS, is the central parameter for condensed matter systems Ashcroft and Mermin (1976): it enters into most measurable properties such as e.g. electric or heat-transport and it governs strongly correlated phenomena such as, e.g., the superconducting transition Bardeen et al. (1957). A comparison of experimental and calculated DOS values usually provide an elaborate way to test the accuracy of the theoretical description and whether strong correlation effects play a role.
Despite its importance, DOS is hardly accessible by direct means. Energy dependent DOS is measurable using photoemission and tunneling spectroscopy Ashcroft and Mermin (1976); Zandvliet and van Houselt (2009), however, both methods yield relative DOS values and the absolute value is accessible only upon extensive calibration. The value of the DOS at the Fermi level, is measurable by nuclear magnetic resonance spectroscopy Slichter (1989) but this technique relies on the knowledge of the electron-nuclear hyperfine coupling constant. In contrast, the electronic specific heat and the Pauli spin-susceptibility of the conduction electrons provide a direct measurement of the DOS in the absence of strong correlation effects Ashcroft and Mermin (1976). The Pauli spin-susceptibility is measurable by conduction electron spin resonance (CESR) experiments. CESR measures specifically the contribution of conduction electrons to magnetism Winter (1971) and it was successful in, e.g., identifying strong correlation effects Jánossy et al. (1993) and the low-dimensional metallic character in fulleride conductors Chauvet et al. (1994).
The following open questions called for a study of DOS in charge doped SWCNTs: i) it is still debated whether strong correlation effects are present in chemically doped SWCNTs, ii) it is also not known to what extent the SWCNT system can be used as a model system of biased graphene given the different dimensionality of their Fermi surfaces. Herein, we present conduction electron spin resonance studies on ensembles of SWCNTs with a well-defined diameter distribution under potassium doping to induce charge transfer to the tubes. We determine the DOS from the measurement of the Pauli spin-susceptibility of the conduction electrons and we compare this value with that obtained from tight-binding calculations. We find a good agreement between the two data, which confirms that an ensemble of chemically doped SWCNTs behaves as a Fermi-liquid with no substantial correlation effects. We show that the large number of different SWCNT geometries, which are present in our sample, give rise to a homogeneous mapping of almost all -points in the Brillouin zone of graphene.
II Experiments and calculations
We used commercial SWCNTs prepared by the arc-discharge method from the same batch that we used previously for Raman measurements Simon et al. (2005a), peapod filling Simon et al. (2006a), and NMR studies Simon et al. (2005b). According to Raman spectroscopy, the diameter distribution in the SWCNT samples is a Gaussian with a mean diameter of nm and variance of nm. The material was purified with repeated air oxidation and acid treatments. In order to enable penetration of microwaves, thoroughly ground fine powder samples were prepared. Samples of about mg were vacuum annealed at for 1 h in an ESR sample tube and inserted into an Ar filled glove-box without air exposure. We used two methods for the intercalation with potassium: the more conventional vapor technique Dresselhaus and Dresselhaus (2002) and intercalation in liquid ammonia Galambos et al. (2009). The vapor method involves sealing of the SWCNTs together with an abundant amount of potassium inside a quartz tube and an annealing to . This method works well for intercalating graphite and the surface of SWCNT samples but we found (as discussed below) that intercalation in ammonia is more efficient. Alkali metals are known to dissolve well in liquid ammonia which was used to synthesize alkali metal doped fullerides Murphy et al. (1992); Liu et al. (1994), carbon nanotubes Liang et al. (2004), or graphene oxide Kumar et al. (2011).
The saturated stoichiometry for K doping is around K:C for SWCNTs Pichler et al. (2001), which is close to the KC8 stoichiometry for graphite Dresselhaus and Dresselhaus (2002). To ensure saturation, about higher, non-stoichiometric amount of potassium was introduced into the ESR quartz tube which was subsequently placed under ammonia atmosphere. The quartz tube was inserted into an ethanol bath that was cooled down by liquid nitrogen. The doping hence proceeds at C in liquid ammonia promoted by slight sonication. The residual ammonia is evaporated by annealing at C for minutes. The as-prepared material is inserted into a new, clean ESR quartz tube.
ESR measurements were performed using a commercial X-band spectrometer. -factors were calibrated with respect to Mn2+:MgO (the Mn2+ content of MgO is ppm, and -factor is Abragam (1961)) by taking into account the hyperfine interaction of Mn2+ to second order. The ESR intensity was calibrated with CuSO5H2O reference samples, to calibrate the spin-susceptibility. Raman spectrometry was carried out on a Labram (Horiba JY) spectrometer at eV ( nm). Care was taken to avoid laser induced de-intercalation of the samples, the power was thus limited to mW. The spectral resolution was cm-1.
We also performed microwave impedance measurements as a function of temperature with the so-called cavity perturbation method Nebendahl et al. (2001); Karsa et al. (2012). This method yields the temperature-dependent resistivity (in relative units), which is otherwise unavailable for air-sensitive powder samples. The same samples were used for all studies.
The DOS was calculated in the nearest-neighbour tight-binding approximation for a large number () SWCNT chiralities as a function of the chemical potential Hamada et al. (1992); Mintmire and White (1998). These data were then weighted with the abundance of each tubes, which was assumed to follow a Gaussian with the above mean diameter and variance Milnera et al. (2000); Jorio et al. (2001); Kuzmany et al. (2001); Borowiak-Palen et al. (2002); Liu et al. (2002); Saito et al. (2009); Mustonen et al. (2012); Chen et al. (2014). Additional quasi-particle broadening of the Van Hove singularities of the SWCNTs due to finite life-time effects were considered Simon et al. (2006b). The data for an SWCNT chirality appears along the so-called cutting lines due to the -space quantization which corresponds to the circumference of the SWCNT Hamada et al. (1992); Mintmire and White (1998). A smearing of the cutting lines due to the uncertainty principle was also included by broadening the cutting lines with a Gaussian function.
III Results and discussion
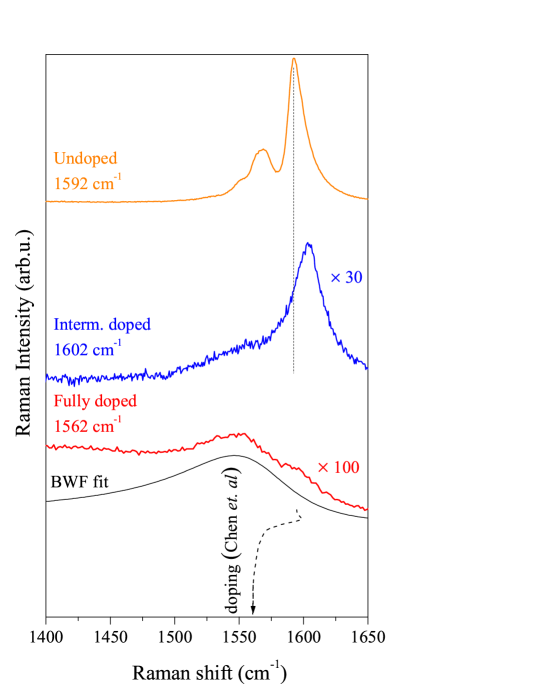
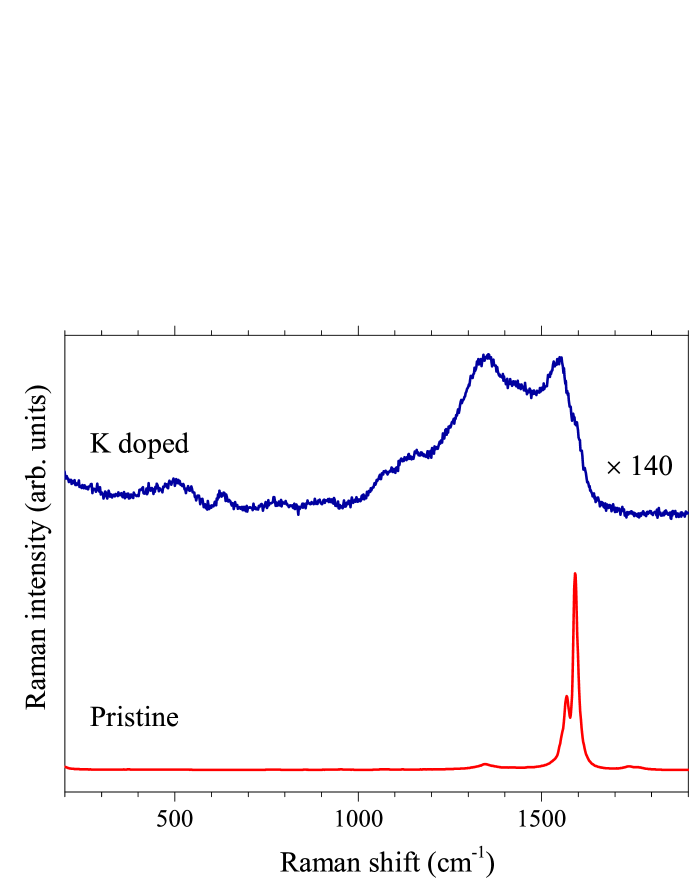
In Fig. 1., we show the G-mode range Raman spectra of pristine, intermediate doped, and fully potassium doped SWCNTs. The intermediate doping was achieved by the vapor phase method, whereas the full doping was performed by the liquid ammonia method. Characteristic changes are observed in the Raman spectra of the SWCNTs upon doping: the G mode component with lower Raman shift (known as mode) broadens rapidly and vanishes Park et al. (2009). The G mode component with the higher Raman shift (known as the mode) upshifts for the intermediate doping and significantly downshifts for the highest level of doping. Both observations agree well with the results of Raman studies on in-situ K and Cs doped SWCNTs in Ref. Chen et al. (2005), which proves that a saturated K intercalation is achieved in our samples for the liquid ammonia procedure. We find that the vapor doping does not produce homogeneously high doping levels for our relatively large sample amounts in contrast to doping thin sample films in the previous in-situ Raman study Chen et al. (2005).
In Fig. 2., we show the ESR spectra for the pristine and sample doped to saturation with potassium. An intensive and broad background due to the Ni:Y catalyst particles is observed for the pristine sample. The -factor of this signal () allowed us to identify it as being due to the Ni2+ ion with an intensity compatible with the expected Ni amount in the sample Galambos et al. (2009). It was shown Dóra et al. (2008) that the undoped SWCNTs do not display the ESR signal of itinerant electrons due to the presence of the so-called Tomonaga-Luttinger liquid correlated state.
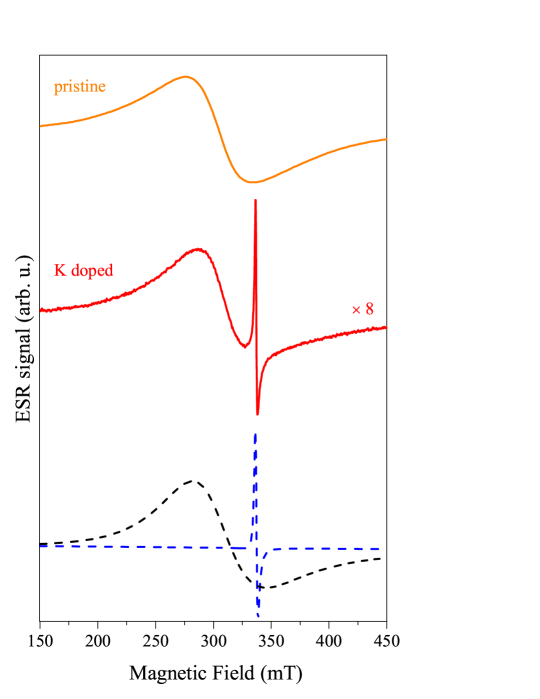
Upon doping, a narrower signal with an ESR line-width of mT emerges at with an asymmetric lineshape. This lineshape is known as a Dysonian curve Dyson (1955) and it can be fitted with a mixture of absorption and dispersion Lorentzian derivative lines Walmsley (1996). The microwave phase of the mixing is that is close to the ideal , which is expected when electrons with a low carrier mobility are embedded in a metal Feher and Kip (1955). We note that often the Dysonian, i.e., the asymmetric nature of an ESR signal is used as a hallmark that the ESR of itinerant electrons is observed. The present study shows that the signal due to Ni2+ ions is also asymmetric in the doped sample (see Fig. 2). Any spin system whether due to localized or delocalized electrons (including nuclei), which is embedded in a metal gives an asymmetric lineshape Feher and Kip (1955); Szirmai et al. (2011).
Simultaneously, the overall ESR signal intensity drops significantly due to the limited microwave penetration into the sample and due to a decrease in the cavity quality factor when the sample becomes more metallic. The narrower signal can be identified as being present due to the conduction electrons that are induced upon the charge transfer from the K to the SWCNTs. Several facts support this identification: the Pauli-like temperature dependence of the signal intensity as it is discussed below, the line-width matches well with that in K doped graphite powder, mT, and follows a similar temperature dependence Dresselhaus and Dresselhaus (2002). We note that the presence of doped graphite powder can be excluded as the source of this signal as the graphite quantity in the pristine SWCNT samples is too small in the pristine SWCNT samples Galambos et al. (2009).
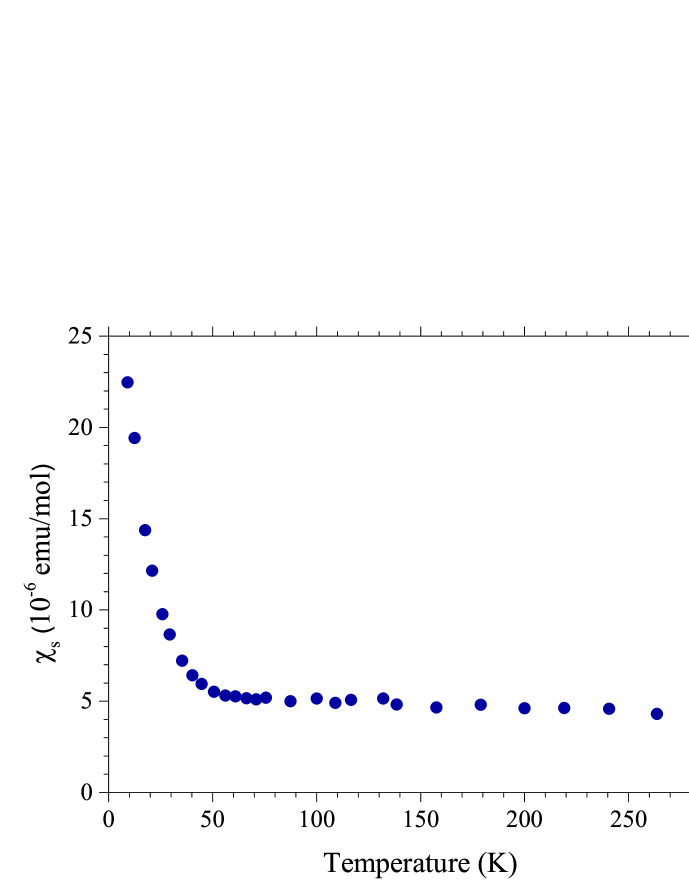
In Fig. 3., we show the temperature dependence of the ESR intensity and the linewidth of the ESR signal assigned to the conduction electrons. The temperature dependent sample resistivity is also shown. The data are not shown below K due to reasons discussed below. The ESR intensity shows a slight decrease with decreasing temperature (down to K), which proves that this signal indeed originates from the itinerant electrons. Were this signal coming from localized spins, its intensity would increase by a factor when going from K to K. Indeed, the signal of the background grows in this manner (data not shown) and its intensity increases with as expected for localized spins from the Curie law. The slight decrease in the ESR intensity of itinerant electrons occurs due to a change in the microwave penetration into the sample and a change in the microwave cavity quality factor. Similar slight intensity drop was observed for metallic boron doped diamond Szirmai et al. (2013), which was measured under identical conditions.
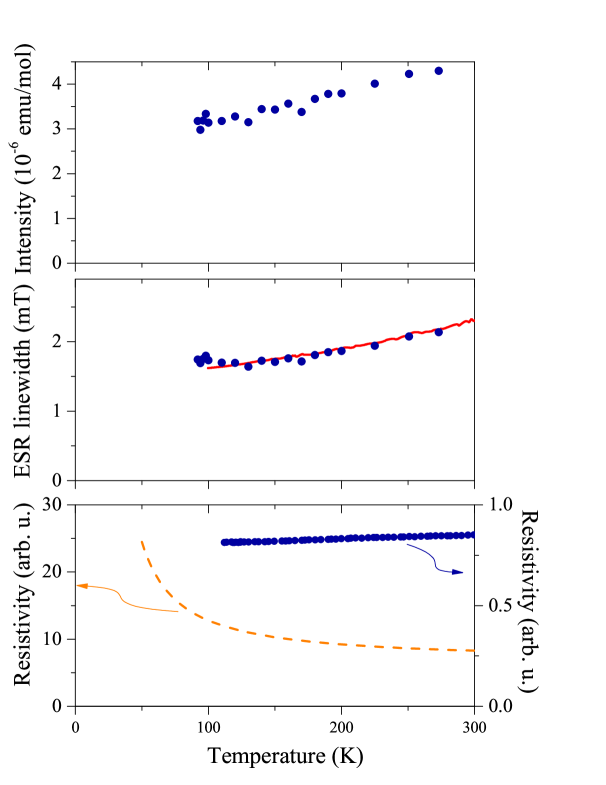
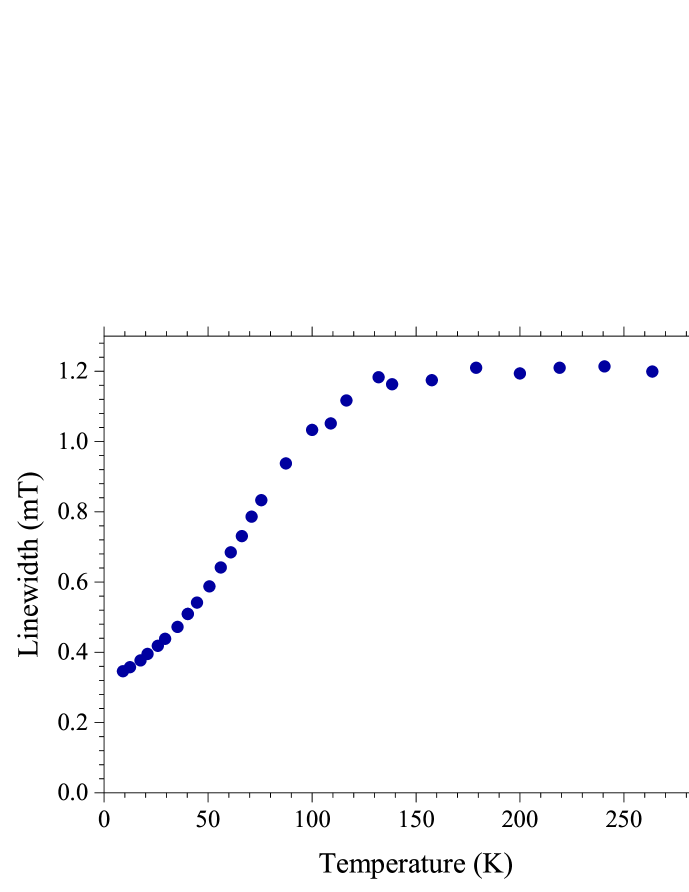
The ESR linewidth data in Fig. 3b. agrees well for K doped SWCNTs and graphite, which also proves that the above identification is valid. This agreement also shows that the apparent difference in the structure of the two materials does not affect the ESR linewidth: for both materials is dominated by spin scattering due to the K ions, which was explained for K doped graphite Fábián et al. (2012) in the framework of the Elliott-Yafet theory of spin-relaxation in metals Elliott (1954); Yafet (1963). It is known from the study of alkali doped fullerides (A3C60, AK and Rb) that for the heavier alkali elements (K and Rb) the ESR linewidth scales with the atomic spin-orbit coupling of the nuclei Dóra and Simon (2009). However, a characteristic difference is expected for Li intercalated SWCNT and graphite as therein Li is expected to give a negligible contribution to the spin scattering.
Upon doping, the sample resistivity drops by about a factor at room temperature and its temperature dependence changes character from semiconducting to metallic behavior as shown in Fig. 3c. These observations agree with previous studies Fuhrer et al. (1998); Pichler et al. (2001) and prove that doping makes our powder samples metallic.
Our CESR data below K do not follow the trends described above, due the presence of paramagnetic impurities in our system. Similarly to the case of K3C60 Claye et al. (2000), the temperature-dependence of the ESR measurables approach the behavior of paramagnetic impurities. This indicates that at these temperatures the so-called bottleneck regime is realized, i.e., a strong coupling is present between the paramagnetic and metallic spin systems.
In the following, we discuss the absolute value of the static spin-susceptibility, and DOS in K doped SWCNTs. Due to its selection rules, ESR is selective to magnetism which originates from a spin quantum number, i.e., due to the Curie or Pauli susceptibility and is insensitive, e.g., to the Van Vleck or Landau susceptibilities Slichter (1989). For this reason, the ESR signal intensity is often mentioned to be a direct measure of the spin-susceptibility. To obtain absolute values of , a calibration of the ESR signal is required as it is detailed in Ref. Szirmai et al. (2013). In brief, the ESR signal of a well known paramagnetic intensity standard (CuSO5H2O in our case) is measured which allows to relate the ESR signal intensity to an actual spin-susceptibility. In principle it allows to determine for any samples.
For the present measurements, an intermediate calibration step is required as the K doping induces a change in the sample conductivity and thus the penetration of microwaves is also affected. The presence of this effect is clear from a signal intensity drop of about a factor of the Ni2+ ions. To take this effect into account, the measured signal intensity of the K doped SWCNTs is scaled back with the same factor. From our two-step calibration, we obtain a emumol. The sizeable error of this value arises from the somewhat uncertain amount of SWCNTs in the sample. The measured static spin-susceptiblity is related to the DOS through the Pauli susceptibility:
| (1) |
where is the vacuum permeability, is the Bohr magneton, is the volume of the unit cell Ashcroft and Mermin (1976).
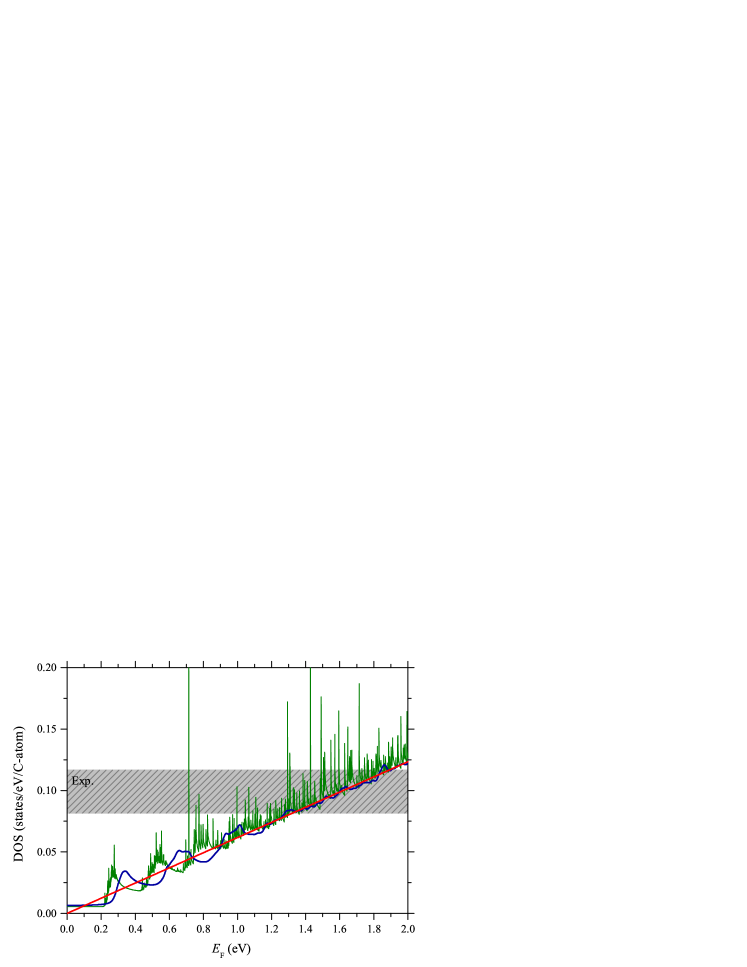
To test the validity of the experimentally determined DOS, we compare it with calculations that were performed on an ensemble of SWCNT as described above. Fig. 4 shows a comparison between the experimental DOS result and theoretical calculations as a function of the chemical potential, i.e., the energy separation from the Dirac point. The theoretical data is shown with zero and a finite K ( meV) broadening parameter. For comparison, the DOS for graphene in the vicinity of the Dirac point is also shown according to Ref. Castro Neto et al. (2009): , where is the corresponding Fermi velocity Luican et al. (2011) and is the area of the first Brillouin zone (BZ). The gray bar in Fig. 4 shows the value of the experimental DOS, which allows to deduce the chemical potential shift due to doping. The integration of a given DOS() function yields the charge transfer. From this, we obtain that our experimental DOS corresponds to a stoichiometry of K:C=. Remarkably, the calculated K to C ratio is close to that found in alkali intercalated graphite (KC8 Dresselhaus and Dresselhaus (2002)) and in vapor-phase doped SWCNTs using in-situ electron energy-loss spectroscopy Liu et al. (2003). Within the limitations posed by the error bar, the experimental and theoretically deduced DOS data are in accordance. This finding means that the system under study does not show strong correlations. In view of the underlying one-dimensional character of the SWCNTs, this observation might sound surprising. However, several previous studies identified the intercalation-induced transition from the Tomonaga-Luttinger liquid to a three-dimensional Fermi-liquid phase Liu et al. (2003); Rauf et al. (2004); Simon et al. (2008); Galambos et al. (2009).
An ensemble of SWCNTs contains a large number of tubes with chiralities which follow a Gaussian diameter distribution Simon et al. (2005a, b); Jorio et al. (2001); Kuzmany et al. (2001); Liu et al. (2002); Chen et al. (2014). One expects that the eventual differences in the SWCNT geometries are smeared out for this ensemble, or even the one-dimensional characters are less pronounced and that it is possible to approach graphene, the mother compound of the SWCNTs.
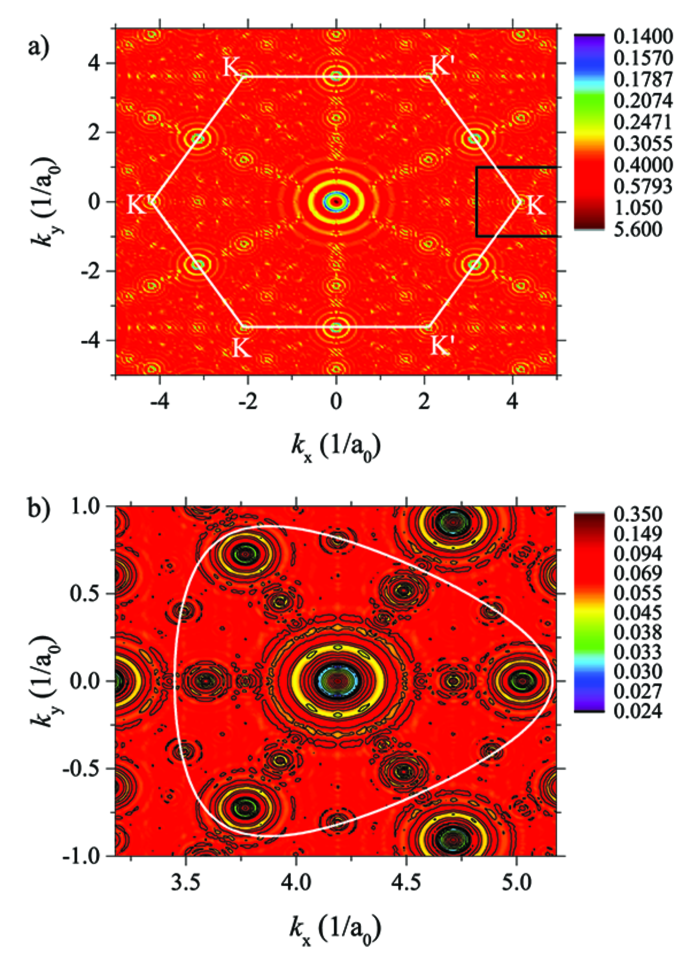
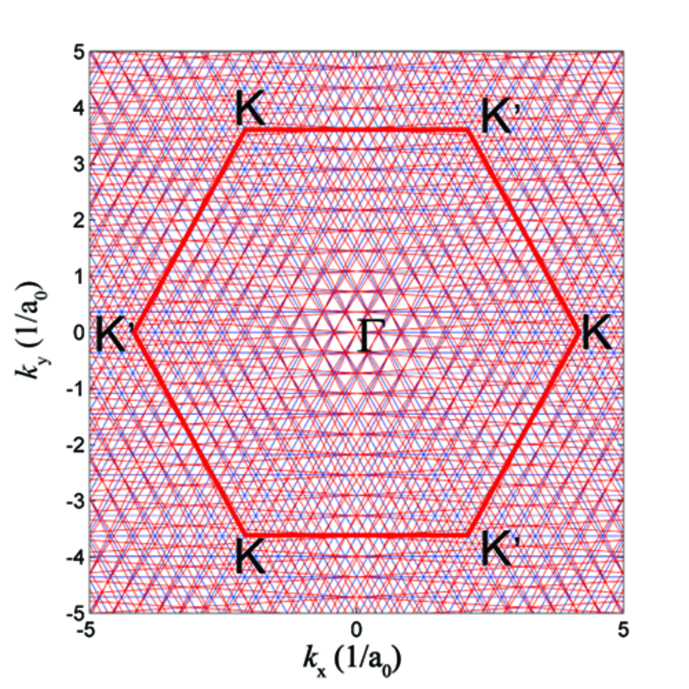
To test this suggestion, we performed calculations investigating to what extent the BZ of graphene is mapped out by a carbon nanotube ensemble. In the zone-folding scheme, the one-dimensional representations of the quantized momentum-space directions of carbon nanotubes Samsonidze et al. (2004), i.e., the cutting lines, display the electronic states of a given () chirality. In Fig. 5., we depict the reciprocal space coverage of a carbon nanotube ensemble in the proximity of the point as the sum of the probability amplitudes of each of the cutting lines of all relevant chiralities. The projection illustrates that all the electronic states of graphene are almost homogeneously represented by the carbon nanotube ensemble. The high-symmetry point (as a result of the crossing of the metallic cutting lines) is slightly over-represented but the coverage at chemical shifts close to our doping (K:C) barely oscillates around its mean value Sup . Therefore, this illustration proves directly that at high doping levels the SWCNT ensemble behaves as the model system of doped or gate-biased graphene. This provides an additional link between graphene and carbon nanotubes: for an ensemble of SWCNTs the bulk properties (spin and thermal properties) mimic those in graphene and related compounds. In turn, such physical properties of a graphene could be studied using carbon nanotubes ensembles, in particular as a function of charge doping.
In conclusion, we found that using liquid ammonia doping, the KC7 saturation potassium doping can be achieved in large quantities of SWCNT ensembles. We demonstrated that ESR is applicable to determine the electronic density of states in alkali doped SWCNTs, and we confirmed the absence of strong correlation effects, and that the material behaves as a three-dimensional Fermi liquid. By comparing the reciprocal space of a SWCNT ensemble and biased graphene, we illustrated that potassium-doped SWCNTs provide a tunable model system for graphene.
Acknowledgments
Work supported by the ERC Grant Nr. ERC-259374-Sylo and the Swiss NSF (Grant No. 200021_144419).
IV Supplementary material
IV.1 Low-temperature ESR measurements
Figure 6. depicts the spin-susceptibility at low temperatures, as determined from the ESR intensity. Below K, the intensity slightly increases indicating the presence of low amount of paramagnetic impurities () in our system that give a single resonance as a result of the bottleneck effect Barnes (1981). The conditions of the bottleneck regime are quite naturally satisfied as the -factor of the defects in carbon structures are expected to be close to the CESR signal of potassium doped SWCNTs.
This assignment is further confirmed by the ESR linewidth (see Fig. 7.), by the resonant field (not shown), and by the change of the phase of the mixture of the absorption and dispersion Lorentzian derivative lines. The change of the slope of the ESR linewidth around K indicates that the susceptibility of the impurities starts to dominate below this temperature. It thus causes the narrowing of the ESR line. Similarly, the -factor slowly changes below K (), highlighting that the -factor of our ESR line is a mixture of the -factor of the paramagnetic impurities and the -factor of the CESR line.
IV.2 Raman measurements
Fig. 8. shows the Raman spectra of both the pristine and saturation K doped materials. The G-mode range indicates a dramatic change in the spectra, as discussed below. In accordance with Ref. Rao et al. (1997a), several softened modes appear in the mid-frequency region ( cm-1). In Ref. Rao et al. (1998), these modes were found to be related to a breakdown in the pristine nanotube selection rules associated with the doping.
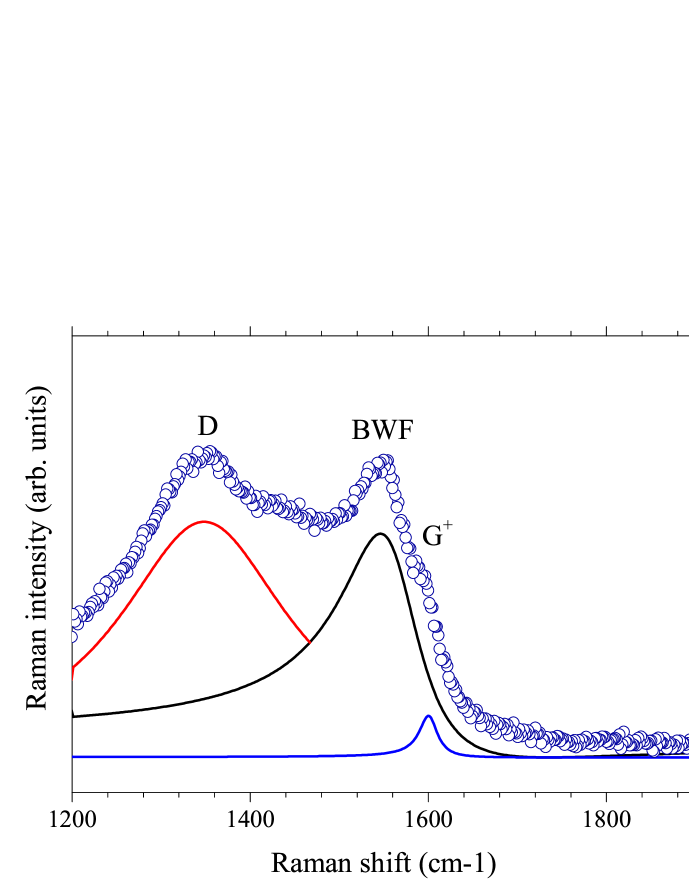
In Fig. 9, a fit to the G-mode range Raman spectrum of the saturation doped sample is shown. Three main components are observed. A broad and strong D mode stems from the defects partially created upon alkali doping. The intensity and the significant asymmetry of the Breit-Wigner-Fano (BWF) component points to saturation doping in our sample. The electron transfer to the SWCNTs, measured by the asymmetry of the BWF component is , a value similar to the one found in Ref. Rao et al. (1997a) (). The G mode at cm-1, is slightly upshifted compared to the G+ mode of the pristine sample ( cm-1, see Fig. 8). In Stage-I graphite (KC8) Chacón-Torres et al. (2012), this mode was assigned to regions with lower potassium doping and its intensity was found to decrease compared to the undoped material.
IV.3 Mapping of graphene BZ at KC7 doping
The cutting lines for the and nanotubes is shown in Fig. 10. When only these two chiralities are considered, a sparsely distributed cutting lines can be recognized. However, our complete calculation is presented in the main text for different chiralities, which results in a homogeneous coverage of the graphene BZ.
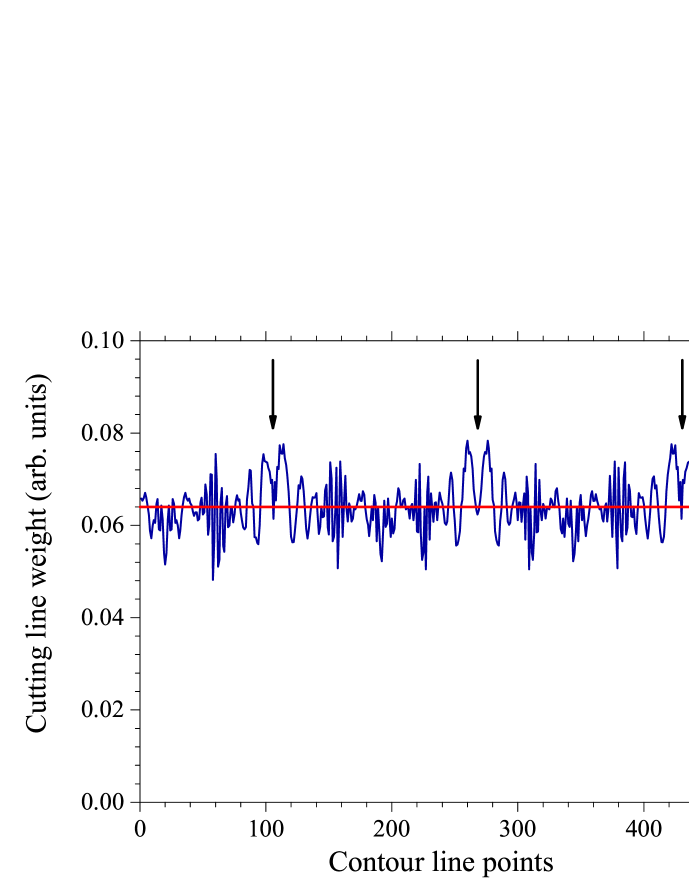
As pointed out in the main text, the homogeneity of the mapping of the graphene Brillouin zone at a given equi-energetic contour line is of interest for the analysis of our proposed model system. Fig. 11. depicts the weight of the coverage of the carbon nanotube ensemble around the equi-energetic contour at the Fermi energy shift corresponding to the KC7 doping. The mapping is found to be homogeneous and it shows small oscillations around the mean value. Interestingly, the trigonal warping does not hinder the C3 symmetry of our illustration. The homogeneity found in this projection is a further proof of the applicability of the ensemble of charge doped SWCNTs for the modeling of biased graphene.
References
- Novoselov et al. (2004) K. S. Novoselov, A. K. Geim, S. V. Morozov, D. Jiang, Y. Zhang, S. V. Dubonos, I. V. Grigorieva, and A. A. Firsov, Science 306, 666 (2004).
- Iijima and Ichihashi (1993) S. Iijima and T. Ichihashi, Nature 363, 603 (1993).
- Bethune et al. (1993) D. S. Bethune, C. H. Kiang, M. S. DeVries, G. Gorman, R. Savoy, and R. Beyers, Nature 363, 605 (1993).
- Castro Neto et al. (2009) A. H. Castro Neto, F. Guinea, N. M. R. Peres, K. S. Novoselov, and A. K. Geim, Rev. Mod. Phys. 81, 109 (2009).
- Hamada et al. (1992) N. Hamada, S. Sawada, and A. Oshiyama, Phys. Rev. Lett. 68, 1579 (1992).
- Mintmire et al. (1992) J. Mintmire, B. Dunlap, and C. T. White, Phys. Rev. Lett. 68, 631 (1992).
- Son et al. (2006) Y.-W. Son, M. L. Cohen, and S. G. Louie, Nature 444, 347 (2006).
- Dresselhaus and Dresselhaus (2002) M. S. Dresselhaus and G. Dresselhaus, Adv. Phys. 51, 1 (2002).
- Grüneis et al. (2009) A. Grüneis, C. Attaccalite, A. Rubio, D. V. Vyalikh, S. L. Molodtsov, J. Fink, R. Follath, W. Eberhardt, B. Büchner, and T. Pichler, Phys. Rev. B 79, 205106 (2009).
- Mak et al. (2008) K. F. Mak, M. Y. Sfeir, Y. Wu, C. H. Lui, J. A. Misewich, and T. F. Heinz, Phys. Rev. Lett. 101, 196405 (2008).
- Rao et al. (1997a) A. M. Rao, E. Richter, S. Bandow, B. Chase, P. C. Eklund, K. A. Williams, S. Fang, K. R. Subbaswamy, M. Menon, A. Thess, R. E. Smalley, G. Dresselhaus, and M. S. Dresselhaus, Science 275, 187 (1997a).
- Rao et al. (1997b) A. Rao, P. Eklund, S. Bandow, A. Thess, and R. Smalley, Nature 388, 257 (1997b).
- Rauf et al. (2004) H. Rauf, T. Pichler, M. Knupfer, J. Fink, and H. Kataura, Phys. Rev. Lett. 93, 096805 (2004).
- Ashcroft and Mermin (1976) N. W. Ashcroft and N. D. Mermin, Solid State Physics (Saunders College Publishing, Philadelphia, 1976).
- Bardeen et al. (1957) J. Bardeen, L. N. Cooper, and J. R. Schrieffer, Phys. Rev. 108, 1175 (1957).
- Zandvliet and van Houselt (2009) H. J. Zandvliet and A. van Houselt, Ann. Rev. Anal. Chem. 2, 37 (2009).
- Slichter (1989) C. P. Slichter, Principles of Magnetic Resonance, 3rd ed. (Spinger-Verlag, New York, 1989).
- Winter (1971) J. Winter, Magnetic resonance in metals, International series of monographs on physics (Clarendon Press, 1971).
- Jánossy et al. (1993) A. Jánossy, O. Chauvet, S. Pekker, J. R. Cooper, and L. Forró, Phys. Rev. Lett. 71, 1091 (1993).
- Chauvet et al. (1994) O. Chauvet, G. Oszlányi, L. Forró, P. W. Stephens, M. Tegze, G. Faigel, and A. Jánossy, Phys. Rev. Lett. 72, 2721 (1994).
- Simon et al. (2005a) F. Simon, A. Kukovecz, C. Kramberger, R. Pfeiffer, F. Hasi, H. Kuzmany, and H. Kataura, Phys. Rev. B 71, 165439 (2005a).
- Simon et al. (2006a) F. Simon, H. Kuzmany, B. Náfrádi, T. Fehér, L. Forró, F. Fülöp, A. Jánossy, L. Korecz, A. Rockenbauer, F. Hauke, and A. Hirsch, Phys. Rev. Lett. 97, 136801 (2006a).
- Simon et al. (2005b) F. Simon, C. Kramberger, R. Pfeiffer, H. Kuzmany, V. Zólyomi, J. Kürti, P. M. Singer, and H. Alloul, Phys. Rev. Lett. 95, 017401 (2005b).
- Galambos et al. (2009) M. Galambos, G. Fábián, F. Simon, L. Ćirić, L. Forró, L. Korecz, A. Rockenbauer, J. Koltai, V. Zólyomi, A. Rusznyák, J. Kürti, N. M. Nemes, B. Dóra, H. Peterlik, R. Pfeiffer, H. Kuzmany, and T. Pichler, Phys. Stat. Sol. B 246, 2760 (2009).
- Murphy et al. (1992) D. W. Murphy, M. J. Rosseinsky, R. M. Fleming, R. Tycko, A. P. Ramirez, R. C. Haddon, T. Siegrist, G. Dabbagh, J. C. Tully, and R. E. Walstedt, J. Phys. Chem. Sol. 53, 1321 (1992).
- Liu et al. (1994) X. Liu, W. C. Wan, S. M. Owens, and W. E. Broderick, J. Am. Chem. Soc. 116, 5489 (1994).
- Liang et al. (2004) F. Liang, A. K. Sadana, A. Peera, J. Chattopadhyay, Z. Gu, R. H. Hauge, and W. E. Billups, Nano Lett. 4, 1257 (2004).
- Kumar et al. (2011) A. Kumar, A. L. M. Reddy, A. Mukherjee, M. Dubey, X. Zhan, N. Singh, L. Ci, W. E. Billups, J. Nagurny, G. Mital, and P. M. Ajayan, ACS Nano 5, 4345 (2011).
- Pichler et al. (2001) T. Pichler, H. Kuzmany, H. Kataura, and Y. Achiba, Phys. Rev. Lett. 87, 267401 (2001).
- Abragam (1961) A. Abragam, Principles of Nuclear Magnetism (Oxford University Press, Oxford, England, 1961).
- Nebendahl et al. (2001) B. Nebendahl, D.-N. Peligrad, M. Pozek, A. Dulcic, and M. Mehring, Rev. Sci. Instrum. 72, 1876 (2001).
- Karsa et al. (2012) A. Karsa, D. Quintavalle, L. Forró, and F. Simon, Phys. Stat. Sol. B 249, 2487 (2012).
- Mintmire and White (1998) J. Mintmire and C. White, Phys. Rev. Lett. 81, 2506 (1998).
- Milnera et al. (2000) M. Milnera, J. Kürti, M. Hulman, and H. Kuzmany, Phys. Rev. Lett. 84, 1324 (2000).
- Jorio et al. (2001) A. Jorio, R. Saito, J. H. Hafner, C. M. Lieber, M. Hunter, T. McClure, G. Dresselhaus, and M. S. Dresselhaus, Phys. Rev. Lett. 86, 1118 (2001).
- Kuzmany et al. (2001) H. Kuzmany, W. Plank, M. Hulman, C. Kramberger, A. Grüneis, T. Pichler, H. Peterlik, H. Kataura, and Y. Achiba, Eur. Phys. J. B 22, 307 (2001).
- Borowiak-Palen et al. (2002) E. Borowiak-Palen, T. Pichler, X. Liu, M. Knupfer, A. Graff, O. Jost, W. Pompe, R. J. Kalenczuk, and J. Fink, Chem. Phys. Lett. 363, 567 (2002).
- Liu et al. (2002) X. Liu, T. Pichler, M. Knupfer, M. S. Golden, J. Fink, H. Kataura, and Y. Achiba, Phys. Rev. B 66, 045411 (2002).
- Saito et al. (2009) T. Saito, S. Ohmori, B. Shukla, M. Yumura, and S. Iijima, Applied Physics Express 2, 095006 (2009).
- Mustonen et al. (2012) K. Mustonen, T. Susi, A. Kaskela, P. Laiho, Y. Tian, A. G. Nasibulin, and E. I. Kauppinen, Beilstein J. Nanotechnol. 3, 692 (2012).
- Chen et al. (2014) G. Chen, Y. Seki, H. Kimura, S. Sakurai, M. Yumura, K. Hata, and D. N. Futaba, Scientific Reports 4, 3804 (2014).
- Simon et al. (2006b) F. Simon, R. Pfeiffer, and H. Kuzmany, Phys. Rev. B 74, 212411(R) (2006b).
- Park et al. (2009) J. S. Park, K. Sasaki, R. Saito, W. Izumida, M. Kalbac, H. Farhat, G. Dresselhaus, and M. S. Dresselhaus, Phys. Rev. B 80, 081402 (2009).
- Chen et al. (2005) G. Chen, C. A. Furtado, U. J. Kim, and P. C. Eklund, Phys. Rev. B 72, 155406 (2005).
- Dóra et al. (2008) B. Dóra, M. Gulácsi, J. Koltai, V. Zólyomi, J. Kürti, and F. Simon, Phys. Rev. Lett. 101, 106408 (2008).
- Dyson (1955) F. J. Dyson, Phys. Rev. 98, 349 (1955).
- Walmsley (1996) L. Walmsley, Journal of Magnetic Resonance, Series A 122, 209 (1996).
- Feher and Kip (1955) G. Feher and A. F. Kip, Phys. Rev. 98, 337 (1955).
- Szirmai et al. (2011) P. Szirmai, G. Fábián, B. Dóra, J. Koltai, V. Zólyomi, J. Kürti, N. M. Nemes, L. Forró, and F. Simon, Phys. Stat. Sol. B 248, 2688 (2011).
- Szirmai et al. (2013) P. Szirmai, G. Fábián, J. Koltai, B. Náfrádi, L. Forró, T. Pichler, O. A. Williams, S. Mandal, C. Bäuerle, and F. Simon, Phys. Rev. B 87, 195132 (2013).
- Fábián et al. (2012) G. Fábián, B. Dóra, A. Antal, L. Szolnoki, L. Korecz, A. Rockenbauer, N. M. Nemes, L. Forró, and F. Simon, Phys. Rev. B 85, 235405 (2012).
- Elliott (1954) R. J. Elliott, Phys. Rev. 96, 266 (1954).
- Yafet (1963) Y. Yafet, Solid State Physics 14, 1 (1963).
- Dóra and Simon (2009) B. Dóra and F. Simon, Phys. Rev. Lett. 102, 137001 (2009).
- Fuhrer et al. (1998) M. S. Fuhrer, M. L. Cohen, A. Zettl, and V. Crespi, Sol. St. Comm. 109, 105 (1998).
- Claye et al. (2000) A. S. Claye, N. M. Nemes, A. Jánossy, and J. E. Fischer, Phys. Rev. B 62, 4845 (2000).
- Luican et al. (2011) A. Luican, G. Li, and E. Y. Andrei, Phys. Rev. B 83, 041405 (2011).
- Liu et al. (2003) X. Liu, T. Pichler, M. Knupfer, and J. Fink, Phys. Rev. B 67, 125403 (2003).
- Simon et al. (2008) F. Simon, M. Galambos, D. Quintavalle, B. Náfrádi, L. Forró, J. Koltai, V. Zólyomi, J. Kürti, N. M. Nemes, M. H. Rümmeli, and et al., Phys. Stat. Sol. B 245, 1975 (2008).
- Samsonidze et al. (2004) G. G. Samsonidze, R. Saito, N. Kobayashi, A. Grüneis, J. Jiang, A. Jorio, S. G. Chou, G. Dresselhaus, and M. S. Dresselhaus, Appl. Phys. Lett. 85, 5703 (2004).
- (61) See supplementary material.
- Barnes (1981) S. E. Barnes, Adv. Phys. 30, 801 (1981).
- Rao et al. (1998) A. Rao, S. Bandow, E. Richter, and P. Eklund, Thin Solid Films 331, 141 (1998).
- Chacón-Torres et al. (2012) J. C. Chacón-Torres, A. Y. Ganin, M. J. Rosseinsky, and T. Pichler, Phys. Rev. B 86 (2012).