Predicting Band Gaps with Hybrid Density Functionals
Abstract
We compare the ability of four popular hybrid density functionals (B3LYP, B3PW91, HSE, and PBE0) for predicting band gaps of semiconductors and insulators over a large benchmark set using a consistent methodology. We observe no significant statistical difference in their overall performance although the screened hybrid HSE is more accurate for typical semiconductors. HSE can improve its accuracy for large large band gap materials –without affecting that of semiconductors– by including a larger portion of Hartree–Fock exchange in its short range. Given that screened hybrids are computationally much less expensive than their global counterparts, we conclude that they are a better option for the black box prediction of band gaps.
pacs:
0000-1111-222Introduction. Band structure calculations are an important application of electronic structure methods in materials science. Due to the cost of computing electronic properties for extended solids, density functional theory (DFT) methods are most often used for such calculations. However, local and semilocal density functional approximations—the most affordable type of Kohn–Sham functionals for solids—badly underestimate the band gaps of semiconductors (the materials of principal interest in practical applications) and insulators due to self-interaction error Perdew1983 ; Mori-Sanchez2008 . Hybrid functionals that incorporate a fraction of nonlocal Hartree–Fock (HF) exchange overcome this issue; however, computing HF exchange in solids is considerably more expensive than evaluating a semilocal density functional. Methods based on the GW approximation can also be used to compute band gaps more accurately, but these techniques are even more expensive than hybrids. A good compromise between cost and accuracy is provided by short-range screened hybrids: functionals that include HF exchange only for the short-range part of the electron–electron interaction, which significantly reduces the cost of evaluating the nonlocal HF part of the exchange as compared to standard hybrids Heyd2003 . This type of functionals have been shown to provide reasonably accurate band gaps for semiconductors, and variants of the Heyd–Scuseria–Ernzerhof Heyd2003 ; Heyd2006 ; Henderson2007 ; Moussa2012 ; Lucero2012 (HSE) short-range hybrid have been widely used for the calculation of semiconductor band gaps for many years Henderson2011 .
A recent study Crowley2016 declares the (standard) hybrid B3PW91 as the winner for resolving the band gap prediction problem for materials design. However, that study did not evaluate the performance of other hybrid functionals using a direct comparison based on a consistent methodology. We here carry out such detailed comparison. We also comment upon the pitfalls that arise when benchmarking density functionals Civalleri2012 ; Savin2014 , as well as aspects of computational efficiency for solids between short-range hybrids like HSE Heyd2004 and standard global hybrids (by global, we mean standard full-range hybrids like B3PW91).
The present study focuses on band gap prediction by both short-range screened and global hybrids. We benchmark popular hybrids like HSE06 (henceforth referred to as simply HSE), B3PW91, B3LYP, and PBE0 (also known as PBEh or PBE1PBE). For this comparison, we utilize a variety of error measures in order to avoid the difficulties and ambiguities that emerge when trying to decide which electronic structure method is best for a determined task Civalleri2012 ; Savin2014 . We find that these four functionals are similarly adequate for the calculation of band gaps; different error measures for HSE, B3PW91, and B3LYP are very close to each other and, while PBE0 tends to overestimate band gaps, the error is systematic and straightforward to correct with a linear fit. If the benchmark set is narrowed to traditional semiconductors then HSE emerges as the winner. In addition, we show that short-range hybrids can describe even large band gap insulators by including an increased portion of HF exchange in the short range only. Due to their lower cost as compared to global hybrids, greater ease to achieve convergence, and overall good performance, we conclude that screened hybrids are a better option for the prediction of band gaps.
Statistical Evaluation. We have carried out band gap calculations for 41 semiconductors and insulators using the Gaussian Gaussian09 suite of programs. The set includes materials from the SC40 dataset Lucero2012 , as well as transition metal oxides (FeO, CoO, NiO, MnO, and VO2) and large band gap salts (NaCl, LiCl, and LiF); the set is similar to that of Ref. 9 (some compounds have been excluded because spin-orbit effects are very large, and we have not used spin-orbit corrections in our calculations). As in that reference, we employed experimental geometries. The basis sets used for SC40 compounds are the same as those of Ref. 7 (which are similar or identical to those in Ref. 9) and the basis sets of Ref. 9 are used for the rest of the compounds. However, while we had no problems to compute band gaps for all these compounds with HSE, some of the global hybrid calculations (particularly PBE0) were too expensive or too difficult to converge, even when starting from a converged HSE guess. Inaccuracies in building an approximate Fock matrix for full-range hybrids make these calculations harder to converge, specially for compounds with smaller gaps Natiello1984 . We were thus unable to obtain results for all 41 compounds with global hybrids. The calculated vs experimental band gaps for the 27 compounds for which all four functionals successfully converged are shown in Figure 1 (see detailed data in the Supporting Information). Various statistics of the error (which we shall discuss in short and are a compilation of those presented in Ref. 10) for these calculations and for all of the compounds for which each functional converged are summarized in Table 1. As shown by the insignificant changes ( 0.01–0.03 eV) in the different error measures when increasing the size of the benchmark set—from 27 to 41 for HSE, 37 for B3PW91, and 34 for B3LYP—, the 27 seven compounds for which all four functionals converged are representative enough to get accurate estimates of the expected deviations from experiment for each functional.
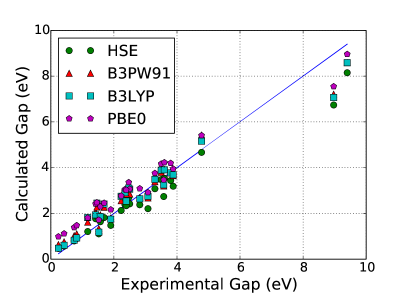
The first thing that is noticeable from Figure 1 is that the four functionals follow the same, fairly linear, trend. Results from HSE, B3LYP, and B3PW91 are close together; the latter two in particular give extremely similar band gaps. This is most likely due to the incorporation of similar amounts of HF exchange: B3LYP and B3PW91 have both 20% full-range nonlocal exchange, while HSE includes 25% but only in the short range. Inclusion of larger fractions of exact exchange increases the calculated band gaps: PBE0 includes 25% full-range HF exchange, which leads to an overestimation of the band gaps as compared to experiment and the other functionals; however, all four functionals underestimate very large insulator band gaps and follow the linear trend mentioned above. In fact, if one fits the data in Figure 1 to a linear function, the slopes for the four hybrids differ by no more than about 3% (see Table 1). HSE, however has a linear fit intercept much smaller than the global hybrids (0.36 eV, as compared to 0.65, 0.63, and 0.95 eV for B3PW91, B3LYP, and PBE0, respectively), indicating better agreement with the experimental data.
| Expt. | HSE | B3PW91 | B3LYP | PBE0 | ||||
| Size of Test Set | 27 | 41 | 27 | 37 | 27 | 34 | 27 | |
| Mean Error | 0 | 0.12 | 0.13 | 0.16 | 0.43 | |||
| Mean Absolute Error | 0 | 0.37 | 0.38 | 0.44 | 0.41 | 0.44 | 0.47 | 0.59 |
| Mean Absolute Percent Error | 0 | 16 | 15 | 27 | 26 | 23 | 25 | 45 |
| Standard Deviation | 0 | 0.55 | 0.54 | 0.53 | 0.51 | 0.56 | 0.56 | 0.50 |
| Median | 0 | 0.33 | 0.29 | 0.19 | 0.27 | 0.63 | ||
| Median Absolute Deviation | 0 | 0.21 | 0.27 | 0.25 | 0.29 | 0.34 | 0.3 | 0.14 |
| Interquartile Range | 0 | 0.49 | 0.50 | 0.57 | 0.55 | 0.69 | 0.73 | 0.43 |
| Linear Fit Slope | 1 | 0.79 | 0.87 | 0.82 | 0.82 | 0.82 | 0.81 | 0.82 |
| Linear Fit Intercept | 0 | 0.36 | 0.23 | 0.65 | 0.65 | 0.63 | 0.70 | 0.95 |
| Kendall Correlation | 1 | 0.85 | 0.88 | 0.85 | 0.88 | 0.84 | 0.85 | 0.86 |
We now discuss the different error measures in Table 1. The first two, the mean error (ME) and the mean absolute error (MAE) are some of the most widely used error measures in quantum chemistry. The ME shows that HSE has a tendency to underestimate band gaps ( eV), while B3PW91 and B3LYP slightly overestimate (0.14 and 0.13 eV, respectively), and PBE0 significantly overestimates (0.43 eV). Based on MAE, HSE predicts band gaps closer to experiment (MAE = 0.37 eV) and is closely followed by B3PW91 and B3LYP (0.44 eV for both). PBE0 has the worst MAE (0.59 eV) mainly due to the aforementioned tendency to overestimate band gaps. In terms of the mean absolute percent error (MAPE), HSE also comes out better (16%) than the other hybrids (27, 23, and 45% for B3PW91, B3LYP, and PBE0 respectively). The lower MAPE of HSE as compared to the other hybrids is more notable than its lower MAE, in part because the average error for HSE is increased substantially by the errors for the high band gap compounds: if the very large band gap (i.e., more than 8 eV) compounds are excluded, the MAEs for HSE, B3PW91, B3LYP, and PBE0 are 0.26, 0.37, 0.36, and 0.57 eV, respectively. Furthermore, if we consider only typical semiconductors for which low-temperature experimental band gaps are available (group 1 of the SC40 set; see Ref. 7), the MAEs (in the same order) are 0.18, 0.32, 0.31, and 0.55 eV, and the MAPEs are 17, 33, 26, and 62. We also report in Table 1 the standard deviations (SDs) of the error; a perfect approximation would have zero ME and zero SD. However, no significant difference is observed between the SDs of the hybrids: the largest difference is 0.05 eV between HSE and PBE0. Note also that the functional with the worst ME and MAE, PBE0, has the smallest SD. Thus, as has been pointed out by Savin et al. Civalleri2012 ; Savin2014 , using different error measures to judge the quality of a functional can lead to contradictory results.
The following three statistics of the deviations from experiment in Table 1, the median, the median absolute deviation, and the interquartile range, are measures taken from robust statistics, which are more resilient to outliers as compared to the ME, MAE, and SD. In statistics, the median is considered a better descriptor of typical outcome than the mean when the latter is biased by outliers; the median absolute deviation measures statistical dispersion (in this case of the error); and the interquartile range measures the variability in a set of data. For a method that perfectly predicts band gaps, all these values must be zero. We observe, as before, that different functionals provide the best results for different error measures: HSE has the best median and PBE0 the worst, but the latter has the best median absolute deviation and interquartile range. Note, however, that the median absolute deviation and the interquartile range of HSE is only 0.06 eV larger than that of PBE0, while the median of HSE is 0.53 eV closer to zero than the median of PBE0. Thus, overall, measures from robust statistics favor HSE the most.
Apart from the various statistics analyzed so far, an important feature of a quantum chemical method is its ability to correctly reproduce trends. A trend can be defined by a linear fit as follows:
| (1) |
Table 1 shows the values of the slope and the intercept from this linear fit for the band gaps calculated by the four hybrid functionals. Ideally, and . Judging by the values of the slopes, the four hybrids have a similar quality for predicting trends: the slopes are all around 0.80 and do not differ by more than about 3%. However, PBE0 has a substantially higher intercept (0.95 eV) than other methods, whereas HSE is closest to zero (0.36 eV), and B3PW91 and B3LYP are in between that ( 0.65 eV). Hence, with respect to trends, all functionals are similar but HSE appears to be slightly better again.
Lastly, let us consider a measure of rank correlation to judge the quality of predicted band gaps: the Kendall rank correlation coefficient. In order to construct this coefficient, we first need to define the pairs , where and are the experimental and calculated gaps, respectively. The pairs and and then said to be concordant if and , or if and ; tied if ; and discordant otherwise. The Kendall correlation coefficient is then
| (2) |
where is the number of concordant pairs, the number of discordant pairs, and and the number of ties in the experimental and calculated set of band gaps, respectively. Thus, measures the similarity in the orderings of two datasets: a value of 1 indicates perfect agreement in the ordering, whereas indicates complete disagreement. It can, in a way, be considered a measure of qualitative agreement. We see in Table 1 that all four hybrids provide essentially the same value (0.85), and thus have all similarly good qualitative agreement with experiment.
| HSE | B3PW91 | B3LYP | PBE0 | |
|---|---|---|---|---|
| HSE | – | 42(0.61) | 84(0.31) | 128(0.14) |
| B3PW91 | 42(0.61) | – | 18(0.83) | 227(0.01) |
| B3LYP | 84(0.31) | 18(0.83) | – | 214(0.01) |
| PBE0 | 128(0.14) | 227(0.01) | 214(0.01) | – |
One could also analyze the distribution of the error of pairs of methods, and ask whether the distributions differ statistically. This is done in Table 2 using the Wilcoxon signed-rank test for the absolute error data. The null hypothesis of the test is that the difference between pairs (of absoulte errors for two methods) follows a symmetric distribution around zero because each set has the same statistical distribution, resulting in similar positive and negative differences; the null hypothesis is rejected when the test statistic is greater than a certain determined by the sample size and level of confidence. A -value associated with the test represents the probability of obtaining the observed distribution, or a more asymmetric distribution around zero, assuming that the null hypothesis is true; -values larger than 0.05 have been related with a lack of meaningful difference in the context of method comparison Skone2016 . Based on both the test statistic and its associated -values, the results in Table 2 indicate no significant statistical difference (considering a commonly used 95% confidence interval) in the absolute error distributions of HSE, B3PW91, and B3LYP. The statistics suggest, however, that differences exist between these three functionals and PBE0; the -values also imply significant difference between PBE0 and both B3PW91 and B3LYP. If the same analysis is carried out for signed error and absolute percentage error, all pairs of functionals come out as being statistically different except for the B3PW91/B3LYP pair. The results of the Wilcoxon signed-rank test support the more qualitative comparison of the ME, MAE, and MAPE discussed above, and put such a discussion in a rigorous statistical framework.
On the underestimation of large band gaps. As shown here and in other works Civalleri2012 , even hybrid functionals underestimate band gaps when these are considerably large. No single hybrid with a fixed amount of HF exchange can accurately describe small and large band gap materials simultaneously: the fraction of nonlocal exchange needed in a solid depends on its dielectric function Skone2016 ; Marques2011 ; Skone2014 . Increasing the percentage of HF exchange in a hybrid functional increases the band gap, which allows for the description of larger band gap insulators, but causes overestimation of semiconductor band gaps. A way to optimize the fraction of HF exchange in hybrid functionals based on a local estimator of the dielectric function has been proposed in Ref. 16. With this procedure, one obtains, for example, that HSE predicts a band gap 22.29 eV for solid Ne (which has an experimental gap of 21.70 eV), while still giving good semiconductor band gaps (e.g., 0.82 eV for Ge, compared to 0.74 eV from experiment) Marques2011 . The method is applicable to global hybrids too: an optimized PBE0 gives gaps of 21.88 and 0.68 eV for Ne and Ge, respectively, compared to 15.14 and 1.31 eV predicted by standard PBE0 Marques2011 .
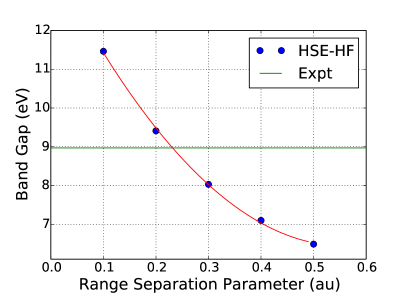
As another example of how even screened hybrids can describe large band gap insulators, consider the HSE-HF functional of Ref. 18, which is simply HSE06 but with 100% exact exchange in the short range. Figure 2 shows the band gap of NaCl calculated by HSE-HF as a function of the range separation parameter, . The smaller this parameter is, the larger the fraction of HF exchange incorporated. At small values, the band gap is overestimated; at – au the value is close to experiment; and at higher values the gap is underestimated. This is just one example, but this behavior is very general and this observation is in agreement with previous works showing that long-range HF exchange is seldom necessary and that the physics behind the more realistic properties computed with hybrid functionals is the reduction of the self-interaction error by incorporation of substantial amounts of exact exchange Garza2014 ; Henderson2009 . Thus, a short-range screened hybrid can describe even large band gaps insulators and one does not need to resort to more expensive global hybrids. Note also that although, in principle, long-range HF exchange should be included when describing solids, its effect should be mostly canceled by correlation. Inadequate treatment of correlation is the reason why the HF method and typical global hybrid functionals cannot describe metallic behavior. Hence, it is convenient to eliminate long-range exchange and use a screened hybrid to more adequately describe the physics of an extended solid.
Additional Considerations. We have focused on band gaps calculated using experimental geometries and observed little overall difference between the different hybrids tested. However, other properties, including geometries, can be significantly different. For example, the MAE of B3LYP for lattice constants (0.053 Å) is more than twice larger than the MAEs of HSE and PBE0 (0.024 and 0.022 Å, respectively) Paier2007 . Atomization energies of solids are also significantly worse when calculated with B3LYP (MAE = 0.59 eV) as compared to HSE and PBE0 (MAE 0.26 eV); B3PW91 improves over B3LYP, but it is not as good as the latter two functionals (MAE = 0.39 eV) Paier2007 . The failure of B3LYP is attributed to not correctly reproducing the homogeneous electron gas behavior, and B3PW91 improves upon it by fulfilling this limit Paier2007 .
Even when considering only band gaps and using experimental geometries, another important consideration arises: the quality of the experimental data. In particular for the band gaps, there can be a significant variability depending on factors such as the method of measurement and temperature (which sometimes is not reported). For example, band gap values of 3.6, 2.6, 2.5, 2.1, 2.7, and 5.43 eV have been reported for CoO (see Supporting Information of Ref. 9). This variability leads to the question: What value should one use as reference? One can average of all these values (3.16 eV) and obtain very good agreement with B3PW91 (calculated here as 3.06 eV) Crowley2016 . However, this approach may not be appropriate in this case: the experimentally reported 5.43 eV value is most likely the direct gap, whereas the smaller values correspond to the indirect gap Gillen2013 . Even if one decided to follow this methodology, the standard deviation of the six experimental band gap values for CoO is 1.22 eV, and hence all functionals predicting values in the wide range between 1.90 and 4.34 eV would have to be considered to be in agreement with experiment. The often cited value of 2.5 eV for the CoO band gap is in reasonable agreement with the HSE indirect gap of 2.82 eV. An additional consequence of the variability in the reference data is that small differences in the average errors of different functionals are not really meaningful. Thus, based on, say, the MAEs in Table 1, it would be hard to tell whether HSE, B3PW91, or B3LYP are truly closer to experiment. Furthermore, adding to the level of uncertainty, experimental reference band gaps are assumed to be an ideal measurement of the fundamental band gap (i.e., the difference between the ionization potential and electron affinity). However, this is not always the case Civalleri2012 , whereas the calculation of generalized Kohn–Sham band gaps (as done here) is a rigorous and honest approximation to the fundamental band gap Perdew2016 . Considering all of this, and the fact that the use of different, finite basis sets leads to further changes in predicted band gaps, it would be unreasonable to assert that a certain functional is decidedly better than another for band gap predictions if the differences in the error measures are small (e.g., less than about 0.1 eV or, depending on the case, even more than this, as shown by the CoO example above). Statistical methods such as the ones used here should be considered for assessing whether the differences are significant.
The importance of careful inspection of reference data from the literature and the use of a consistent methodology in benchmark calculations applies not only to density functionals. The GW method, for example, is quite sensitive to a number of variables: the input (reference) wavefunction, number of empty bands included, dielectric matrix energy cut-off, etc. To illustrate this, consider the GW band gaps of ZnO used as reference to compare against B3PW91 in the Supporting Information document of Ref. 9. The experimental band gap is 3.44 eV; the GW gaps in the literature vary from 0.1 to 4.61 eV. The worst value, 0.1 eV, was computed using the static Coulomb hole and screened exchange (COHSEX) approximation, which is generally not recommended for quantitative calculations Huser2013 . Shih et al. Shih2010 report that conventional GW approaches can provide accurate estimates of the ZnO band gap if convergence in the evaluation of the Coulomb-hole self-energy is carefully resolved. Further examples with large variability (more than 1 eV) in the GW gaps cited in Ref. 9 include Si (0.56–1.91), GaAs (1.09–3.77), SiC (1.8–2.88), AlP (1.88–3.1), CdS (2.11–3.41), CoO (2.4–4.78), GaN (2.75–3.82), MnO (2.34–4.39), ZnS (1.52–4.15), NiO (1.74–5.0), diamond (5.59–6.99), LiCl (8.75–10.98), and LiF (13.13–16.17) among others. It is worth pointing out here that Ref. 9 concluded that B3PW91 was superior to other functionals by comparing against GW, assuming that GW is more accurate than these (other) functionals. However, as shown here, such comparisons are not straightforward and B3PW91 does not appear to have any decisive advantage over other commonly used hybrids when the direct comparison is done using identical geometries, basis sets, etc.
The effects of spin-orbit coupling should also be mentioned here. We have not included these effects in our calculations, as such corrections are not widely available in commercial codes. Nevertheless, our conclusions are not affected by neglecting spin-orbit coupling because of, mainly, two reasons. The first one is that we have not included compounds for which spin-orbit coupling effects are important in our test set. The second one is related to the fact that spin-orbit corrections apply in the same way to all functionals: i.e., if we use experimental spin-orbit coupling values to correct the band gaps, the shift in the error is the same for every functional. Here, we observe that various hybrids provide rather similar results, with no clear winner in all cases and a different method being “better” depending on the error measure. After spin-orbit coupling corrections, the functionals will still provide similar results because these corrections are identical for all of them.
Lastly, an important consideration for calculations on extended systems is computational cost. The increase in CPU time when going from a semilocal functional, to a screened hybrid, to a global hybrid depend on the type of basis set employed. Here, we have used codes based on localized gaussian basis sets, which are not as efficient for semilocal functionals but have a less dramatic increase in cost for hybrids as compared to plane-wave based codes. This means that, in plane-wave implementations of DFT, screened hybrids are more strongly favored over global hybrids concerning CPU time.
Conclusions. After carrying out a thorough comparison between four popular hybrid functionals for predicting band gaps using a consistent methodology in the calculations, we did not find truly significant differences in the overall performance of three of them: HSE, B3PW91, and B3LYP (the latter two in particular give very similar gaps). PBE0 tends to overestimate band gaps but the error is systematic and the statistical analysis shows that all four functionals provide good qualitative agreement with the reference data. Nevertheless, our results do suggest that HSE is more accurate for typical semiconductors. The analysis here shows that there is nothing particularly remarkable about the band gaps predicted by B3PW91 Crowley2016 when they are compared to other global hybrids using a similar amount of HF exchange. We have also shown how screened hybrids can incorporate larger fractions of HF exchange in the short range to compensate for the effects that result from screening in large gap insulators, and ways to tune the mixing parameter that solve this problem have also been proposed in the literature Skone2016 ; Marques2011 ; Skone2014 . Global hybrids also underestimate very large band gaps, and can too be modified to include more exchange to solve this problem, but at a higher computational cost. Thus, based on cost and accuracy considerations, we recommend HSE for semiconductors and tuned versions of HSE for larger gap cases.
In summary, screened hybrids can describe the same type of problems that global hybrids do, but in addition, they provide access to modelling metallic behavior, have a much lower computational cost, and are easier to converge. Our conclusion is therefore that a screened hybrid like HSE is preferable over global hybrids for the black box prediction of band gaps of novel materials.
Acknowledgements. This work was supported as part of the Center for the Computational Design of Functional Layered Materials, an Energy Frontier Research Center funded by the US Department of Energy, Office of Science, Basic Energy Sciences under Award [# DE-SC0012575]. G.E.S. is a Welch Foundation chair (C-0036). We also thank the authors of Ref 15 for bringing their paper to our attention and suggesting the use of the Wilcoxon signed-rank test.
Supporting Information Available. Details about the calculations, as well as band gap data used in this work.
References
- (1) Perdew, J. P.; Levy, M. Physical Content of the Exact Kohn–Sham Orbital Energies: Band Gaps and Derivative Discontinuities. Phys. Rev. Lett. 1983, 51, 1884–1887.
- (2) Mori–Sáńchez P.; Cohen, A. J.; Yang, W. Localization and Delocalization Errors in Density Functional Theory and Implications for Band-Gap Prediction. Phys. Rev. Lett. 2008, 100, 146401.
- (3) Heyd, J.; Scuseria, G. E.; Ernzerhof, M. Hybrid Functionals Based on a Screened Coulomb Potential. J. Chem. Phys. 2003, 118, 8207–8215.
- (4) Heyd, J.; Scuseria, G. E.; Ernzerhof, M. Erratum: “Hybrid functionals based on a screened Coulomb potential”. J. Chem. Phys. 2006, 124, 219906.
- (5) Henderson, T. M.; Izmaylov, A. F.; Scuseria, G. E.; Savin, A. The Importance of Middle-Range Hartree–Fock-type Exchange for Hybrid Density Functionals. J. Chem. Phys. 2007, 127, 221103.
- (6) Moussa, J. E.; Schultz, P. A.; Chelikowsky, J. R. Analysis of the Heyd-Scuseria-Ernzerhof Density Functional Parameter Space. J. Chem. Phys. 2012, 136, 204117.
- (7) Lucero, M. J.; Henderson, T. M.; Scuseria, G. E. Improved Semiconductor Lattice Parameters and Band Gaps from a Middle-Range Screened Hybrid Exchange functional. J. Phys.: Condens. Matter 2012, 24, 145504.
- (8) Henderson, T. M.; Paier, J.; Scuseria, G. E. Accurate treatment of solids with the HSE Screened Hybrid. Phys. Status Solidi B 2011, 248, 767–774.
- (9) Crowley, J. M.; Tahir-Kheli, J.; Goddard III, W. A. Resolution of the Band Gap Prediction Problem for Materials Design. J. Chem. Phys. Lett. 2016, 7, 1198–1203.
- (10) Civalleri, B.; Presti, D.; Dovesi, R.; Savin, A. On Choosing the Best Density Functional Approximation. Chem. Modell. 2012, 9, 168–185.
- (11) Savin, A.; Johnson, E. Judging Density-Functional Approximations: Some Pitfalls of Statistics. Top. Curr. Chem. 2015, 365, 81–96.
- (12) Heyd, J. Screened Coulomb Hybrid Density Functionals. Ph.D. Dissertation, Rice University, Houston, TX, 2004.
- (13) Frisch, M. J.; Trucks, G. W.; Schlegel, H. B.; Scuseria, G. E.; Robb, M. A.; Cheeseman, J. R.; Scalmani, G.; Barone, V.; Mennucci, B.; Petersson, G. A. et al. Gaussian 09, Revision A.02; Gaussian Inc.: Wallingford, CT, 2009.
- (14) Natiello, M. A.; Scuseria, G. E. Convergence properties of Hartree–Fock SCF Molecular Calculations. Int. J. Quantum Chem. 1984, 26, 1039.
- (15) Skone, J. H.; Govoni, M.; Galli, G. Nonempirical Range-Separated Hybrid Functionals for Solids and Molecules. Phys. Rev. B 2016, 93, 235106.
- (16) Marques, M. A. L.; Vidal, J.; Oliveira, M. J. T.; Reining, L.; Botti, S. Density-based Mixing Parameter for Hybrid Functionals, Phys. Rev. B 2011, 83, 035119.
- (17) Skone, J. H.; Govoni, M.; Galli, G. Self-Consistent Hybrid Functional for Condensed Systems, Phys. Rev. B 2014, 89, 195112.
- (18) Garza, A. J.; Wazzan, N. A.; Asiri, A. M.; Scuseria, G. E. Can Short- and Middle-Range Hybrids Describe the Hyperpolarizabilities of Long-Range Charge-Transfer Compounds? The Journal of Physical Chemistry A 2014 118, 11787–11796.
- (19) Henderson, T. M.; Izmaylov, A. F.; Scalmani, G.; Scuseria, G. E. Can Short-Range Hybrids Describe Long-Range-Dependent Properties? J. Chem. Phys. 2009, 131, 044108.
- (20) Paier, J.; Marsman, M.; Kresse, G. Why Does the B3LYP Hybrid Functional Fail for Metals? J. Chem. Phys. 2007, 127, 024103.
- (21) Gillen, R.; Robertson, J. Accurate Screened Exchange Band Structures for the Transition Metal Monoxides MnO, FeO, CoO and NiO. J. Phys.: Condens. Matter 2013, 25, 165502.
- (22) Perdew, J. P.; Yang, W.; Burke, K.; Yang, Z.; Gross, E. K. U.; Scheffler, M. Scuseria, G. E.; Henderson, T. M.; Zhang, I. Y.; Ruzsinszky, A.; Peng, H.; Sun, J. Understanding Band Gaps of Solids in Generalized Kohn–Sham Theory. 2016, arXiv:1608.06715. arXiv.org e-Print archive. https://arxiv.org/abs/1608.06715 (accessed Oct 2, 2016).
- (23) Hüser, F; Olsen, T.; Thygesen, K. S. Quasiparticle GW Calculations for Solids, Molecules, and Two-Dimensional Materials. Phys. Rev. B 2013, 87, 235132.
- (24) Shih, B.-C.; Xue, Y.; Zhang, P.; Cohen, M. L.; Louie, S. G. Quasiparticle Band Gap of ZnO: High Accuracy from the Conventional G0W0 Approach. Phys. Rev. Lett. 2010, 105, 146401.