Investigation of the energy dependence of the orbital light curve in LS 5039
Abstract
LS 5039 is so far the best studied -ray binary system at multi-wavelength energies. A time resolved study of its spectral energy distribution (SED) shows that above 1 keV its power output is changing along its binary orbit as well as being a function of energy. To disentangle the energy dependence of the power output as a function of orbital phase, we investigated in detail the orbital light curves as derived with different telescopes at different energy bands. We analysed the data from all existing INTEGRAL/IBIS/ISGRI observations of the source and generated the most up-to-date orbital light curves at hard X-ray energies. In the -ray band, we carried out orbital phase-resolved analysis of Fermi-LAT data between 30 MeV and 10 GeV in 5 different energy bands. We found that, at 100 MeV and 1 TeV the peak of the -ray emission is near orbital phase 0.7, while between 100 MeV and 1 GeV it moves close to orbital phase 1.0 in an orbital anti-clockwise manner. This result suggests that the transition region in the SED at soft -rays (below a hundred MeV) is related to the orbital phase interval of 0.5–1.0 but not to the one of 0.0–0.5, when the compact object is "behind" its companion. Another interesting result is that between 3 and 20 GeV no orbital modulation is found, although Fermi-LAT significantly (18) detects LS 5039. This is consistent with the fact that at these energies, the contributions to the overall emission from the inferior conjunction phase region (INFC, orbital phase 0.45 to 0.9) and from the superior conjunction phase region (SUPC, orbital phase 0.9 to 0.45) are equal in strength. At TeV energies the power output is again dominant in the INFC region and the flux peak occurs at phase 0.7.
keywords:
gamma-rays: stars, X-rays: individual: LS 50391 Introduction
-ray binaries are a special class of X-ray binaries. They emit high-energy radiation at TeV and/or GeV energies and consist of a compact object (neutron star or black hole) and a high-mass OB star. LS 5039 (Motch et al., 1997; Aharonian et al., 2005a) is one of a few known such systems in our Galaxy. The others are PSR B1259-63 (Johnston et al., 1992; Aharonian et al., 2005b), LS I +61∘303 (Albert et al., 2006, 2009), HESS J0632+057 (Aharonian et al., 2007) and 1FGL J1018.6-5856 (Corbet et al., 2011; Abramowski et al., 2012). See Dubus, (2013) for a recent review.
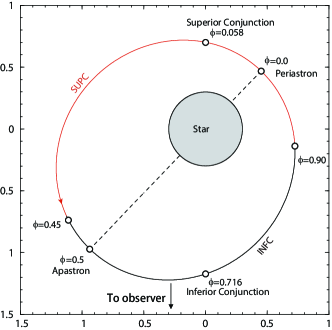
LS 5039 is known as a relatively compact binary system for which the separation between the two objects is 0.1–0.2 AU. The compact star is moving around an O6.5V main-sequence star with a period days and a moderate eccentricity of (Casares et al., 2005). A schematic view of the binary system is shown in Figure 1.
LS 5039 is so far the best observed -ray binary at high energies. The source was observed by Suzaku at 1–10 keV and 15–40 keV, showing stable orbital light curves over a period of 6 days (Takahashi et al., 2009). At 1–10 keV a broad peak, covering the orbital phase between 0.5 and 0.75, is seen in the orbital light curve; the 15–40 keV data look very similar. At hard X-rays (25–200 keV) the INTEGRAL observations show a moderate orbital modulation with a peak around phase 0.75 (Hoffmann et al., 2009). COMPTEL/CGRO observations also find the flux to peak near phase 0.75, with a maximal power output between 1 and 30 MeV (Collmar & Zhang,, 2014). In contrast, in the 100 MeV – 10 GeV energy band Fermi-LAT observations show that the location of the orbital flux peak is around phase 1.0 (Abdo et al., 2009), while at TeV energies H.E.S.S. observed it to be again at the phase region around 0.7 (Aharonian et al., 2006).
The SEDs at 1 keV–1 TeV (Figure 9 of Collmar & Zhang,, 2014) for the inferior conjunction phase (INFC) and the superior conjunction phase (SUPC) suggest that the relative contribution of the power output between INFC and SUPC evolves with energy with especially a change in dominance of these two broad regions around a few hundred MeV and a few GeV. In order to obtain a clearer picture of the possible underlying mechanisms, especially in these energy intervals, we have carried out a detailed analysis on the energy dependence of the orbital light curves, using the available observational data for energies above 1 keV. Our analysis is based on the most up-to-date dataset of INTEGRAL/IBIS/ISGRI between 20 and 200 keV (chosen among other reasons for comparison with Hoffmann et al. (2009)), and the entire Fermi-LAT data between 30 MeV and 10 GeV; we use them in combination with already published Suzaku and H.E.S.S. data.
The paper is organized with the observations and data analysis in Section 2, the results in Section 3 and finally the discussion in Section 4.
2 Observations and data analysis
INTEGRAL (International Gamma-Ray Astrophysics Laboratory) was launched in 2002 October into an elliptical orbit with a period of 3 days. The upper part of the coded-mask IBIS instrument onboard INTEGRAL, the INTEGRAL Soft Gamma-Ray Imager (ISGRI), consists of a Cadmium-Telluride detector array. It is sensitive in the energy range 20 keV – 200 keV. More details about INTEGRAL, IBIS, and ISGRI can be found in Winkler et al. (2003), Ubertini et al. (2003), and Lebrun et al. (2003) respectively.
The observations of INTEGRAL are subdivided into so-called Science Windows (ScWs), each with a typical duration of a few kiloseconds. By selecting offset angles to the source of less than 10 degrees and exposures of larger than 100 s, 4973 public ScWs were selected for LS 5039 in the data archive available at the INTEGRAL Scientific Data Center (ISDC111http://www.isdc.unige.ch/). The data reduction was performed by using the standard Off-line Scientific Analysis (OSA), version 10.1, to the image step IMA. We set OBS1PixSpread=0 to optimise the flux and signal-to-noise ratio (SNR) evaluation.
The LAT (the Large Area Telescope) onboard Fermi is an electron-positron pair production telescope operating at energies from MeV to GeV. More details about Fermi-LAT are given in Atwood et al. (2009).
The Fermi-LAT data reported in this paper spanned a period from 2008 August 4 (HJD 2454683.15) to 2015 March 3 (HJD 2457087.79). These data were reduced and analysed using the Fermi Science Tools v9r33p0 package. Reprocessed Pass 7 data222P8 data became available after the analysis was done and a quick inspection indicates no impact on the conclusions. classified as source events were used. Time intervals when the region around LS 5039 was observed at a zenith angle less than 105∘ were selected. The cut was used to avoid the contamination from the earth limb -rays, which are produced by cosmic rays interacting with the upper atmosphere. In our analysis, the standard pipeline, and the P7REP_SOURCE_V15 instrument response functions (IRFs) were adopted. In producing the TS map, the Galactic diffuse model (gll_iem_v05_rev1.fit) and the isotropic background (iso_iem_v05.txt), as well as the third Fermi/LAT catalog (3FGL, Acero et al. (2015)) were properly accounted for.
3 Results
3.1 Orbital phase uncertainty
When combining data across many years, the uncertainties in the orbital phase determination can become significant and induce phase diffusion in orbital light curves. To compare with previous studies, we have taken as a baseline the orbital ephemeris derived by Casares et al. (2005) with d and (HJD). Note that Hadasch et al. (2012), based on 2.5 years of Fermi-LAT data, independently derived a period of d, consistent with the previous result.
Our INTEGRAL measurements started 767 days and ended 5018 days later than , which amounts to at most 0.030.22 uncertainty in phase due to the precision in this ephemeris (see Collmar & Zhang, (2014)). The Fermi data used in this analysis cover a time period from HJD 2454683.15 to HJD 2457087.79, thus starting 2740 days and ending 5145 days after , introducing at most in phase uncertainty.
In order to check for a possible phase shift we have analysed separately the Fermi-LAT data of each of the seven years in the 200 MeV–3 GeV band. The resulting orbital light curves are shown in Figure 2 (top panel).
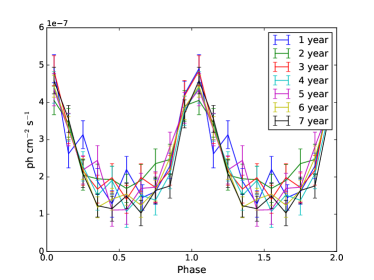
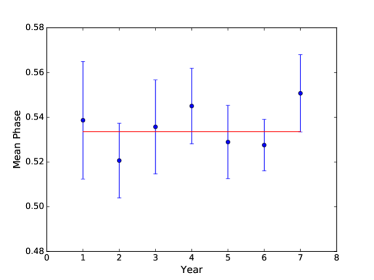
By fitting each derived light curve of the 7-year data of Fermi-LAT with a Gaussian model, we obtained the phase for the minimum flux in each light curve. Figure 2 (bottom panel) shows the evolution of this phase value during the time period covered by Fermi-LAT observations. A constant fit to these data points resulted in a reduced of 0.41 (6 degrees of freedom), thus no significant phase shift was found.
If we alternatively take the peak flux phase values derived in the first year and the last year of Fermi-LAT data, we obtain an insignificant phase shift of . From this we take an upper limit of as conservative error estimate, far less than the phase shift of roughly 0.1 estimated with the error in the ephemeris as reported in Casares et al. (2005).
| Telescope | Phase Uncertainty | Updated Uncertainty |
|---|---|---|
| Suzaku | 0.105 | 0.043 |
| INTEGRAL | 0.03–0.22 | 0.012–0.091 |
| COMPTEL | 0.017–0.15 | 0.007–0.062 |
| Fermi-LAT | 0.12–0.22 | 0.049–0.091 |
| H.E.S.S. |
3.2 Skymaps and multi-wavelength light curves
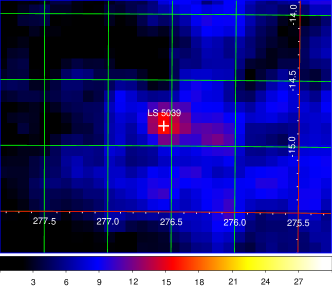
By summing over all the INTEGRAL/IBIS/ISGRI data, we first derived the skymaps at 20–60 keV and 60–200 keV, respectively. As shown in Figure 3, the source is detected with detection significance levels of 18.3 and 15.1, respectively, based on 6.62 Ms of data, which largely improves the detection significance 7.7 of previously reported by Hoffmann et al. (2009) based on 2.99 Ms of data at 25–60 keV and using OSA version 7. In order to produce the orbital light curves in these two energy bands, we took the source flux extracted from the source position in individual ScWs, and then folded the flux into a light curve of 10 phase bins using the orbital period derived above. The derived orbital light curves are shown in Figure 5.
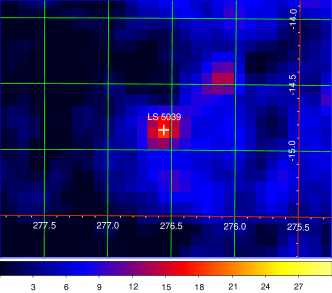
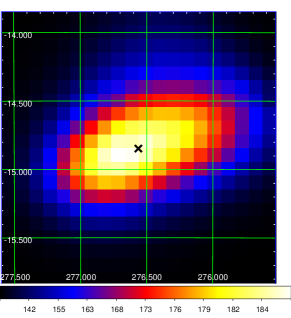
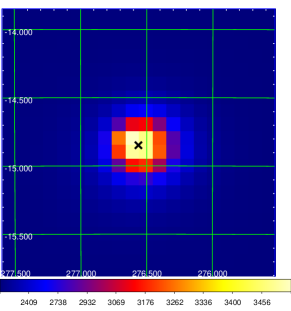
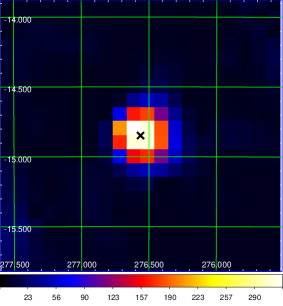
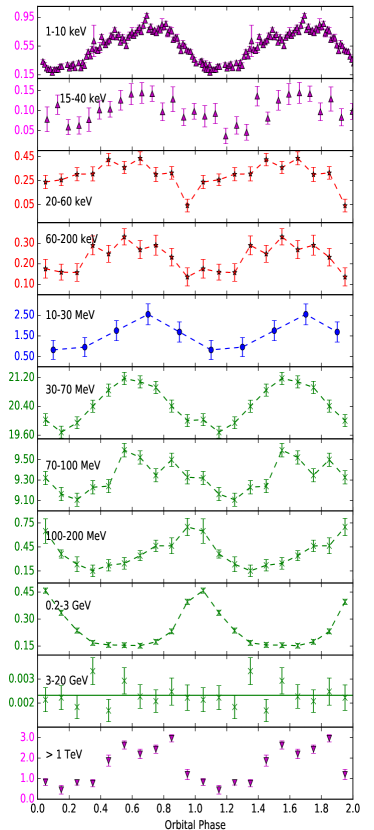
The Fermi data were first summed into the same 10 phase bins using the orbital period. The light curves were generated in five energy bands: 30–70 MeV, 70–100 MeV, 100–200 MeV, 0.2–3 GeV and 3–20 GeV. Limited by the Fermi Science Tools v9r33p0 package, we could not do the likelihood analysis in both the 30–70 MeV and 70–100 MeV bands. Instead we used the command gtexposure to produce the light curves, assuming a power-law spectrum with a photon index of , similar to the analysis performed in the earlier Fermi-LAT paper (Abdo et al., 2009). The corresponding light curves are shown in Figures 5. While the phase peak is around 0.5–0.75 at energies below 100 MeV, the peak flux in orbital phase moves toward 0.85–0.95 at 100–200 MeV and to around 1.0 at 0.2–3.0 GeV. Although the TS (Test Statistic) value is about 323 at 3–20 GeV (three TS maps of these five energy bands are shown in Figure 4), there is no hint for an orbital modulation showing up in this light curve.
With the orbital light curves from INTEGRAL at hard X-rays and from Fermi at above 30 MeV, we were able to investigate the evolution of the orbital light curve as function of energy over a broad range. Figure 5 shows these new light curves together with the already published ones: at 1–10 keV and 15–40 keV by Suzaku (observed in September 2007, Takahashi et al. (2009)), 1–30 MeV by COMPTEL/CGRO (between April 1991 – June 2000, Collmar & Zhang, (2014)), and above 1 TeV by H.E.S.S. (during 2004–2005, Aharonian et al. (2006)).
In order to quantitatively estimate the phase shift in different energy bands, we did a cross-correlation analysis, using the TeV (H.E.S.S.) light curve – where the phase of the peak flux is around 0.7 – as reference. We then sampled the light curves in the other energy bands, and calculated the cross-correlation as function of phase shift for each sampled light curve with respect to the reference light curve. The cross-correlation is described by,
| (1) |
where is the derived cross-correlation value, and are two data series. Then we fitted the histogram of with a Gaussian, take the mean as the shift, and the sigma as the error. The results are shown in Table 2.
| Telescope | Energy | Shift | Stat.Uncertainty |
| Suzaku | 1–10 keV | 0.039 | 0.010 |
| 15–40 keV | 0.018 | 0.083 | |
| INTEGRAL | 20–60 keV | 0.178 | 0.031 |
| 60–200 keV | 0.102 | 0.050 | |
| COMPTEL | 10–30 MeV | 0.001 | 0.065 |
| Fermi-LAT | 30–70 MeV | 0.077 | 0.026 |
| 70–100 MeV | -0.037 | 0.025 | |
| 100–200 MeV | -0.214 | 0.019 | |
| 0.2–3 GeV | -0.346 | 0.031 | |
| H.E.S.S. | > 1 TeV | 0 | 0 |
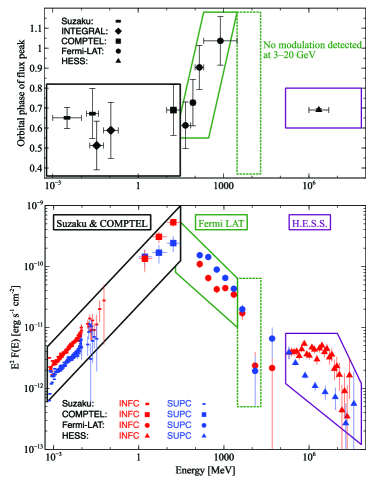
Combining the results shown in Table 2 and Table 1, we show the derived orbital phases of the flux peaks in Figure 6 (top panel), including the phase uncertainties introduced by the orbital ephemeris. A phase regression from 0.6 toward 1.0 is visible at energies above 100 MeV. Below about 1 MeV and above about 1 TeV the flux peak occurs at an average value of 0.68 in orbital phase.
4 Discussion
4.1 Multi-wavelength variability
We have studied the energy dependence of the flux peak in orbital phase, and present for the first time an overall description on phase evolution across the entire high energy band. Our results show that, at X-ray and soft -ray (1 keV–30 MeV) energies the flux peak is located around the region of inferior conjunction, when the compact object is in front of the massive star. At higher energy -rays, from a few hundreds of MeV to about GeV, the flux peak in orbital light curves moves from phase 0.6 toward 1.0 (from around apastron to periastron). Generally, the orbital light curves show a single-peaked profile with a broad peak. Interestingly, the modulation disappears at energies of a few GeV (3–20 GeV), but shows up again in the TeV band with a flux peak located at around apastron to inferior conjunction, quite similar to the lowest energies.
This orbital light curve behaviour connects nicely to the high-energy SED of LS 5039 as shown in Figure 6. The SEDs of SUPC and INFC are subdivided into 4 boxes, each chosen to correspond to the orbital phase evolution as a function of energy as described above. In the 1 keV–30 MeV box, the power output of INFC is larger than that of SUPC, which matches well in the orbital light curve to a broad peak around apastron. SEDs in the 30 MeV–3 GeV box seem more complex due to the variability of the dominance of the power output between SUPC and INFC. The corresponding orbital light curves show that this may be related to the evolution of the orbital light curve with energies: the broad flux peak is no longer located solely at SUPC or INFC, but moves all the way in the phase from 0.6 to 1.0. In the third box at GeV energies the two SED contributions become equal in strength, and the light curve shows no modulation at all. In the last box, at TeV energies, the emission from the INFC region becomes again dominant, consistent with an orbital light curve where the flux peaks again around apastron.
The nature of the compact object in LS 5039, i.e., whether is is a neutron star or a black hole is still a matter of debate. However, it is generally thought that the system harbours a spinning neutron star, and that the high energy emission is generated via a shock between the stellar wind of the companion and the pulsar wind of the neutron star(Maraschi et al., 1981). Support for this scenario comes from the fact that no disk/corona-like features have so far been identified from this system: neither disk thermal emission, nor a cut-off in the energy spectrum that would be expected from observations of a hot corona (Takahashi et al., 2009; Torres,, 2010). In a shock scenario, the kinetic power of the stellar wind and the pulsar wind is transferred to the hot plasma which is accelerated to relativistic velocities. High energy -rays are then produced via inverse Compton scattering of the shocked plasma off the seed photons from the stellar photon field.
Up to now the high energy emission was mainly detected at either periastron (around a few GeV) or apastron (soft X-rays, hard X-rays, soft -rays and -rays at TeV). Therefore, emission at intermediate orbital phases is of great interest in probing further the emission model and the physical mechanisms behind it. The discovery of an evolution of the flux peak in the orbital phase from 0.6 at a few tens of MeV to 1.0 close to 1 GeV provides the first clue.
4.2 Origin of the variability
Almost all models invoke synchrotron and inverse Compton emission to explain the multi-wavelength radiation of systems like LS 5039. This emission is further modified by the effects of absorption and cooling. Along the orbit a number of conditions may vary, such as the strength of the magnetic field, the photon field density of the massive star, the relative direction of the line of sight and so on. Below, we discuss how these varying parameters may impact the efficiency of both the synchrotron and the inverse Compton scattering.
As suggested in Chernyakova et al. (2014), a stellar magnetic field with the energy density in equipartition with the radiation energy density will be stronger in the vicinity of the companion star,
| (2) |
where is the distance from the massive star. If a hot plasma population is accelerated in the stellar/pulsar wind shock, the region closer to the compact star is expected to show synchrotron emission containing more high energy photons than regions further way. This could account for the energy dependence of the orbital peak flux evolution. The magnetic field around the companion star of LS 5039 is too weak, however, to produce -rays via synchrotron emission. Instead, the synchrotron emission is mostly responsible for the X-ray light curve (Takahashi et al., 2009).
The modulation of the flux along the orbit can be caused by variable adiabatic cooling of electrons in the shock acceleration region (Takahashi et al., 2009; Khangulyan et al., 2008). The -ray emission is then believed to come from inverse Compton scattering of the hot plasma accelerated by the shock off the stellar seed photons. When the compact star moves to the region near or away from periastron, the photons need to travel through the binary system before arriving at the observer. The TeV photons, generated through the head-on inverse Compton scattering in the region where the seed photons have a larger density, lose their energies through pair production (Dubus,, 2013). Through electromagnetic cascade, more MeV and lower-energy GeV photons are generated in this region. This can explain why the low-energy -ray flux peaks at the orbital phase near periastron, instead of TeV -rays. Additionally, Doppler boosting can also help to minimize the TeV flux, when the compact star moves away from the observer (Dubus et al., 2015).
In the region near apastron, the density of stellar photons is expected to be minimal, and correspondingly the strength of the magnetic field in the termination shock. In this region, absorption does not significantly affect the propagation of photons from the shock to the observer. In contrast to the situation near periastron, the compact star is now moving towards to the observer, and the seed photons collide with relativistic electrons in the shock. The head-on collision produces very high-energy photons, which can be observed easily. The Doppler boosting also contributes to the generation of the TeV photons.
According to Takahashi et al. (2009), the particles in periastron can only be accelerated to GeV energies due to cooling and produce GeV -rays via inverse Compton scattering. As the compact star is moving to periastron, the efficiency of producing synchrotron radiation is becoming larger, especially for MeV photons. The energy of these photons is also increased. This is consist with our results that the phase of the flux peak in this energy band moves from phase 0.6 to 1.0.
GeV photons will be produced in INFC both by synchrotron and by inverse Compton scattering. The tail-on scattering in the termination shock will not generate a large flux of photons that could be observed. Though the head-on collision also takes place during the movement of the compact star from periatron to apastron, pair production and the electromagnetic cascade limit the flux of high-energy pbhotons that can be produced in SUPC. This is consist with our result that the flux in the GeV band is lower than in the other energy bands. The fact that we find no modulation in the 3–20 GeV band, suggests that the GeV output is in balance between the INFC region and the SUPC region.
The companion of LS 5039 is an O-type star which is supposed to have a stable and homogeneous wind. It is thus generally expected that the shock structures are symmetric with respect to the line connecting the periastron and apastron points, and, therefore, should create a double peaked feature in the orbital light curves. This, however, is not seen in our observations. The orbital motion as modeled in Dubus, (2013) is not considered here, since the velocity of the compact star follows a symmetric distribution with respect to the line connecting the apastron and periastron points. Our orbital light curve all show a single-peaked profile; this suggests that additional facts have to be accounted for as well. For example, the absorption through both the pair production and the electromagnetic cascade and the influence of the opening angle of the shock wind with respect to the line of the sight, can be expected to have an effect (Kong et al., 2011, 2012). For the latter case, the shock wave may have a smaller opening angle with respect to the line of sight in phase 0.5–1.0 than in phase 0–0.5, and hence the flux is observed to increase due to the Doppler effect (Dubus et al., 2010; Takata et al., 2014).
5 Summary
We provided new observational results on the high-energy emission of -ray binary LS 5039. By analysing all available INTEGRAL/IBIS/ISGRI and Fermi-LAT data up to March 2015, we provide up-to-date orbital light curves for 7 different high energy bands. By combining light curves in different epochs of Fermi-LAT, we improved the accuracy of the orbital ephemeris with respect to Casares et al. (2005) by reducing its error. We showed that the energy-dependent shape of the orbital light curves of LS 5039 relates to the high-energy SEDs, subdivided in INFC (orbital phase 0.45 to 0.9) and SUPC (orbital phase 0.9 to 0.45) regions.
In general, if there is a dominance of the emission from the INFC region, we find an orbital light curve with a flux peak in the apastron to inferior conjunction region (orbital phase 0.5–0.7), while for a SUPC-region emission dominance the flux peak in the orbital light curves regresses to the periastron region (phase 0.9–1.0). Moreover, for radiation with energies which are of equal importance in the SUPC and INFC regions, we find an unmodulated orbital light curve. We discuss our findings in the framework of a neutron star pulsar model, with the assumption that the high-energy emission is the result of a shocked region, where the stellar wind and the pulsar wind collide. In this shocked region particles are accelerated to relativistic energies and subsequently generate the X- and -radiation in the LS 5039 system.
Acknowledgements
We acknowledge support from the Chinese NSFC 11473027, 11133002, 11103020, XTP project XDA 04060604 and the Strategic Priority Research Program "The Emergence of Cosmological Structures" of the Chinese Academy of Sciences, Grant No. XDB09000000. We thank Prof. Tadayuki Takahashi (ISAS/JAXA) for gracefully supplying the Suzaku data points (Takahashi et al., 2009) for the SED shown in Figure 6. We are grateful for support from the International Space Science Institute in Beijing (ISSI-BJ) for a team meeting which motivated this publication. We thank Dr. Jian Li and Prof. Diego F. Torres for help and discussions.
References
- Abdo et al. (2009) Abdo, A. A., et al., 2009, ApJ, 706, L56
- Abramowski et al. (2012) Abramowski, A., et al., 2012, A&A, 541, A5
- Acero et al. (2015) Acero, F., 2015, arXiv:1501.02003v2
- Aharonian et al. (2005a) Aharonian, F., et al., 2005a, Science, 309, 746
- Aharonian et al. (2005b) Aharonian, F., et al., 2005b, A&A, 442, 1
- Aharonian et al. (2006) Aharonian, F., et al., 2006, A&A, 460, 743
- Aharonian et al. (2007) Aharonian, F., et al., 2007, A&A, 469, L1
- Albert et al. (2006) Albert, J., et al., 2006, Science, 312, 1771
- Albert et al. (2009) Albert, J., et al., 2009, ApJ, 693, 303
- Atwood et al. (2009) Atwood, W. B., et al., 2009, ApJ, 697, 1071
- Casares et al. (2005) Casares, J. et al., 2005, MNRAS, 364, 899
- Chernyakova et al. (2014) Chernyakova et al., 2014, The X-ray Universe 2014, 237
- Collmar & Zhang, (2014) Collmar W.& Zhang S., 2014, A&A, 565, A38
- Corbet et al. (2011) Corbet, R. et al., 2011, ATel, 3221
- Dubus et al. (2010) Dubus, G. et al., 2010, A&A, 516, 18
- Dubus, (2013) Dubus, G., 2013, A&ARv, 21, 64
- Dubus et al. (2015) Dubus, G., 2015, A&A, 581, A27
- Hadasch et al. (2012) Hadasch, D. et al., 2012, ApJ, 749, 54
- Hoffmann et al. (2009) Hoffmann, A.D., et al., 2009, A&A, 494, L37
- Johnston et al. (1992) Johnston, S., et al., 1992, ApJ, 387, L37
- Khangulyan et al. (2008) Khangulyan, D. V., et al., 2008, Int.J.Mod.Phys.D, 17, 1909
- Kong et al. (2011) Kong, S. W., et al., 2011, MNRAS, 416, 1067
- Kong et al. (2012) Kong, S. W., et al., 2012, ApJ, 753, 127
- Lebrun et al. (2003) Lebrun, F., et al., 2003, A&A, 411, L141
- Maraschi et al. (1981) Maraschi, L., et al., 1981, MNRAS, 194, 1P
- Motch et al. (1997) Motch, C., et al., 1997, A&A, 323, 853
- Takata et al. (2014) Takata, J., et al., 2014, ApJ, 790, 18
- Takahashi et al. (2009) Takahashi, T. et al., 2009, ApJ, 697, 592
- Torres, (2010) Torres, D. F., et al. 2010, arXiv:1008.0483v1
- Ubertini et al. (2003) Ubertini, P. et al., 2003, A&A, 411, L131
- Winkler et al. (2003) Winkler, C. et al., 2003, A&A, 411, L1