Variable and Polarized Radio Emission from the T6 Brown Dwarf WISEP J112254.73255021.5
Abstract
Route & Wolszczan (2016) recently detected five radio bursts from the T6 dwarf WISEP J112254.73255021.5 and used the timing of these events to propose that this object rotates with an ultra-short period of 17.3 minutes. We conducted follow-up observations with the Very Large Array and Gemini-North but found no evidence for this periodicity. We do, however, observe variable, highly circularly polarized radio emission possibly with a period of 116 minutes, although our observation lasted only 162 minutes and so more data are needed to confirm it. Our proposed periodicity is typical of other radio-active ultracool dwarfs. The handedness of the circular polarization alternates with time and there is no evidence for any unpolarized emission component, the first time such a phenomenology has been observed in radio studies of very low-mass stars and brown dwarfs. We suggest that the object’s magnetic dipole axis may be highly misaligned relative to its rotation axis.
1 Introduction
It has long been recognized that some M dwarf stars vary both spectroscopically and photometrically (Luyten, 1926; van Maanen, 1940). Early on, theorists concluded that despite their small sizes, these stars must harbor magnetic field more powerful than those of the Sun (e.g., Schatzman, 1967), although this hypothesis was not confirmed until the pioneering observations of Saar & Linsky (1985). While theoretical considerations drove the assumption that the coolest M dwarfs would not be able to generate magnetic fields as strong as those of the classical flare stars (e.g., Durney et al., 1993), radio observations have demonstrated that strong dynamo action extends not only to more massive brown dwarfs (Berger et al., 2001) but even to the T dwarfs, which have effective temperatures of just 1000 K (Route & Wolszczan, 2012, 2016; Kao et al., 2016). Evidently the loss of the “tachocline” — the shearing layer between the radiative core and convective outer envelope that is argued to be important to the solar dynamo (Ossendrijver, 2003, and references therein) — does not preclude the generation of strong magnetic fields in these objects, which are fully convective.
There is nonetheless ample evidence that the magnetic properties of the ultracool dwarfs — very low mass stars and brown dwarfs with spectral types M7 or later (Kirkpatrick et al., 1999; Martín et al., 1999) — are substantially different than those of their higher-mass brethren. Their X-ray and emission drop precipitously with temperature (Gizis et al., 2000; West et al., 2004; Stelzer et al., 2006; Berger et al., 2010), so that ratios of their radio and X-ray luminosities significantly exceed standard relations for active stars (Güdel & Benz, 1993; Berger et al., 2001; Williams et al., 2014); a new phenomenology of periodic, highly polarized radio bursts arises (Berger et al., 2005, 2009; Hallinan et al., 2006, 2008); trends relating rotation and X-ray activity break down (Berger et al., 2008; Cook et al., 2014); and their activity lifetimes become much longer than those of Sun-like stars, implying inefficient angular momentum loss and rapid rotation even to Gyr ages (Gizis et al., 2002; West et al., 2008; Bouvier et al., 2014).
Route & Wolszczan (2016) discovered that the T6 WISEP J112254.73255021.5 (hereafter WISE 112225) is one of the handful of known radio-emitting T dwarfs (Route & Wolszczan, 2012; Williams et al., 2013; Kao et al., 2016) in the course of a large Arecibo survey for radio bursts from ultracool dwarfs at 5 GHz (Route & Wolszczan, 2013). Along with being an extreme object in terms of its temperature, Route & Wolszczan (2016) claimed that it is extreme in terms of rotation: they phased the arrival time of its radio bursts (Section 2) to infer a rotation period of 17.3 minutes. If confirmed, this rotation period would be by far the shortest ever measured in a brown dwarf. WISE 112225 may therefore be a unique laboratory for understanding the relationship between age, rotation, and magnetic field generation in the fully-convective dynamo regime.
The outline of this paper is as follows. We first summarize previous observations of WISE 112225 (Section 2). We then describe new follow-up observations that we obtained with the Karl G. Jansky Very Large Array (VLA) and Gemini-North and present the data (Section 3). Next we analyze the data for periodic signals, finding evidence for variations at a period of 116 min rather than the value suggested by Route & Wolszczan (2016), and analyze the properties of the observed radio emission (Section 5). Finally, we discuss the implications of these results (Section 6) and present our conclusions (Section 7).
2 The Radio-Active T6 Dwarf WISEP J112254.73255021.5
Kirkpatrick et al. (2011) identified WISE 112225 as a candidate T dwarf in Widefield Infrared Survey Explorer (WISE) imaging and confirmed its cool nature spectroscopically, assigning it a NIR spectral type of T6. Additional analysis has yielded a spectrophotometrically estimated distance of 17.7 pc (Kirkpatrick et al., 2012).
Over a span of four observing epochs in their 5 GHz Arecibo survey, Route & Wolszczan (2013, 2016) detected five radio bursts from WISE 112225. The peak fluxes were 1.5–3 mJy, and two of the bursts were separated by 18.3 minutes. In ten additional, non-contiguous hours of follow-up observations, additional flares were not detected; the total time on source was 29 hr. The detected flares had left circular polarizion (LCP) fractions ranging from 15–100% and characteristic durations of 30–120 s. Route & Wolszczan (2016) did not find a quiescent counterpart to the radio source in the FIRST catalog of radio sources (Becker et al., 1995).
The high circular polarization fraction and brightness temperature of WISE 112225’s radio bursts are consistent with emission due to the electron cyclotron maser instability (ECMI; Wu & Lee, 1979; Treumann, 2006), as also observed in a substantial fraction of the radio-active ultracool dwarfs (Burgasser & Putman, 2005; Hallinan et al., 2006, 2008; Berger et al., 2009; Route & Wolszczan, 2012; Williams & Berger, 2015). Because this emission is expected to occur at the local electron cyclotron frequency, , radio detection provides a measurement of the magnetic field strength at the site of the radio emission. In the case of WISE 112225, Route & Wolszczan (2016) estimated kG since the upper spectral cutoff was not observed.
Route & Wolszczan (2016) also applied pulsar timing techniques to search for a periodicity in the times-of-arrival (TOAs) of WISE 112225’s flares. They obtained a timing solution of minutes, with a post-fit rms residual s, although they emphasize that these uncertainties are the formal outputs of the fitting routine and that the variability in the flare profiles suggests that the true uncertainty in the period is 15 s: a number that is substantially larger but still small in an absolute sense. The first and last flare detections were separated by 240 days, or 20,000 rotations assuming the claimed periodicity. Route & Wolszczan (2016) used Monte Carlo simulation to deduce a false-alarm probability of 0.01% for the period detection. This ultra-short rotation period implies a highly oblate object rotating near its breakup rate, with an equatorial velocity 300 km s-1 (Route & Wolszczan, 2016). The breakup rotation rate is a function of mean density, which increases with time in the brown dwarf regime, so that the observed period implies an age 1 Gyr for WISE 112225 (Route & Wolszczan, 2016). Other constraints on the age of WISE 112225 are not presently available.
The M5 dwarf LHS 302 is found 4.4′ away from WISE 112225 and appears to have a similar distance and proper motion. If the two objects were physically related, their projected separation would be 4500 AU, so that interactions between the two would be expected to be negligible (Kirkpatrick et al., 2011).
3 Observations and Data Processing
3.1 Karl G. Jansky Very Large Array
We obtained Director’s Discretionary time to observe WISE 112225 for 3 hours using the VLA on UT date 2016 May 11 (project ID VLA/16A-463; PI: Williams). The VLA was in the semi-extendend “CnB” configuration. We used the VLA’s 3-bit samplers to digitize the full bandwidth of the “C” band, 4–8 GHz, dividing the bandpass into channels of 2 MHz width. We obtained standard calibration observations, using 3C 286 as the flux density and bandpass calibrator and NVSS J112555260630 as the complex gain calibrator. The total time on-source was 2.57 hr.
We used standard procedures to analyze the data, using a Python-based reduction process driving tasks from the CASA package (McMullin et al., 2007). We flagged radio-frequency interference (RFI) automatically using the morphological and SumThreshold algorithms as implemented by the aoflagger tool (Offringa et al., 2010, 2012). After calibration, we imaged the total intensity (Stokes I polarization component) of the full data set at 0.30.3 arcsec2 resolution using multifrequency synthesis (Sault & Wieringa, 1994) and -projection (Cornwell et al., 2005). The mean frequency of this image is 6.00 GHz and the rms noise around its phase center is 2.2 Jy bm-1.
The image contains an isolated source at position RA = 11:22:54.26, Decl. = 25:50:20.0, with uncertainties of 0.2′′ and 0.1′′ in RA and Decl., respectively. From the astrometric parameters reported by Kirkpatrick et al. (2011) and the mean image epoch of MJD 57519.27, the predicted position of WISE 112225 at the time of our observation is RA = 11:22:54.30, Decl. = 25:50:20.4, with uncertainties of 0.5′′ and 0.6′′ in RA and Decl., respectively. These two positions differ by 0.7′′ or 1.3. Based on this agreement and the time-variable polarized emission of this source (described below), which is characteristic of radio-active ultracool dwarfs, we identify this VLA source with WISE 112225.
We generated two additional images by splitting the 4 GHz of VLA bandwidth into halves by frequency, resulting in two images with center frequencies of 5.00 and 7.00 GHz. In the low-band image, WISE 112225 is a point source with a time- and polarization- averaged flux density of Jy. In the high-band image, it is a point source with an averaged flux density of Jy. The implied spectral index, averaging over time and polarization, is , where .
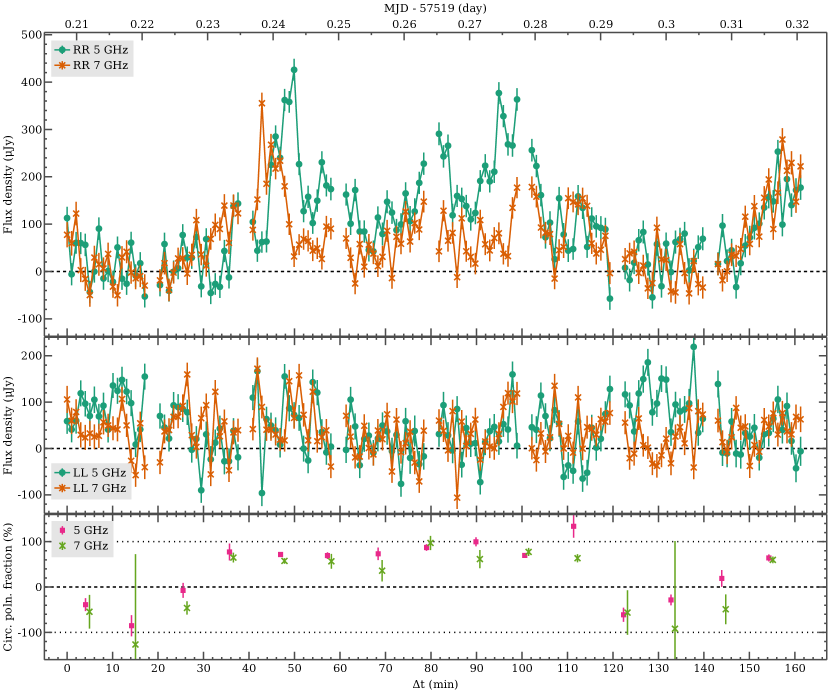
We investigated the time variability of WISE 112225 by subtracting the emission from the other sources in the VLA field of view and summing the calibrated visibilities after phasing to the source position, as per the procedure described in Williams et al. (2013). Light curves derived from this analysis are shown in Figure 1, where curves have been binned to a cadence of 60 s (compared to the data sampling time of 5 s) for display purposes. Here and below we quantify times using , the number of minutes since the observation start; is .
The emission in the RR polarization product (that is, the mean correlation of pairs of RCP-sensitive receivers) is highly variable, with several bursts, predominantly in the 4–6 GHz sub-band (denoted “5 GHz” for brevity), having durations of 10 min and peak flux densities of 300–400 Jy. The second and third 5 GHz RR bursts are separated by 16 minutes, close to the 18.3 minute spacing between the two closest Arecibo bursts. This separation in turn presumably drove the identification of a 17.3-minute periodicity by Route & Wolszczan (2016). We note, however, that the Arecibo bursts were LCP rather than RCP.
The RR emission is generally brighter in the 5 GHz sub-band than the 7 GHz sub-band, with the exception of the period , which ends in a rapid spike. Finer-grained examination of the frequency dependence of the emission does not reveal any abrupt changes in the spectrum. If there is a sharp spectral cutoff as expected from the ECMI emission, it occurs at higher frequencies than we observed.
While the LL polarization product is not as clearly variable, there are two episodes in which the LL emission at 5 GHz becomes significantly brighter than that at 6–8 GHz (“7 GHz”): at and . These episodes coincide with periods of weak or absent emission in the RR polarization product, so that at most times the radio emission of WISE 112225 is strongly circularly polarized, although the handedness of that polarization varies. The lower panel of Figure 1 plots the polarization fraction as a function of time, smoothing on 10-minute time scales to increase S/N. The emission is almost always intensely circularly polarized, with only a few intervals where the absolute value of the polarization fraction is %. These intervals seem to correspond to transitions in the handedness of the polarization, from left to right and back again.
The Arecibo flares were 15–100% LCP, had durations of 1–3 min, and reached peak flux densities of 1000-2000 Jy (Route & Wolszczan, 2016). The dominant RR radio variability that we observe is therefore substantially different in its gross properties. The episodes of LL emission, however, could represent higher-frequency and fainter counterparts of the Arecibo flares. Using the spectral index derived above, the Arecibo flares would have flux densities 1–2 mJy, significantly brighter than the LCP emission we observed.
3.2 Gemini-North
We observed WISE 112225 on UT date 2016 June 21 with the Gemini Multi-Object Spectrograph (GMOS-N; Hook et al., 2004) on the Gemini-North Telescope (Program GN-2016A-FT-29) in imaging mode. We used the (G0304) filter with the e2v deep depletion detectors. The -band blue edge of 850 nm is set by the filter, but the red cutoff is set by the detector which extends to 950–1000 nm, approximately 100 nm redder than most CCD detectors.
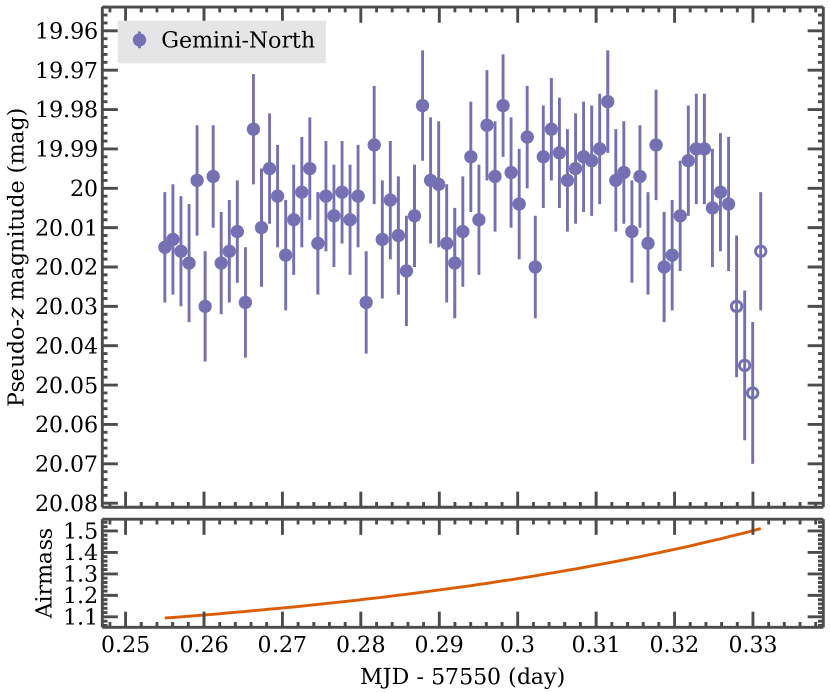
The data were taken over 1.8 hr and consist of 75 images with 60 s exposure times. The observations began after the object had already transited the meridian and spanned an airmass of 1.1 to 1.5. We processed the data in the standard way using the Gemini IRAF package. We corrected fringing using the observatory’s fringe image and measured aperture photometry for the target relative to the average of five comparison stars in the field of view to remove the first-order effects of seeing and airmass variations. Figure 2 shows the resulting light curve. We do not include in our analysis the final four images made at airmass . Calibrating from the SDSS photometry for these comparison stars yields mag for WISE 112225. The observed scatter for WISE 112225, mag, is consistent with the expected noise due to photon counting statistics. We rule out sinusoidal peak-to-peak amplitudes % for periods less than one hour.
4 Periodicity Analysis
While Figure 2 shows no clear evidence for a periodicity in the Gemini-North data, the peaks in the VLA light curve (Figure 1) suggest a possible periodic signal. We investigated this possibility using a phase dispersion minimization analysis (PDM; Stellingwerf, 1978). In this technique, given a trial period , the data are placed into phase bins and the overall scatter within each bin is summarized with a statistic denoted . Lower values of imply less scatter and therefore a better phasing. Unlike some other periodicity-finding techniques (e.g., the Lomb-Scargle periodogram; Lomb, 1976; Scargle, 1982), PDM analysis therefore makes no assumptions about the underlying structure of the potential periodic signal. In this work we used the implementation of PDM provided by version 0.8.4 of the pwkit Python toolkit111https://github.com/pkgw/pwkit/.
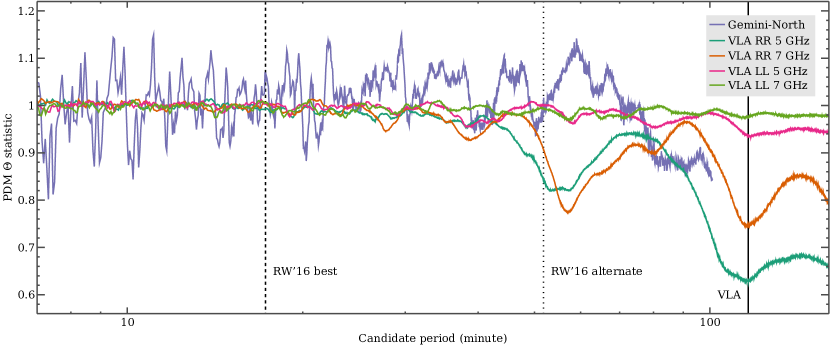
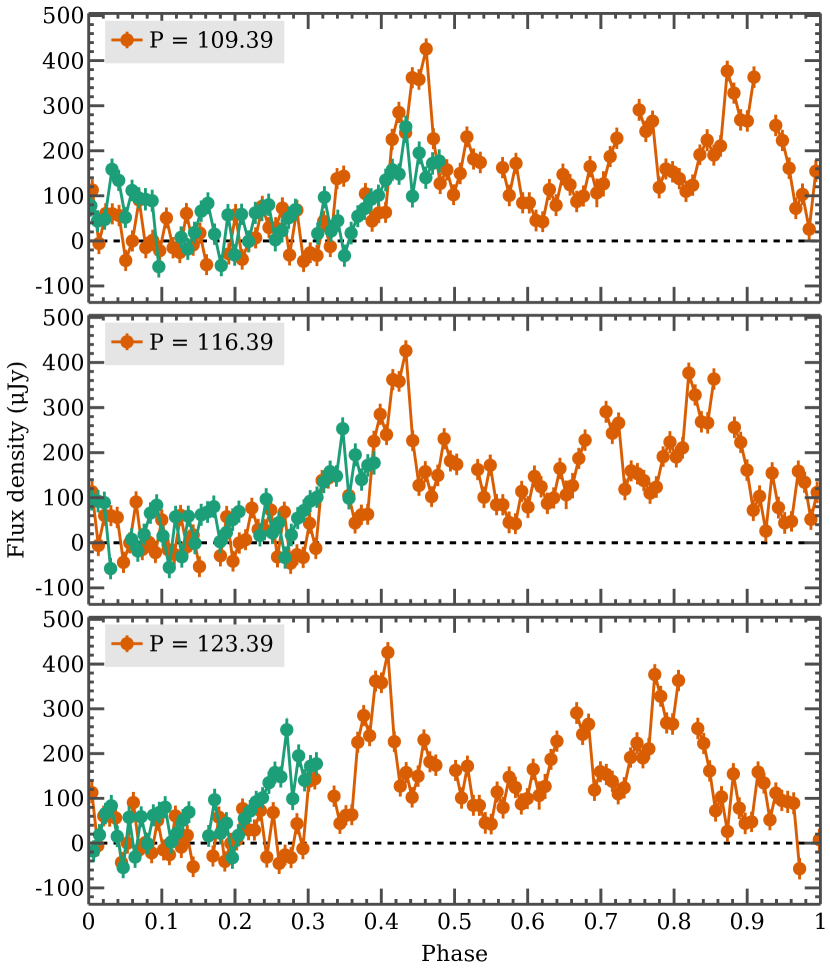
Figure 3 plots in the VLA and Gemini-North data sets, where we subdivided the VLA data by polarization and frequency sub-band. The periods range from one minute to just below the respective durations of the observations. The PDM analysis does not reveal evidence of a periodic signal in the Gemini-North data. The VLA RR data, on the other hand, show clear but broad minima at periods of 55 and 116 minutes. The LL data show weak evidence for similar periodicities. Three out of the four VLA curves have their global minimum near the larger of these periodicities. We note that the four curves are derived from data that are statistically independent in principle. A time-dependent calibration error could induce correlations between the different polarization and frequency groupings, but PDM analysis of a nearby reference source shows no indications of such an effect.
Inspection of Figure 1 shows that the smaller period minimum represents an approximate phasing of the three peaks seen in the VLA RR 5 GHz data at , , and , while the larger is approximately its first sub-harmonic, aligning the first and third of these peaks as well as the troughs of zero RR emission before them. Assuming the shorter (longer) candidate period, our VLA observation spanned 2.9 (1.4) cycles of emission. Although the longer candidate period result is therefore associated with substantially worse phase coverage, with only 0.4 of a period having any redundant data, the scatter at that phasing is lower than that at the shorter period, as reflected by the fact that it indeed corresponds to the global minimum of the PDM statistic computed for this data set. We proceed under the assumption that the longer candidate periodicity corresponds to the rotation period of WISE 112225.
A Monte Carlo assessment of the uncertainty on this periodicty, computed by adding noise to the observed data and rerunning the PDM analysis, suggests an uncertainty of 0.7 min. This value, however, understates the true uncertainty given the limited available data. In Figure 4 we plot the VLA RR 5 GHz data phased at our preferred periodicity and two periods offset from the PDM-minimized value by minutes. These phasings are visibly inferior to the PDM-optimized value but do not appear implausible. Assuming the emission is indeed periodic, we suggest that a plausible uncertainty on our measurement is about this this large.
If the Arecibo radio bursts occur at the same periodicity as the VLA variability, the flare TOAs reported by Route & Wolszczan (2016) could potentially yield a more precise constraint on WISE 112225’s periodicity. To investigate this, we examined possible TOA phasings at periods between 106 and 126 minutes. The five burst TOAs reported by Route & Wolszczan (2016) span three primary time scales: the gap between the first and second TOA is 230 days; the gap between the second and third is 18 minutes; and the gaps between the third, fourth, and fifth TOAs are 4 days each. There are therefore reasonable grounds to argue that the first TOA should not be included in a timing solution, since it is so distant from the others, and/or that the second or third TOA should not be included, since their separation is small compared to the VLA light curve period. Regardless of which, if any, TOAs we discard from the analysis, no preferred periodicity emerges within the general bounds supported by the VLA light curve.
5 Analysis of the Radio Emission
The variability of WISE 112225 makes it difficult to assess the brightness of its quiescent radio emission. The mean flux densities during the troughs of RR emission, and , are almost all consistent with zero. The exception is the 5 GHz sub-band in the second trough, where the mean flux density is Jy. Comparing to the LL emission at these times, this elevated RR emission is likely related to the relatively bright, low-band LL burst that occurs at this time. The mean 5 GHz LL flux density in this window is Jy, implying a 50% LCP flare of total intensity Jy. This polarization fraction is consistent with the Arecibo events, but the flux density is an order of magnitude lower (Route & Wolszczan, 2016).
The mean LL flux densities of WISE 112225 in the window centered between the two RR flares, , are and Jy in the 5 and 7 GHz sub-bands, respectively. We did not obtain the calibrator observations necessary to calibrate the leakage between the VLA’s RR and LL receivers in our observation, so that the LL correlations will include a small contribution of RR flux, and vice versa. This is typically a 5% effect, whereas the observed LL flux density during this short period represents % of the RR flux density. We therefore cannot exclude that the measured LL flux density in this time window is entirely due to leakage from the RR emission.
The data suggest that RR and LL components of the radio emission of WISE 112225 both vary periodically (Figure 3), but 180 out of phase, with their respective maxima including strongly polarized flares lasting 15 minutes and their minima consistent with zero emission. Therefore, while the mean flux density of WISE 112225 in our observation results in an easy VLA detection ( Jy at 6 GHz with a spectral index ), this T dwarf may have no quiescent emission, defining this to mean a non-variable, broadband component. High-sensitivity radio observations with full polarimetric calibration are needed to confirm this. The radio flares detected by Arecibo are 200 times brighter than the quiescent component, taking the brightness of the latter to be 10 Jy. This ratio is comparable to the extreme values found in 2M 104721 (Williams et al., 2013) and the M8 dwarf DENIS J1048.03956 (Burgasser & Putman, 2005).
While WISE 112225 may not produce “quiescent” radio emission as defined above, its time-averaged radio flux density is relevant to the overall energetics of the nonthermal particle acceleration processes that power its radio emission. Assuming a 20% uncertainty on its estimated 17.7 pc distance, we compute erg s-1 Hz-1 at 6 GHz. This is typical of radio-active ultracool dwarfs (Williams et al., 2014). Using the polynomial relationship between spectral type and developed by Filippazzo et al. (2015), we estimate the bolometric luminosity to be , and therefore that in a time-averaged sense, Hz-1. This is the highest value yet measured for an ultracool dwarf (Williams et al., 2014; Williams & Berger, 2015), a result driven by the late spectral type of WISE 112225; as shown by Filippazzo et al. (2015), the bolometric luminosities of brown dwarfs are believed to decrease rapidly as a function of spectral type for objects later than T3. That being said, we calculate that both of the two other late T dwarfs detected at radio wavelengths, 2M 104721 and 2MASS J123739196526148, are half as radio-bright as WISE 112225 by this metric, having Hz-1 (Williams & Berger, 2015; Kao et al., 2016).
Route & Wolszczan (2016) interpreted the Arecibo radio bursts as being due to the ECMI, which results in bursty, highly-polarized emission with brightness temperatures that can significantly exceed the canonical limit of K associated with the inverse Compton catastrophe (Kellermann & Pauliny-Toth, 1969). The non-bursting radio emission from ultracool dwarfs is often argued to instead originate from gyrosynchrotron processes (e.g., Berger, 2002), which results in steadier, less polarized emission with typically observed brightness temperatures of K (e.g., Osten et al., 2006). Assuming the characteristic length scale of the emitting region to be , we place a conservative lower limit on the brightness temperature of the VLA emission to be K, consistent with gyrosynchrotron. Route & Wolszczan (2016) obtain a higher limit, K, for the Arecibo bursts, which are brighter and more probably originate from a compact emission region. However, while gyrosynchrotron emission can in principle be highly circularly polarized (Dulk, 1985), this requires specialized circumstances that are difficult to achieve in practice. ECMI or perhaps plasma emission is therefore the more likely origin of the emission that we observed with the VLA. Observations at higher frequencies could potentially discriminate between these possibilities because the spectrum of ECMI emission cuts off strongly at frequencies above the local electron cyclotron frequency GHz, while gyrosynchrotron emission is spectrally smooth. Under the ECMI model, we can place a somewhat higher limit on the magnetic field strength of WISE 112225 than Route & Wolszczan (2016) because our observations extended to higher frequencies. If the rapid event in the 7 GHz sub-band at is due to ECMI, the magnetic field of WISE 112225 must reach strengths of kG.
6 Discussion
We have discovered evidence for variations in the radio emission of WISE 112225 with a tentative period of 116 min. The features that drive this periodicity are the deep troughs in the RR emission, the rising slopes that follow them, and weaker, low-frequency LL emission features at and . Because our VLA observation lasted only 162 min, yielding overlapped phase coverage of only 0.4 of a rotation, the periodicity we detect should be regarded as provisional. We also see no compelling signs of variability at any periodicity in the Gemini-North data, although our observations did not last as long as this candidate periodicity. Regardless of the VLA periodicity’s validity, however, we do not find evidence for periodic variability in the radio or red optical emission of WISE 112225 at the period of min proposed by Route & Wolszczan (2016).
If the true rotation period of WISE 112225 is 116 min rather than 17 min, it is not nearly as extreme of an object as initially proposed (Route & Wolszczan, 2016). In fact, it then becomes a slightly slower rotator than 2M 104721, the only other T dwarf to have its rotation period derived from its radio emission (Williams & Berger, 2015), which has min. Assuming a radius of for WISE 112225, the same as 2M 104721 (Vrba et al., 2004; Williams & Berger, 2015), we find an equatorial rotational velocity of 60 km s-1 for WISE 112225.
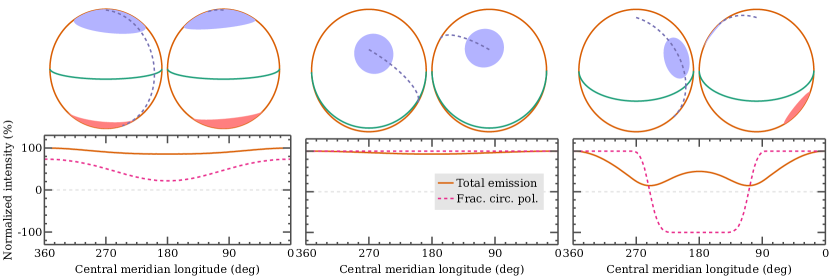
In these data the radio emission of WISE 112225 is strongly circularly polarized, but the handedness of the polarization changes twice. If this change in handedness is confirmed to occur periodically, this would be consistent with a model in which the magnetosphere of WISE 112225 is a dipole tilted with respect to its rotation axis, as proposed by McLean et al. (2011) to explain VLA observations of the extremely radio-active, benchmark M7 binary NLTT 33370 AB (= 2MASS J131420391320011; see also Schlieder et al., 2014; Williams et al., 2015; Forbrich et al., 2016; Dupuy et al., 2016). We show a schematic of the proposed model in Figure 5. Each pole produces highly circularly polarized radio emission, with the oppositely-aligned polar magnetic fields leading to opposite handedness of the resulting emission. The significantly brighter emission in the RR polarization mode suggests that the magnetic north pole (i.e., analogous to Earth’s geographic south pole) is more directly pointed towards Earth (Kaiser et al., 1978a, b). Assuming that the intrinsic radio emission of each magnetic pole is approximately the same, the shapes of the observed light curves in each polarization could be used to constrain the inclination of the rotation axis of WISE 112225 and the angle between this axis and the magnetic dipole axis: for instance, and leads to an non-variable, unpolarized light curve; while leads to a non-variable, 100% polarized light curve; and , leads to out-of-phase curves of 100% circular polarization, as observed here. We therefore speculate that the magnetic dipole axis of WISE 112225 may be highly misaligned with its rotation axis.
The lack of observed -band variability in WISE 112225 can only rule out relatively short ( hr) periods with relatively high (%) amplitudes. Metchev et al. (2015) found that 36% of T dwarfs vary in the mid-infrared Spitzer bands at %. Radigan et al. (2014) argue that at J band, sinusoidal amplitudes larger than 2% are found only for L/T transition objects (spectral types L9–T3.5), but that 80% of other L/T dwarfs vary at the 0.5%–1.6% level. Heinze et al. (2015) argued that for T dwarfs, variability in the red optical (F814W, 700–950 nm) has a higher amplitude than at J band or Spitzer bands. Given these statistics, WISE 112225 cannot be viewed as an outlier. However, Kao et al. (2016) argue for a possible correlation between radio activity and the presence of optical and infrared variability which they attribute to aurorae. In this aurora model, the lack of red-optical variabilty may be more surprising.
7 Conclusions
WISE 112225 is the fourth T dwarf with a published detection at radio wavelengths (Route & Wolszczan, 2012, 2016; Williams et al., 2013; Kao et al., 2016). While early theoretical work motivated a consensus that the magnetic fields of such cool objects should be negligible (e.g., Durney et al., 1993), radio surveys have demonstrated that in fact 10% of these objects host both organized, kG-strength magnetic fields and the nonthermal particle acceleration processes necessary to drive radio emission (Route & Wolszczan, 2013, 2016; Kao et al., 2016). It remains unknown what fraction of the remaining objects do not possess strong, organized fields at all, and what fraction possess such fields but not the acceleration processes necessary to render them detectable via radio emission.
While the bursts from WISE 112225 detected by Route & Wolszczan (2016) are similar to the bright, highly polarized ECMI bursts detected from a growing list of ultracool dwarfs, the emission we have detected with the VLA is unique in that it has both a high duty cycle and strong circular polarization of alternating handedness. For instance, while the handedness of the circularly polarized emission from NLTT 33370 AB also oscillates, it is accompanied by a much more prominent unpolarized component as well (McLean et al., 2011; Williams et al., 2015). We have speculated that the particular variability pattern we have observed may be due to a magnetic dipole axis that is highly misaligned with respect to the object’s rotation axis (Figure 5). The lack of unpolarized emission may also imply that WISE 112225 does not possess equatorial belts of nonthermal plasma as have been hypothesized to surround NLTT 33370 AB and other ultracool dwarfs (Williams et al., 2014, 2015).
Like 2M 104721, WISE 112225 was discovered to be a radio emitter with Arecibo, then followed up with VLA observations (Route & Wolszczan, 2012; Williams et al., 2013). In both cases, the interferometric data revealed details of its radio emission that are inaccessible to Arecibo due to the latter telescope’s confusion limitations and inability to track sources for long (3 hr) durations. Together, these two complementary, world-class observatories are leading the way in gaining observational insight into the magnetic fields and dynamos of ultra-cool bodies that are nearing the (exo)planetary mass regime.
References
- Becker et al. (1995) Becker, R. H., White, R. L., & Helfand, D. J. 1995, ApJ, 450, 559
- Berger (2002) Berger, E. 2002, ApJ, 572, 503
- Berger et al. (2001) Berger, E., Ball, S., Becker, K. M., et al. 2001, Natur, 410, 338
- Berger et al. (2005) Berger, E., Rutledge, R. E., Reid, I. N., et al. 2005, ApJ, 627, 960
- Berger et al. (2008) Berger, E., Basri, G., Gizis, J. E., et al. 2008, ApJ, 676, 1307
- Berger et al. (2009) Berger, E., Rutledge, R. E., Phan-Bao, N., et al. 2009, ApJ, 695, 310
- Berger et al. (2010) Berger, E., Basri, G., Fleming, T. A., et al. 2010, ApJ, 709, 332
- Bouvier et al. (2014) Bouvier, J., Matt, S. P., Mohanty, S., et al. 2014, in Protostars and Planets VI, ed. H. Beuther, R. S. Klessen, C. P. Dullemond, & T. Henning (Tucson, AZ, USA: University of Arizona Press), 433
- Burgasser & Putman (2005) Burgasser, A. J., & Putman, M. E. 2005, ApJ, 626, 486
- Cook et al. (2014) Cook, B. A., Williams, P. K. G., & Berger, E. 2014, ApJ, 785, 10
- Cornwell et al. (2005) Cornwell, T. J., Golap, K., & Bhatnagar, S. 2005, in Astronomical Society of the Pacific Conference Series, Vol. 347, Astronomical Data Analysis Software and Systems XIV, ed. P. Shopbell, M. Britton, & R. Ebert, 86
- Dulk (1985) Dulk, G. A. 1985, ARA&A, 23, 169
- Dupuy et al. (2016) Dupuy, T. J., Forbrich, J., Rizzuto, A., et al. 2016, ApJ in press, arxiv:1605.07182
- Durney et al. (1993) Durney, B. R., de Young, D. S., & Roxburgh, I. W. 1993, SoPh, 145, 207
- Filippazzo et al. (2015) Filippazzo, J. C., Rice, E. L., Faherty, J., et al. 2015, ApJ, 810, 158
- Forbrich et al. (2016) Forbrich, J., Dupuy, T. J., Reid, M. J., et al. 2016, ApJ in press, arxiv:1605.07177
- Gizis et al. (2000) Gizis, J. E., Monet, D. G., Reid, I. N., et al. 2000, AJ, 120, 1085
- Gizis et al. (2002) Gizis, J. E., Reid, I. N., & Hawley, S. L. 2002, AJ, 123, 3356
- Güdel & Benz (1993) Güdel, M., & Benz, A. O. 1993, ApJL, 405, L63
- Hallinan et al. (2006) Hallinan, G., Antonova, A., Doyle, J. G., et al. 2006, ApJ, 653, 690
- Hallinan et al. (2008) —. 2008, ApJ, 684, 644
- Heinze et al. (2015) Heinze, A. N., Metchev, S., & Kellogg, K. 2015, ApJ, 801, 104
- Hook et al. (2004) Hook, I. M., Jørgensen, I., Allington-Smith, J. R., et al. 2004, PASP, 116, 425
- Kaiser et al. (1978a) Kaiser, M. L., Alexander, J. K., Riddle, A. C., Pearce, J. B., & Warwick, J. W. 1978a, GeoRL, 5, 857
- Kaiser et al. (1978b) —. 1978b, Geophysical Research Letters, 5, 1087
- Kao et al. (2016) Kao, M. M., Hallinan, G., Pineda, J. S., et al. 2016, ApJ, 818, 24
- Kellermann & Pauliny-Toth (1969) Kellermann, K. I., & Pauliny-Toth, I. I. K. 1969, ApJL, 155, 71
- Kirkpatrick et al. (1999) Kirkpatrick, J. D., Reid, I. N., Liebert, J., et al. 1999, ApJ, 519, 802
- Kirkpatrick et al. (2011) Kirkpatrick, J. D., Cushing, M. C., Gelino, C. R., et al. 2011, ApJS, 192, 19
- Kirkpatrick et al. (2012) Kirkpatrick, J. D., Gelino, C. R., Cushing, M. C., et al. 2012, ApJ, 753, 156
- Lomb (1976) Lomb, N. R. 1976, Ap&SS, 39, 447
- Luyten (1926) Luyten, W. J. 1926, Harvard College Observatory Bulletin, 835, 2
- Martín et al. (1999) Martín, E. L., Delfosse, X., Basri, G., et al. 1999, AJ, 118, 2466
- McLean et al. (2011) McLean, M., Berger, E., Irwin, J., Forbrich, J., & Reiners, A. 2011, ApJ, 741, 27
- McMullin et al. (2007) McMullin, J. P., Waters, B., Schiebel, D., Young, W., & Golap, K. 2007, in Astronomical Society of the Pacific Conference Series, Vol. 376, Astronomical Data Analysis Software and Systems XVI, ed. R. A. Shaw, F. Hill, & D. J. Bell, 127
- Metchev et al. (2015) Metchev, S. A., Heinze, A., Apai, D., et al. 2015, ApJ, 799, 154
- Offringa et al. (2010) Offringa, A. R., de Bruyn, A. G., Biehl, M., et al. 2010, MNRAS, 405, 155
- Offringa et al. (2012) Offringa, A. R., van de Gronde, J. J., & Roerdink, J. B. T. M. 2012, A&A, 539, A95
- Ossendrijver (2003) Ossendrijver, M. 2003, A&ARv, 11, 287
- Osten et al. (2006) Osten, R. A., Hawley, S. L., Bastian, T. S., & Reid, I. N. 2006, ApJ, 637, 518
- Radigan et al. (2014) Radigan, J., Lafrenière, D., Jayawardhana, R., & Artigau, E. 2014, ApJ, 793, 75
- Route & Wolszczan (2012) Route, M., & Wolszczan, A. 2012, ApJL, 747, L22
- Route & Wolszczan (2013) —. 2013, ApJ, 773, 18
- Route & Wolszczan (2016) —. 2016, ApJL, 821, L21
- Saar & Linsky (1985) Saar, S. H., & Linsky, J. L. 1985, ApJ, 299, 47
- Sault & Wieringa (1994) Sault, R. J., & Wieringa, M. H. 1994, A&AS, 108, 585
- Scargle (1982) Scargle, J. D. 1982, ApJ, 263, 835
- Schatzman (1967) Schatzman, E. 1967, SoPh, 1, 411
- Schlieder et al. (2014) Schlieder, J., Bonnefoy, M., Herbst, T. M., et al. 2014, ApJ, 783, 27
- Stellingwerf (1978) Stellingwerf, R. F. 1978, ApJ, 224, 953
- Stelzer et al. (2006) Stelzer, B., Micela, G., Flaccomio, E., Neuhäuser, R., & Jayawardhana, R. 2006, A&A, 448, 293
- Treumann (2006) Treumann, R. 2006, A&ARv, 13, 229
- van Maanen (1940) van Maanen, A. 1940, ApJ, 91, 503
- Vrba et al. (2004) Vrba, F. J., Henden, A. A., Luginbuhl, C. B., et al. 2004, AJ, 127, 2948
- West et al. (2008) West, A. A., Hawley, S. L., Bochanski, J. J., et al. 2008, AJ, 135, 785
- West et al. (2004) West, A. A., Hawley, S. L., Walkowicz, L. M., et al. 2004, AJ, 128, 426
- Williams & Berger (2015) Williams, P. K. G., & Berger, E. 2015, ApJ, 808, 189
- Williams et al. (2015) Williams, P. K. G., Berger, E., Irwin, J., Berta-Thompson, Z. K., & Charbonneau, D. 2015, ApJ, 799, 192
- Williams et al. (2013) Williams, P. K. G., Berger, E., & Zauderer, B. A. 2013, ApJL, 767, L30
- Williams et al. (2014) Williams, P. K. G., Cook, B. A., & Berger, E. 2014, ApJ, 785, 9
- Wu & Lee (1979) Wu, C. S., & Lee, L. C. 1979, ApJ, 230, 621
- Zangari (2015) Zangari, A. 2015, Icarus, 245, 93