Results of the ASY-EOS experiment at GSI: The symmetry energy
at suprasaturation density
Abstract
Directed and elliptic flows of neutrons and light charged particles were measured for the reaction 197Au+197Au at 400 MeV/nucleon incident energy within the ASY-EOS experimental campaign at the GSI laboratory. The detection system consisted of the Large Area Neutron Detector LAND, combined with parts of the CHIMERA multidetector, of the ALADIN Time-of-flight Wall, and of the Washington-University Microball detector. The latter three arrays were used for the event characterization and reaction-plane reconstruction. In addition, an array of triple telescopes, KRATTA, was used for complementary measurements of the isotopic composition and flows of light charged particles.
From the comparison of the elliptic flow ratio of neutrons with respect to charged particles with UrQMD predictions, a value is obtained for the power-law coefficient describing the density dependence of the potential part in the parametrization of the symmetry energy. It represents a new and more stringent constraint for the regime of suprasaturation density and confirms, with a considerably smaller uncertainty, the moderately soft to linear density dependence deduced from the earlier FOPI-LAND data. The densities probed are shown to reach beyond twice saturation.
pacs:
21.65.Cd, 21.65.Ef, 25.75.LdI Introduction
Differences in the collective emission properties of neutrons and protons in neutron-rich heavy-ion reactions at intermediate bombarding energies have been proposed as potential observables for the study of the equation of state of asymmetric nuclear matter baoan96 ; baoan02 ; greco03 ; yong06 . Among them, the neutron-proton elliptic-flow ratio and difference have been shown to be sufficiently sensitive probes of the high-density behavior of the nuclear symmetry energy Rus11 ; Coz11 . The comparison of existing data from the FOPI-LAND experiment Lei93 ; lamb94 with calculations performed with the UrQMD transport model qli05 ; qli06 ; Li:2006ez suggested a moderately soft to linear symmetry term, characterized by a coefficient for the power-law parametrization of the density dependence of the potential part of the symmetry energy Rus11 . This result has excluded super-soft scenarios but suffers from the considerable statistical uncertainty of the experimental data.
The same data set was also compared to calculations performed with the QMD model originally developed in Tübingen khoa92 ; maheswari98 and a constraint compatible with the UrQMD result was obtained Coz11 ; Coz13 ; Rus14 . In addition, a thorough study of the parameter dependence of the model predictions was performed to devise a route towards a model-independent constraint of the high-density symmetry energy. It showed that presently acceptable limits for the choice of parameters in the isoscalar part of the transport description cause uncertainties comparable with but not larger than those of the experimental FOPI-LAND data Coz13 . It was also found that different parametrizations of the isovector part of the equation of state, the Gogny-inspired (momentum-dependent, Ref. Das:2002fr ) and the power-law (momentum-independent) potential, lead to very similar predictions for the neutron-vs-charged-particle elliptic-flow ratio or difference.
To improve the statistical accuracy of the experimental flow parameters for the 197Au+197Au reaction and to extend the flow measurements to other systems, the symmetric collision systems 197Au+197Au, 96Zr+96Zr, and 96Ru+96Ru at 400 MeV/nucleon incident energies have been chosen for the asymmetric-matter equation-of-state (ASY-EOS) experimental campaign, conducted at the GSI laboratory in May 2011 (experiment S394). As in the FOPI-LAND experiment, the Large Area Neutron Detector (LAND) LAND was used for the detection and identification of neutrons and light charged particles. Parts of the CHIMERA multidetector Pag04 ; DeFilippo14 , of the ALADIN Time-of-flight Wall schuettauf96 , and of the Washington University Microball detector BALL were used for the event characterization and determination of the azimuthal reaction-plane orientation. By including the Kraków Triple Telescope Array (KRATTA) Luk11 with isotopic identification of charged-particles up to atomic number in the setup, additional observables as, e.g., yields and flows of light-charged particles and yield ratios of the isobar pairs 3H/3He or 7Li/7Be were made available for the study of isospin effects in these reactions.
The results reported here refer exclusively to the 197Au+197Au reaction whose analysis has been completed. It is shown that the new data confirm the moderately soft to linear density dependence of the symmetry energy deduced from the earlier FOPI-LAND data. However, for technical reasons, the capabilities of the LAND detector could not be fully exploited. This had the effect that the originally intended measurement of detailed dependencies of the neutron flows on rapidity, transverse momentum, and particle type could not be fully realized. Uncertainties of some of the required corrections restricted the analysis to essentially only providing the ratio of neutron over charged-particle flows, integrated over the LAND acceptance. By comparing it with the results of UrQMD calculations adapted to the experimental acceptance and analysis conditions, a new and more stringent constraint for the symmetry energy at suprasaturation densities was derived.
The technical deficiencies of the LAND timing system, the methods developed to correct for them in the analysis, and the consequences for the obtained results are described and explained in detail in the Appendix. The confidence in the validity of the main, acceptance integrated, result is derived from the fact that it is found to be only weakly dependent on assumptions regarding details of the corrections. These uncertainties were quantitatively assessed by varying the assumptions within well-defined intervals and by treating their effects as systematic errors. These systematic and the statistical errors of the collected data set are of approximately equal magnitude.
The present work derives its importance also from the fact that the flow probe, at present, appears to be the most robust observable for testing the nuclear equation of state at high densities. The recent comprehensive study of charged-particle flows for 197Au+197Au collisions at energies from 0.4 to 1.5 GeV/nucleon reflects a remarkable consistency in its support of a soft solution for the equation of state of symmetric matter, including momentum-dependent forces reisdorf12 ; lefevre15 . It provides a narrower constraint than previously available dani02 . Such narrower limits for the compressibility of symmetric nuclear matter are very useful also with regard to the equation of state of asymmetric matter. They have the effect of reducing systematic uncertainties originating from the choice of parameters for the isoscalar sector of a transport description Coz13 .
Major efforts have recently been made to reduce the apparent systematic discrepancies in the interpretation of the FOPI pion ratios reis07 with increasingly complex transport calculations hong14 ; song15 ; yong16 ; baoanli15 ; wenmeiguo15 ; cozma16 . Of particular interest is the observation that the predicted yield ratios are expected to rise when the medium modifications of pion production thresholds are explicitly considered song15 . This effect may permit reproducing the experimental values with choices for the symmetry energy that are less extreme than those required in some of the earlier pion studies xiao09 ; feng10 ; xie13 . However, the calculations of Hong and Danielewicz hong14 exhibit only a small sensitivity of integrated pion ratios to the stiffness of the symmetry energy, pointing to the need for energy-differential observables. Further work will thus be required before pion yields and yield ratios can be reliably applied to the investigation of the high-density symmetry energy.
The important role played by the nuclear symmetry energy in nuclear structure and reactions as well as in astrophysics is the subject of several review articles baran05 ; lattprak07 ; lipr08 ; ditoro10 ; gandolfi15 . A brief introductory review of the situation at suprasaturation densities is available in Ref. Traut12 . A comprehensive list of pertinent articles has recently appeared in Topical Issue on Nuclear Symmetry Energy EPJA2014 .
II Experimental details
II.1 Setup for S394
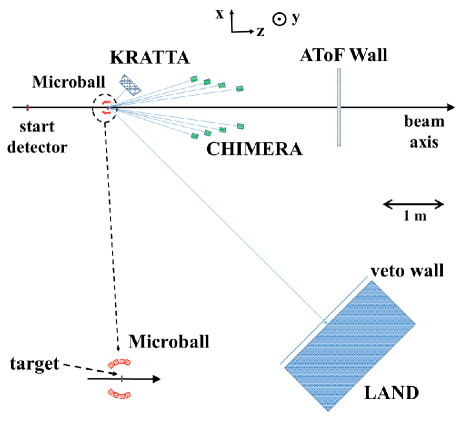
A schematic view of the experimental setup of the ASY-EOS experiment at the GSI laboratory is shown in Fig. 1. The beam was guided in vacuum to about 2 m upstream from the target. A thin plastic scintillator foil viewed by two photomultipliers was used to record the projectile arrival times and to serve as a start detector for the time-of-flight measurement. The Large Area Neutron Detector, LAND LAND , was positioned to cover laboratory angles around 45∘ with respect to the beam direction. A veto wall of plastic scintillators in front of LAND allowed discriminating between neutrons and charged particles. In this configuration, it was possible to measure the directed and elliptic flows of neutrons and charged particles near midrapidity within the same angular acceptance. Opposite of LAND, covering a comparable range of polar angles, the Kraków Triple Telescope Array, KRATTA Luk11 , had been installed to permit flow measurements of identified charged particles under the same experimental conditions. Results obtained with KRATTA will be published separately.
For the event characterization and for measuring the orientation of the reaction plane, three detection systems had been installed. The ALADIN Time-of-Flight (AToF) Wall schuettauf96 was used to detect charged particles and fragments in the forward direction at polar angles up to . Its capability of identifying large fragments and of characterizing events with a measurement of schuettauf96 permitted the sorting of events according to impact parameter. Four double rings of the CHIMERA multidetector Pag04 ; DeFilippo14 carrying together 352 CsI(Tl) scintillators in the forward direction and four rings with 50 thin CsI(Tl) elements of the Washington University Microball array BALL surrounding the target provided sufficient coverage and granularity for determining the orientation of the reaction plane from the measured azimuthal particle distributions.
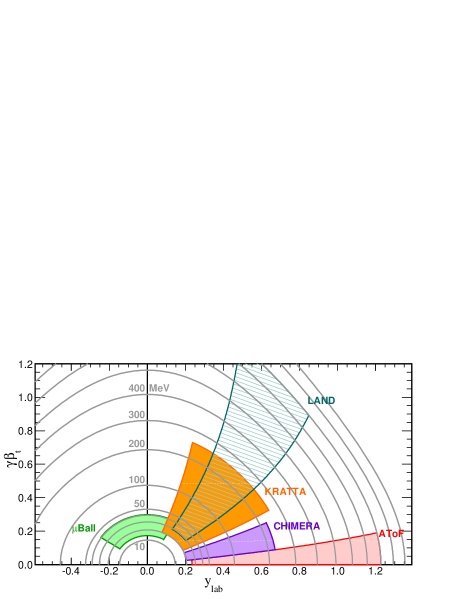
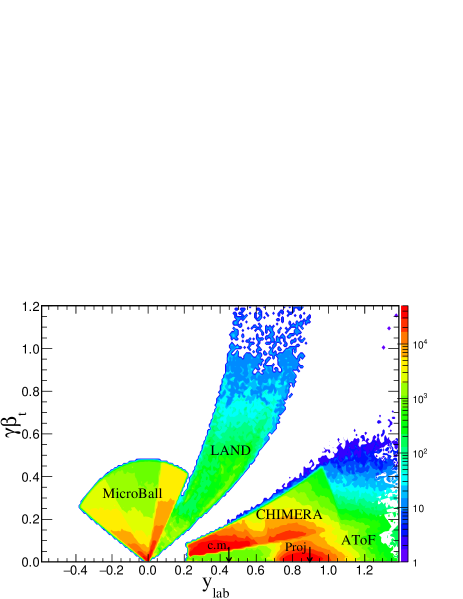
The kinematic coverage achieved with this assembly of detection systems is illustrated in Figs. 2 and 3. In Fig. 3, in particular, the enhanced particle yields in the kinematic regimes of participant and spectator emissions are clearly visible. The product yields from the decay of the projectile spectator seen with CHIMERA and the AToF Wall do not exactly match because the AToF efficiency for hydrogen isotopes in this energy range is lower than that of the CHIMERA modules.
II.2 Detection systems
II.2.1 LAND detector
The Large Area Neutron Detector, LAND LAND , upgraded with new TACQUILA electronics developed at GSI Koch05 , was positioned at a distance of 5 m from the target. Its kinematic acceptance was similar to that of the forward LAND subdetector used in the FOPI-LAND experiment Rus11 but slightly larger in rapidity for given transverse momentum owing to the shorter distance from the target. LAND consists of 10 consecutive layers of m2 area, together adding up to the 1-m depth of the detector. Each layer is formed by 20 modules of 2-m length whose orientations alternate from layer to layer between vertical and horizontal. The modules have a cm2 cross section and are built from nine sheets of iron and ten sheets of plastic-scintillator material, all 5 mm thick, arranged in alternating order and oriented parallel to the entrance plane of the detector. Two iron sheets of 2.5 mm thickness form the entrance and exit layers of each module. In this design, the iron serves as a converter and the plastic scintillators as detectors for the produced ionizing radiation.
As it turned out during the analysis, the standard method of identifying the showers generated by interacting neutrons in the full LAND assembly was not feasible because of the timing difficulties related to the use of the new electronic system (discussed in Sec. III.1 below and in the Appendix). Only 19 modules (out of 20) of the first layer of LAND are included in the present analysis. This lowers the detection efficiency for neutrons and modifies its energy dependence, effects that had to be taken into account. The resulting range of polar angles that were covered by this part of LAND was with respect to the beam direction.
A veto wall consisting of 10-cm-wide and 5-mm-thick plastic-scintillator slabs covered the front face of LAND, permitting the distinction between neutral and charged particles. The slabs were mounted in vertical orientation parallel to the modules of the first plane of LAND. Charged particles were identified on the basis of coincident hits in the veto wall, matching the time and position of the corresponding hit in LAND. However, owing to insufficient resolution achieved in the readout of the analog signals, the identification of the atomic number of the recorded charged particles on the basis of their energy loss in the veto-wall scintillators was not feasible. The comparative analysis was thus restricted to the collective flows of neutrons with respect to that observed for all charged particles detected within the acceptance of LAND.
II.2.2 KRATTA hodoscope
The Kraków Triple Telescope Array, KRATTA Luk11 , was specifically designed for the experiment to measure the energy, emission angles, and isotopic composition of light charged reaction products. The 35 modules of KRATTA were arranged in a array and placed opposite to LAND at a distance of 40 cm from the target. They covered 160 msr of solid angle at polar angles between 24∘ and 68∘. The modules of KRATTA consisted of two, optically decoupled, CsI(Tl) crystals (thickness of 2.5 and 12.5 cm) and three large-area, 500-m-thick, PIN photodiodes. The middle photodiode and the short CsI(Tl) crystal read out by the diode from its front face were operated as a single-chip telescope pasquali91 . Very good isotopic resolution has been obtained in the whole dynamic range up to Z 4. The methods used for deriving it and the virtue of using digital pulse-shape recording throughout are described in Ref. Luk11 .
II.2.3 CHIMERA hodoscope
Four double rings of the CHIMERA multidetector Pag04 ; DeFilippo14 had been transported to the GSI laboratory and installed at their nominal distances from the target, covering polar angles between 7∘ and 20∘. They carried together 352 CsI(Tl) scintillators, 12 cm in thickness and read out with photodiodes. Each of the eight individual rings provided a azimuthal coverage with either 40 or 48 modules per ring. For calibration purposes, four of the Si detectors of the regular CHIMERA setup were installed in each ring. For these telescopes, an independent digital pulse-shape acquisition system was used to investigate and improve the particle identification and calibration methods Ac13 . The recorded telescope data proved very useful for verifying the analysis schemes developed for this experiment.
The CHIMERA rings were intended for the detection and identification of light-charged particles, primarily expected to come from the midrapidity regime. In the analysis, a rapidity gate in the center-of-mass (c.m.) reference system was applied to exclusively select forward-hemisphere emissions for determining the orientation of the reaction plane.
For the use of CHIMERA modules at the present energy regime, the identification of punch-through particles was essential. In addition, the velocity of registered particles had to be reconstructed with an accuracy permitting the application of the rapidity gate. For particles stopped in the CsI, this was done using the mass number and the deposited energy of the particles resolved in the fast-vs-slow identification map.
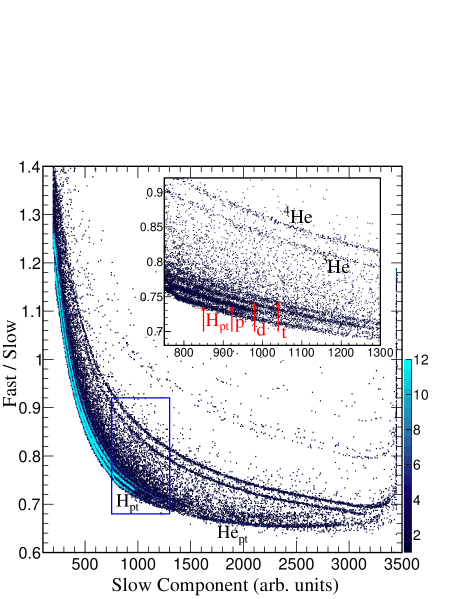
For particles punching through the CsI, their atomic number, essentially or 2, was evident in the fast-vs-slow identification plots. A most probable mass number was assigned on the basis of the measured energy loss and used to reconstruct the total kinetic energy and momentum. The mass was assigned to helium isotopes. In the case of the hydrogen isotopes, was assigned to a particle if , was assigned if , and was assigned if . Here refers to the calculated maximum energy loss deposited in the CsI(Tl) module by punch-through particles, and the subscript indicates protons, deuterons and tritons, respectively. The reconstructed total kinetic energy was then used to determine the velocity of the particle. An example of the two-dimensional maps used for the particle identification and analysis is shown in Fig. 4.
II.2.4 ALADIN ToF Wall
A central square part of the ALADIN Time-of-Flight (AToF) Wall schuettauf96 with an area of approximately 1 m2 was placed symmetrically with respect to the beam direction at a distance of 3.7 m downstream from the target. It was used to detect forward emitted charged particles and fragments at polar angles smaller than 7∘, i.e. within the opening of the forward-most CHIMERA ring. The two layers of the AToF Wall (front and rear) each consisted of 48 modules of cm2 plastic scintillators with a thickness of 1 cm and with photomultipliers mounted at their upper and lower end faces. The modules are arranged in densely packed groups of eight modules, six groups per layer, and all oriented in vertical direction. They provided the atomic numbers of the detected fragments and light charged particles, as well as their velocities and directions of emission. The threshold was set below the maximum of the distribution in the spectrum of recorded energy-loss signals. A central hole of cm2 permitted the non-interacting beam to pass undetected through the AToF Wall.
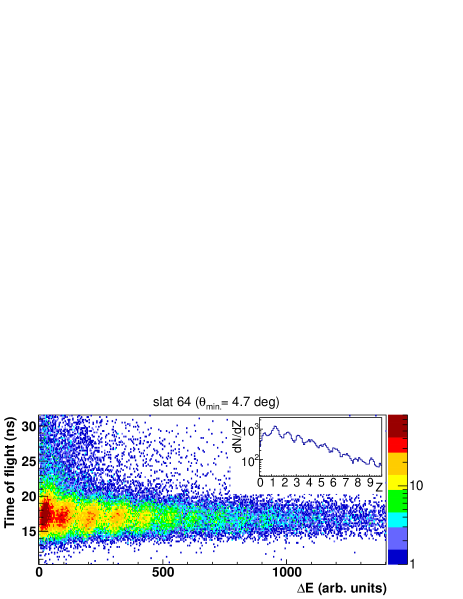
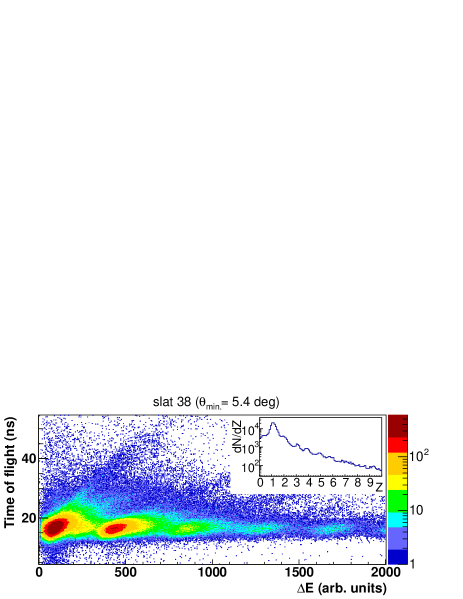
The atomic number of light fragments is individually resolved on the basis of the measured time and energy loss up to approximately , as illustrated in Fig. 5. The unusually high background appearing in these maps is attributed to interactions of the ions with air during their flight path to the detector. Heavier fragments are identified with a resolution of (FWHM) on the basis of the calibrations generated in earlier experiments with the AToF Wall schuettauf96 ; ogul11 . The time-of-flight resolution varies with , smoothly decreasing from 300 ps (standard deviation) for lithium fragments to about 100 ps for fragments with . The AToF timing signals were used to generate a reaction trigger. The minimum requirement was three recorded tracks in the front-wall modules and three recorded tracks in the rear-wall modules. The front- and rear-wall tracks are usually pairwise correlated and produced by the same particles. The central group of eight modules containing the central opening was not included in the trigger circuit. These trigger requirements had the effect of suppressing collisions producing moderate excitations. However, the forward position of the wall and the long passage of the beam through air had the effect of still producing unwanted trigger signals generated by reactions on non-target material. The methods chosen to efficiently eliminate such events in the analysis are explained below.
II.2.5 Microball
The target was surrounded by an array of 50 3.6-to-5.6-mm-thick CsI(Tl) elements of the Washington University Microball (so-called Reaction Microball BALL ). This array had four azimuthally symmetric rings, subtended the range of polar angles between 60∘ and 147∘ in the laboratory, and thus was essentially sensitive to backward emissions in the c.m. frame of the reaction. The azimuthal distributions of modules recording a hit above threshold provided a measure of the orientation of the reaction plane as seen in the rear hemisphere. The small diameter of the array of only about 10 cm offered a nearly negligible solid angle for reactions occurring downstream from the target, a property that was used for suppressing background reactions in the analysis.
II.3 Beams and targets
With beam intensities of about pps and targets of 1-2% interaction probability, about events were collected for each of the systems 197Au+197Au, 96Zr+96Zr, and 96Ru+96Ru. Additional runs were performed without a target to measure the background from the interaction of projectile ions with non-target material. The 3.7 m column of air between the target and the AToF Wall represents by itself an additional target with a theoretical interaction probability of about 6% for 197Au projectiles.
Measurements with iron shadow bars in front of LAND, with and without a target, were used to determine the background of scattered neutrons not directly originating from the target. The shadow bars consisted of several pieces of iron, together representing a block of 60 cm in thickness and shaped to precisely cover the solid-angle acceptance of the LAND detector as seen from the target position. Results obtained with the 96Zr and 96Ru beams and targets are not presented here.
III Data analysis
The analysis of the experimental data has been performed within the FairRoot software framework primarily developed for the use with the future Facility for Antiproton and Ion Research (FAIR) detectors fairroot . The FairRoot framework contains a complete simulation of the ASY-EOS detector setup and geometry and of the data analysis schemes. Theoretical calculations can be performed within the same software environment and filtered to adapt them to the experimental acceptance and analysis conditions.
III.1 LAND timing
A major difficulty arose from the fact that the new TACQUILA electronics Koch05 of the LAND detector did not permit the recognition of the very-low-energy -ray signals in the LAND modules. The absolute time calibration, therefore, had to be obtained from a spectra comparison with data of the FOPI-LAND experiment. Furthermore, the digital timing information was found to be frequently, with approximately 30% -40% probability, affected by ns time jumps, arising from errors in counting the number of 25-ns clock cycles occurring between the start and the stop signals in a time measurement. These uncertainties were identified and corrected with procedures that are described in detail in the Appendix. Where possible, recourse was taken by comparing with or adjusting to existing data from previous FOPI and FOPI-LAND experiments.
The goal pursued in the present analysis consisted in applying the evident corrections and in quantifying the uncertainties associated with correction steps that could not be unambiguously determined. For the time-resolved differential data, the main uncertainty arises from the so-called second correction step, devised for wrongly recorded hits not recognized in the first correction step (see the Appendix). In addition to recovering the correct times of the intended class of hits, it has the side effect of misplacing an unknown number of valid hits in the time spectra. This causes a mixing of the flow properties within the affected time intervals. The problem was investigated by applying the second correction to randomly chosen fractions of the selected group of candidate hits and by comparing the consequences with data sets obtained in FOPI measurements reisdorf2013 . It is shown that the mixing affects the deduced flow parameters but, to a much smaller extent, the flow ratios. Its contribution to the systematic error of the power-law exponent amounts to .
This particular correction and the mixing that it causes play only a minor role for the acceptance-integrated results obtained after integrating over the full time spectra. Timing errors have no consequence here as long as they do not lead beyond the limits of the integration interval. A remaining source of uncertainty is the precise choice of the low-energy thresholds as it should match their counterparts in the calculations. For charged particles, the threshold energy is given by the requirement to pass through the veto wall and to reach the first scintillator plane of LAND, for protons about 60 MeV. It is thus independent of the time measurement, provided the hit is within the accepted time interval. For neutrons, the low-energy threshold is defined by the chosen integration limit at long times-of-flight. Timing errors are effective here. To minimize the overall uncertainty, the integration limit was placed at times of flight much longer than expected for charged particles and into a low-intensity region less affected by the timing corrections (see the Appendix). Its nominal value corresponded to 30 MeV kinetic energy for nucleons. The level of remaining uncertainties was determined by varying the integration limit within a wide interval and by comparing with calculations performed with corresponding energy thresholds for neutrons. As observed in the differential case, the flow ratios are only mildly affected because uncertainties cancel. The observed variation of represents the overall systematic error arising from the LAND timing properties.
III.2 Impact parameter determination
For selecting according to impact parameter, global variables were constructed from the CHIMERA and AToF data. They included
| (1) |
and the ratio of transverse to longitudinal charge,
| (2) |
with an arbitrarily chosen scale factor 10 and with
| (3) |
where is the polar angle of the particle in the laboratory reference system. is close to the charge of the primary spectator system and monotonically correlated with the impact parameter, while ZRAT increases with the centrality of the reaction. The choice of these variables as impact parameter selectors has been guided by performing UrQMD calculations for given impact parameter ranges and filtering the simulated reaction events for angular acceptance, detection thresholds, and resolution of the detectors.
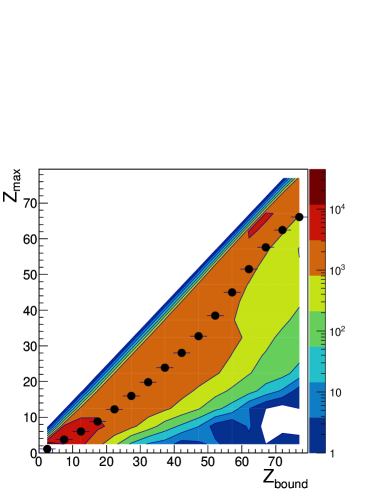
For constructing , fragments recorded with CHIMERA and the AToF Wall were used where not otherwise indicated. Larger fragments () are exclusively expected at very forward angles, well within the kinematic acceptance of of the AToF Wall (cf. Figs. 4 and 5). The evolution of the largest atomic number, , observed in an event as a function of , here from AToF alone, is shown in Fig. 6. The relative behavior of these two observables resembles closely that known from earlier results reported by the ALADIN Collaboration for the 197Au+197Au reaction schuettauf96 ; traut07 . Only for large is a difference observed, as does not reach up as close to the projectile as it did in the ALADIN experiments with different trigger conditions. The trigger chosen for the present experiment suppressed the most peripheral events with a small multiplicity of charged particles and a corresponding near .
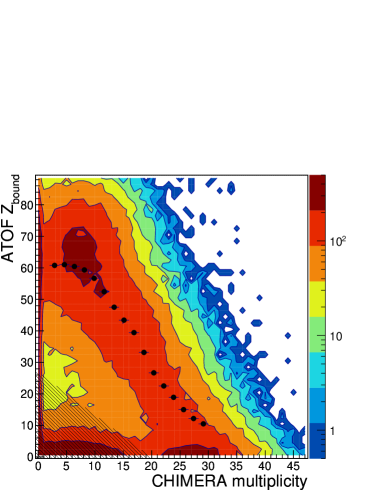
The expected anticorrelation of as determined from AToF alone, rising with impact parameter and the multiplicity of charged particles measured with the CHIMERA rings at intermediate angles is observed as well (Fig. 7). The group of events with both small and small multiplicities detected with CHIMERA (hatched area in the figure) is interpreted as containing nearly undeflected heavy projectile fragments that have passed undetected through the central hole of the AToF Wall. Such events are expected from very peripheral 197Au+197Au collisions as well as from the interaction of the beam with N or O nuclei of the air downstream of the target. The class of events within the hatched region was not further considered in the analysis.
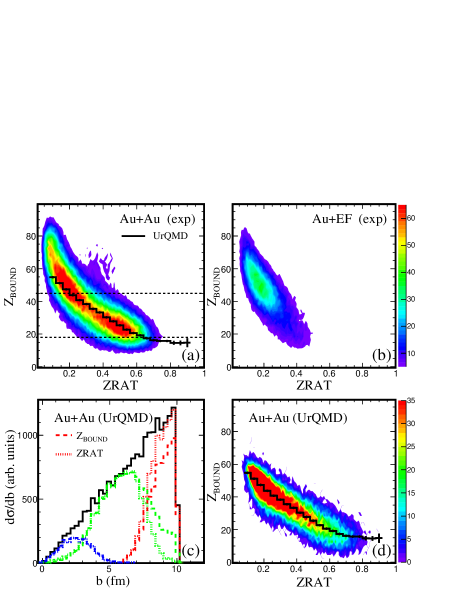
(Bottom row) UrQMD calculations for the correlation of vs ZRAT for 197Au+197Au collisions at 400 MeV/nucleon and impact parameter fm, filtered to match the experimental conditions (d), and for impact-parameter distributions d/d obtained under various conditions (c). The unbiased distribution for the full reaction for fm is given by the black (solid) histogram while the blue, green, and red lines show impact parameter distributions obtained when selecting very central, semicentral, and peripheral event classes, respectively, by gating either on (dashed) or on ZRAT (dotted, see Table 1). The dashed horizontal lines in (a) represent the corresponding gates for the selection. The line of centroids as a function of ZRAT of the UrQMD distribution of (d) is drawn into the experimental distribution (a).
The correlation of with ZRAT, as obtained from the combined CHIMERA and AToF data for 197Au+197Au collisions at 400 MeV/nucleon, are presented in Fig. 8 (a). The two impact-parameter sensitive quantities are globally anticorrelated as expected: grows while ZRAT drops with increasing impact parameter. For orientation, ZRAT = 0.15 is obtained for particles detected at the forward limit of the CHIMERA acceptance , ZRAT = 1.3 for particles detected at the largest angle , and ZRAT for a homogeneous distribution within the CHIMERA acceptance. The observed distribution is compatible with these limits. Values smaller than ZRAT = 0.15 are suppressed by the trigger condition of four or more charged particles detected with CHIMERA and two or more hits recorded by the Microball by which peripheral collisions are suppressed. In addition, the adopted condition requiring an anticorrelation of the preferential azimuthal directions of these particles observed with CHIMERA and with the Microball was applied (see Sec. III.4). A very similar pattern is observed for the result of UrQMD calculations, performed for the range of impact parameters fm [Fig. 8(d)]. The centroid line deduced from the simulations follows the experimental distribution shown in panel (a) rather well.
The correlation observed when the target foil is removed is shown in panel (b) of Fig. 8. The yields are normalized with respect to the integrated beam intensity, so that the much lower intensity of background reactions becomes evident. They display a similar anticorrelation, however much less pronounced and extending mainly over the range typical for the more peripheral collisions in the 197Au+197Au case. The observed concentration of background events at large also coincides with the expectation for collisions of 197Au beam particles with predominantly 14N encountered downstream of the target location hubele91 . The initially high yield of AToF trigger signals from 197Au+air collisions is reduced to the apparent low level by applying the conditions on the multiplicity and azimuthal orientation of Microball hits within the event.
| Class, interval | ZRAT | |||||
|---|---|---|---|---|---|---|
| min | max | min | max | |||
| very central, fm | 0 | 18 | 2.56 | 0.615 | 2.0 | 2.51 |
| semi-c, fm | 18 | 45 | 6.18 | 0.245 | 0.615 | 5.71 |
| peripheral, fm | 45 | 8.74 | 0.245 | 8.76 | ||
| central, fm | 0 | 45 | 5.69 | 0.245 | 2.0 | 5.27 |
| FOPI, fm | 19 | 33 | 5.00 | 0.365 | 0.585 | 4.69 |
For the actual impact-parameter selections within the range of interest fm, the global observables and ZRAT were used. The intervals chosen to select very central, semicentral and peripheral event classes are listed in Table 1 together with the mean impact parameters expected for these classes according to the UrQMD calculations. The condition on multiplicity specified above provided no additional restriction within this range of central and semicentral collisions [cf. Fig. 8(a)]. The quality of the resolution that can be expected, according to the UrQMD model, is illustrated in panel (c) of Fig. 8. The examples of very central, semicentral and peripheral selections with nominal impact-parameter intervals of fm, fm, and fm, respectively, are displayed. The expected smoothing of the boundaries of the actually selected intervals is about equal for the and ZRAT observables. The interval chosen for generating the acceptance-integrated flow ratio in the final analysis is a nominal fm, listed as central class in the table. As the calculations show, the actual distribution can be expected to contain nearly all events with fm and, with decreasing probability, a selection of events with impact parameters up to fm.
III.3 Reaction plane orientation
For the experimental estimates of the azimuthal orientation of the impact-parameter vector, both CHIMERA and AToF data were used. In the CHIMERA analysis, a vector Dan85 was calculated as
| (4) |
with the transverse-velocity vectors and with , i.e. by requiring at least four identified particles recorded by CHIMERA. An important factor in the -vector definition is the weight factor for emissions in the forward (backward) hemisphere in the c.m. system. It is omitted here because emissions in the forward hemisphere are exclusively selected with the condition on rapidity . The vector represents a - and transverse-velocity-weighted, i.e. approximately transverse-momentum-weighted, direction in the plane perpendicular to the beam direction.
In the AToF analysis, a second vector has been determined from the recorded positions of the interaction of detected fragments with the Time-of-Flight Wall. The horizontal coordinates were determined with the uncertainty given by the slat widths of 2.5 cm. It reduces to 1.25 cm if the fragment was identified in both layers as observed in most cases. The vertical coordinate was determined from the measured difference of the top and bottom time signals, and a resolution of typically about cm was obtained. The distance to the beam axis, under the assumption of approximately beam velocity, is proportional to the transverse velocity of the detected particle or fragment. The resulting azimuthal vector was weighted with the atomic number of the fragment and was obtained by summing over all individual vectors within an event. Also here, the weight factor can be omitted as the AToF acceptance of strongly favors projectile fragments. A time-of-flight gate selecting forward emissions in the c.m. frame was used in addition.
The resolution obtained with these two quantities is overall comparable but depends somewhat on the impact parameter. Peripheral collisions associated with small multiplicities in the CHIMERA part of the recorded event may be more easily characterized with the heavy fragments seen in AToF while more central collisions leading to high CHIMERA multiplicities may produce only few light fragments within the acceptance of the AToF Wall. As it turned out, in the impact parameter range of interest, central with fm, only about 10% of the events permitted the calculation of a vector from AToF hits alone. Because the AToF geometry is not azimuthally symmetric, the resulting inclusive -vector distributions are not fully isotropic.
With the Microball data, the reaction-plane orientation was estimated by summing over the azimuthal directions of the recorded hits. A vector has been calculated as
| (5) |
where is the azimuthal unit vector in the direction of the location of the detector module that recorded the hit. A minimum multiplicity of was imposed. In this case, the weight factor has been omitted because the rapidity of the detected particles was not determined even though the Microball acceptance of can be expected to select mainly backward emissions. As shown below, the orientation of was indeed found to be opposite to those of the CHIMERA and AToF vectors.
(Bottom row) Distributions of the difference of orientations of the subevent reaction planes for the same three event classes, peripheral (d), semicentral (e), and very central (f), obtained with the mixing technique of Refs. Ollxx ; Oll98 and by using the weight (see text and Table 2). The corresponding values of the reaction-plane dispersion parameter are indicated.
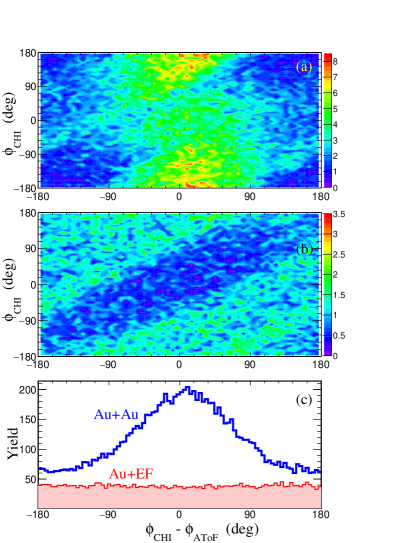
The three -vectors are strongly correlated. The degree of coincidence of the azimuthal orientations of the vectors and for the class of events containing a valid is shown in Fig. 9. The individual reaction-plane orientations obtained from the CHIMERA and AToF Wall data are evidently very similar. With the target foil removed [panel (b)], the coincidence of orientations is no longer present; the correlation pattern is dominated by the slightly reduced acceptance of AToF in the region near 0∘. The resulting distributions of the difference is shown in the bottom panel. The azimuthal angle that is used here and in Figs. 10 and 11 is defined in accordance with the chosen coordinate system (Fig. 1), with coinciding with the and with the direction. The applied condition requiring that the CHIMERA and Microball orientations are within the adopted anticorrelation gate of suppresses unwanted background, as discussed in Sec. III.4 in more detail.
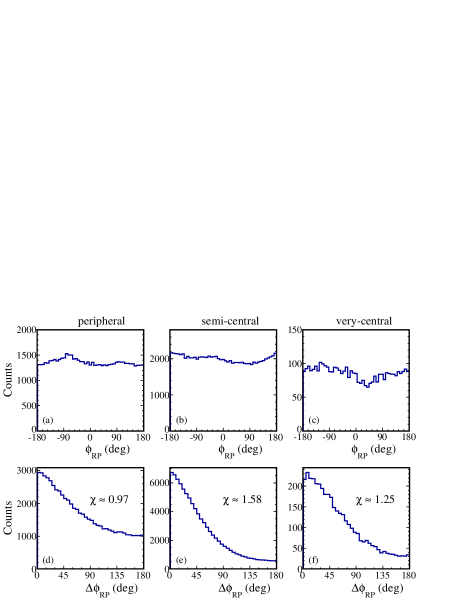
The inclusive reaction-plane distributions, as given by the combined -vectors obtained by summing over recorded hits in CHIMERA and AToF for three choices of impact-parameter windows, are shown in the top row of Fig. 10. The observed flatness indicates that the particle angular distributions have not been biased by variations of the detector efficiencies, by properties of the event triggering or by other azimuthal asymmetries in the experiment.
Several different methods of estimating the reaction-plane orientation were applied to the data to identify possible systematic uncertainties related to it. They are all based on the -vector method of Ref. Dan85 but differ in the kinematic quantities used as weights for summing over the included particles and fragments. Besides the product [cf. Eq. (4)], equal weights for all particles and the atomic number alone of each particle were also used as weights for summing over the azimuthal directions of the recorded hits either in both CHIMERA and AToF or in CHIMERA alone. It was, in addition, investigated as to what extent the result varies with the value of the rapidity gate chosen for selecting the forward hemisphere in the c.m. reference frame.
| Detectors and chosen weight | ||
|---|---|---|
| CHIMERA alone, equal weight | 1.39 | 1.30 |
| CHIMERA+AToF, equal weight | 1.45 | 1.37 |
| CHIMERA alone, | 1.51 | 1.42 |
| CHIMERA+AToF, | 1.58 | 1.50 |
| CHIMERA alone, | 1.52 | 1.42 |
| CHIMERA+AToF, | 1.59 | 1.49 |
The criterion chosen for this investigation was the achieved resolution of the reaction-plane orientation. It determines the necessary corrections and the uncertainty associated with the obtained flow parameters And06 . It was evaluated with the subevent mixing technique as described in Refs. Ollxx ; Oll98 and quantified through the resolution parameter . This parameter is inversely proportional to the width of the difference distribution of subevent orientations, assumed to be Gaussian in the present case (cf. Ref. And06 ). Examples of difference distributions obtained for selected intervals of impact parameter are given in the bottom row of Fig. 10, including the corresponding results for . The resolution parameters obtained with the studied choices of weights and detector systems are listed in Table 2 for the class of semicentral events. The best resolution, indicated by the largest value for , has been achieved using the product as the weight and by summing over the recorded hits with in both CHIMERA and AToF. All the results shown in the following sections were obtained with this choice. It is interesting to note, however, that other choices for the weighting factors lead to very comparable results (Table 2).
The correction factors resulting from the so determined dispersion of the reconstructed reaction plane were obtained according to Ref. Ollxx ; Oll98 . Resolution parameters in the range of 1.2 to 1.6 (Fig. 10) correspond to attenuation factors of approximately 0.8 to 0.9 for , i.e., for the case of directed flow, and from 0.5 to 0.65 for the elliptic flow (). Their inverse values represent the correction factors to be applied to the Fourier coefficients describing the measured azimuthal anisotropies. The validity of the method used for determining the reaction-plane orientation and its experimental dispersion were confirmed by a comparison of collective flows obtained from the KRATTA and from FOPI data reisdorf2013 for the same reaction. Excellent agreement is obtained for directed and elliptic flows of hydrogen and helium isotopes within the common acceptance of the two experiments kupny2014 .
(Bottom row) Difference of the -vector orientations for Au+Au and for Au+EF data (c), normalized with respect to the integrated beam intensity (BP stands for beam particles), and the raw hit multiplicities (d) registered with LAND for Au+Au (solid line) and for Au+EF data sets (dotted line). The hatched area in (c) indicates the range of events rejected by the required anticorrelation of the CHIMERA and Microball -vector orientations (Sec. III.4).
III.4 Background corrections
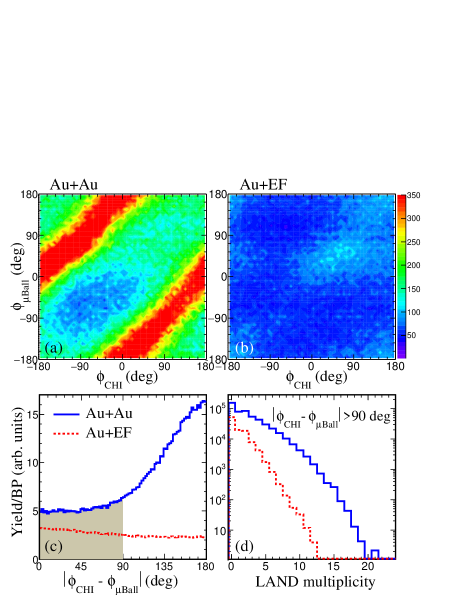
For rejecting background reactions owing to the interaction of Au projectiles with non-target material, the correlation of the -vector orientations as given by CHIMERA and by the Microball detectors was used. Figure 11 shows the correlation between their azimuthal directions, and , for 197Au+197Au reactions (a) and 197Au+empty frame (b) data, normalized relative to each other with respect to the integrated beam intensities. The strong anticorrelation for on-target reactions is evident. It is expected because forward-emitted particles were selected with CHIMERA () and the Microball covers mainly the backward hemisphere in the c.m. frame.
In runs with empty target frames, the recorded yields are low and only a weak positive correlation is observed. The distribution of differences between the two -vector orientations, normalized with respect to the integrated beam intensity, is presented in panel (c). To minimize the contributions of non-target collisions in the data analysis, an anticorrelation of the CHIMERA and Microball -vector orientations was required. The applied condition led to a relative weight of background reactions of less than 20%. It underlines the importance of the Microball data for identifying and rejecting off-target reactions.
Panel (d) of Fig. 11 shows the LAND raw multiplicity (number of modules hit per event), normalized with respect to the integrated beam intensity, for 197Au+197Au and 197Au+empty frame data and after applying the CHIMERA-Microball anticorrelation condition. The contribution from non-target backgrounds in the kinematic region of LAND is weak, starting with less than 20% at unit multiplicity to much less than 1% at multiplicity 10. In the final analysis, normalized yields of the remaining non-target background events were subtracted from the corresponding 197Au+197Au data sets.
IV Experimental results
Azimuthal distributions of neutrons and light-charged particles measured with LAND with respect to the reaction plane determined with the CHIMERA and AToF detectors, as described in the previous section, were extracted for 197Au+197Au reactions from data collected with and without a target and without and with the shadow bar in front of LAND. After subtracting the measured and normalized background yields, the obtained distributions were fitted with the Fourier expansion
| (6) |
to determine the coefficients describing the observed directed () and elliptic () flows. represents the azimuthal angle of the momentum vector of an emitted particle with respect to the determined reaction plane And06 . Owing to insufficient resolution, charge identification with the E-vs-time-of-flight technique has not been possible with LAND in the present experiment. Therefore, results only for neutrons and for all recorded charged particles are presented in the following.
IV.1 Timing corrections
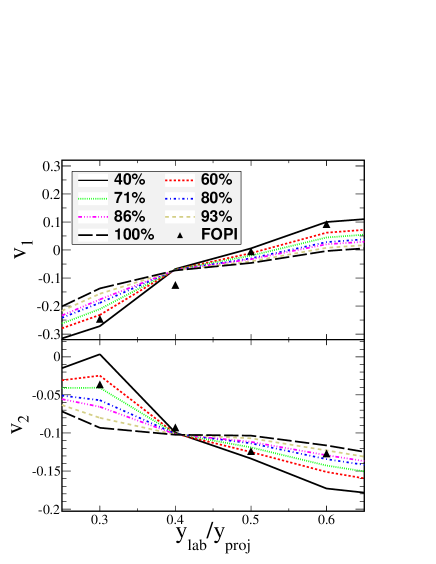
The timing information of particles detected with LAND in these data sets had been corrected as described in Sec. III.1 and in the Appendix. One of the unknown parameters appearing in this procedure was the number of particles misplaced or wrongly corrected in the so-called second step. Therefore, a series of analysis runs was performed in which the percentage of particles subjected to it was reduced from 100% to 40% in steps of increasing width. The resulting flow parameters are shown in Fig. 12 as a function of the reduced rapidity . It is observed that the influence of the second correction is negligible at rapidities but significant at lower and higher rapidities. At a reduced rapidity , the acceptance of LAND in this experiment selects transverse momenta of approximately 0.3 to 0.5 GeV//nucleon for which the discussed effect is, apparently, less severe. As expected for a mixing between time intervals, the modifications at low and high rapidities occur in opposite directions for both the directed and the elliptic flows.
For the data selected for this purpose, an interval of nominal impact parameters fm was chosen because corresponding flow data have been made available by the FOPI Collaboration reisdorf2013 . It is contained within the semicentral event class and its parameters are listed in the bottom line of Table 1. The comparison is not meant to identify a “best” percentage at which the problem will largely disappear. It only shows that the 100% application of the second step does not necessarily lead to improved flow values, consistent with the observation made for the time spectra discussed in the Appendix. It also suggests an application with 40% as a useful lower limit. Variations within this interval of 40% to 100% are considered as suitable for quantifying the contribution of the mixing and the underlying timing uncertainty to the systematic error of the measurement. It applies mainly to the flow parameters deduced as a function of rapidity or of transverse momentum. The effect is of minor importance for the acceptance-integrated flow ratios based on time-integrated particle yields.
IV.2 Collective flow
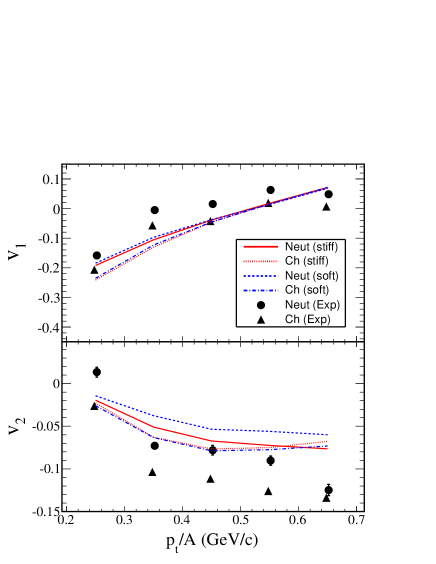
Flow parameters obtained after correcting for the dispersion of the reaction plane are shown in Fig. 13 as a function of the transverse momentum per particle . They are integrated over the rapidity range covered by the LAND acceptance which increases with from to 0.7 (cf. Fig. 1 of Ref. Rus11 ). The observed yield of particles decreases rapidly with increasing transverse momentum, so that the low-intensity regions at high are more strongly affected by occasionally misplaced particles originating from the regions of high yield at lower . For this reason, the analysis is restricted to transverse momenta GeV/. The selected range of nominal impact parameter is fm (central event class), and a fraction of 80% is chosen for the application of the second correction step discussed above, compatible with the comparison of elliptic-flow results shown in Fig. 12. The coefficient rises from negative values for small to small positive values at , reflecting the correlation of transverse momentum with rapidity caused by the acceptance of LAND. The coefficient is small at small and assumes values below at larger , indicating the strength of particle squeeze-out in the directions perpendicular to the reaction plane.
V Interpretation with UrQMD
As in the earlier FOPI-LAND study Rus11 , the ultrarelativistic QMD (UrQMD) model of the group of Li and Bleicher qli05 ; qli06 ; Li:2006ez has been employed to deduce the density dependence of the nuclear symmetry energy. Even though alternative parametrizations have recently become available wang14a ; wang14b , the version employed in the FOPI-LAND study was used again, so as to permit a direct comparison of the density dependencies obtained from the two experiments. The differences are, furthermore, not very large. In the study presented by Wang et al. using a variety of Skyrme forces a very comparable stiffness parameter MeV was obtained, differing from the original result MeV by only a few MeV Rus11 ; wang14b . The parameter
| (7) |
is proportional to the slope of the symmetry energy at saturation (see, e.g., Ref. lipr08 ).
The UrQMD model was originally developed to study particle production at high energy bass98 . By introducing a nuclear mean field with momentum-dependent forces, it has been adapted to the study of intermediate-energy heavy-ion collisions qli09 . The chosen equation of state is soft. The updated Pauli-blocking scheme, introduced to provide a more precise description of experimental observables at lower energies, is described in Ref. qli11 . Different options for the dependence on isospin asymmetry were implemented. Two of them are used here, expressed as a power-law dependence of the potential part of the symmetry energy on the nuclear density according to
| (8) |
with and corresponding to a soft and a stiff density dependence.
The UrQMD predictions for these two choices are shown in Fig. 13 in comparison with the experimental data for both neutrons and charged particles. A filtering procedure was used to adapt the results to the experimental conditions. They qualitatively follow the experimental flow values, even though the predicted squeeze-out is less pronounced than that observed. A significant sensitivity with respect to the stiffness of the symmetry energy is visible for the elliptic flow of neutrons. By comparing it to the strength of the charged-particle flow in the form of flow ratios or differences, this sensitivity is expected to be preserved, even in the presence of a global over- or underprediction of the elliptic flows Rus11 ; Coz11 .
The slight underprediction is known to be related to the so-called FP1 parametrization for the momentum dependence of the elastic nucleon-nucleon cross sections in the default version of the UrQMD model that was used here. UrQMD studies of the reaction dynamics at intermediate energies have shown that the in-medium modification of the elastic nucleon-nucleon cross-sections is an important ingredient for realistic descriptions, and various parametrizations have been tested wang14a . In the previous FOPI-LAND study, additional calculations were performed with the FP2 parametrization, causing the elliptic-flow parameter to be slightly overpredicted. The absolute values of obtained with FP1 and FP2 differ by for this reaction qli11 ; qli10 . The calculated ratios retain, nevertheless, the sensitivity of the elliptic flow to the stiffness of the symmetry energy and depend only weakly on the chosen parametrization for the in-medium cross sections Rus11 .
The systematic study of the residual model dependence of transport descriptions of the elliptic-flow ratios and differences by Cozma et al. Coz13 has, in addition, demonstrated that the Tübingen QMD transport model used there leads to equivalent results regarding the deduced stiffness of the symmetry energy. In particular, also the impact of including or neglecting the momentum dependence of the symmetry potential was investigated with different parametrizations. Important input quantities identified by this study were the isoscalar compressibility and the width of the nucleon wave function employed in the calculations. Narrower constraints for these quantities will reduce the theoretical uncertainties. A quantitative study of the model differences between the UrQMD and the Tübingen versions was performed by Wang et al. wang14b . Expressed in terms of the central value obtained for the slope parameter , an uncertainty of MeV may be ascribed to the observed model dependence of the UrQMD versus the Tübingen-QMD analyses.
Besides the momentum-dependence of the symmetry potential Das:2002fr ; baoan_mdi04 ; Gio10 ; feng12 ; leizhang12 ; Xie15 , attention has to be paid to the recent observation of short-range correlations subedi08 ; hen14sc , leading to larger tails of the momentum distributions in symmetric matter than in pure neutron matter and to a reduction of the kinetic part in the parametrization of the symmetry energy carbone12 ; rios14 ; liguoshi15 . It will be interesting to incorporate these correlations in transport models and to explore their consequences hen15 ; caili16 . However, in a first study yong16 , the effect for elliptic-flow ratios was found to be negligibly small for the case of a mildly soft to linear density dependence of the symmetry energy that is supported by the present data. It is, nevertheless, evident that the improvement of current theoretical descriptions is an important goal for the future. Reducing theoretical uncertainties and enhancing their consistency junxu16 , will permit tighter constraints for the high-density dependence of the symmetry energy.
The UrQMD transport program is stopped at a collision time of 150 fm/ and a conventional phase-space coalescence model with two parameters is used to construct clusters. Nucleons with relative momenta smaller than and relative distances smaller than are considered as belonging to the same cluster. The values GeV/ and fm have been adopted as standard parameters. With these values the overall dependence of cluster yields on is rather well reproduced but the yields of particles are underpredicted Rus11 . In the comparison with the FOPI data set used for Fig. 12, after normalization with respect to , an underprediction by a factor 1.4 was observed. The yields of deuterons and tritons in central collisions are also underestimated by similar factors.
Constraints for the symmetry energy were determined by comparing the ratios of the elliptic flows of neutrons and charged particles (ch), , with the corresponding UrQMD predictions for the soft and stiff assumptions. Because hydrogen isotopes could not be selected, as done in the FOPI-LAND study Rus11 , a test was performed for confirming the equivalence of results obtained when including all recorded charged particles in the analysis. For this purpose, the data of the FOPI-LAND experiment were analyzed with and without the condition applied in the charged-particle selection and with the limitation GeV/ of the integration interval in transverse momentum. The corresponding power-law coefficients were determined by comparing with UrQMD calculations performed with the same conditions. In addition, the effect of enhancing the weight of the contribution to the calculated -integrated flow was tested. Because good agreement was obtained with an enhancement factor 1.4, corresponding to the observed underprediction, it was used as default option in the analysis. Overall, the changes observed in these tests for the central values were less than , accompanied however by the larger statistical error of the FOPI-LAND data set.
V.1 Differential data
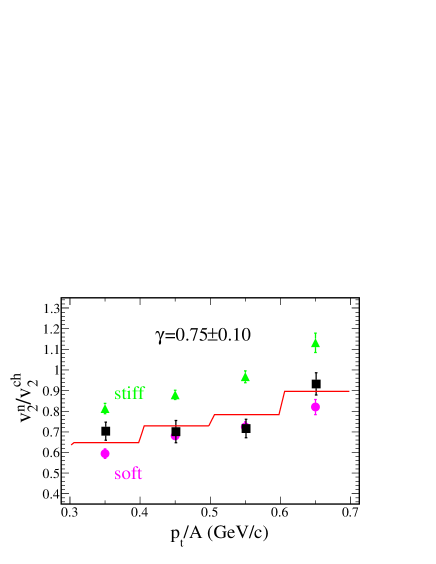
The ratio obtained from the present data for the class of central ( 7.5 fm) collisions as a function of the transverse momentum per nucleon is shown in Fig. 14. The chosen fraction for the second step of timing corrections (see Sec. IV.1) is 80%, compatible with the comparison with FOPI data presented in Fig. 12. Under this assumption, the best description of the neutron-vs-charged-particle elliptic flow is obtained with a power-law coefficient , where is the statistical uncertainty returned by the fit routine. It results from linearly interpolating between the predictions for the soft, , and the stiff, , predictions of the model within the range of transverse momentum GeV/.
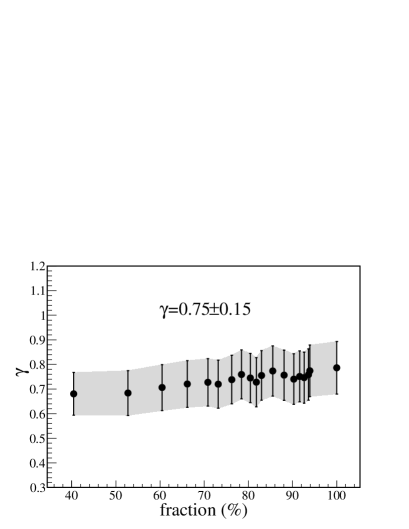
The dependence of the resulting on the choice made for the second timing correction in the data analysis is shown in Fig. 15. Under the assumption that the second correction should be applied to at least 40% of the corresponding particles, the 1- error margins are confined within the interval as apparent from the figure. The larger error is expected to include the systematic uncertainty caused by the existence of misplaced hits, not identified in the first step and only partly included in the second step of the timing correction scheme of the analysis.
V.2 Acceptance-integrated flow ratio
The new constraint deduced in the preceding section is slightly lower but still within the uncertainty interval of the previous value deduced from the FOPI-LAND data and the same UrQMD model Rus11 . The error is significantly reduced by a factor of more than two. To confirm the validity of the obtained result and to minimize complications arising from the time-of-flight measurement with LAND, an acceptance-integrated flow ratio was determined by integrating over the full spectrum shown in Fig. 21 in the Appendix. It includes all recorded particles irrespective of their actual location within this spectrum. The corresponding UrQMD calculations were integrated over the full acceptance of LAND as given by the covered interval of laboratory angles. The thresholds and the energy and particle-type dependent detection efficiency of the effectively used first plane of the LAND detector behind the veto wall were taken into account (Fig. 16). The efficiency calculations were carried out with Geant3 within the FairRoot software framework fairroot .
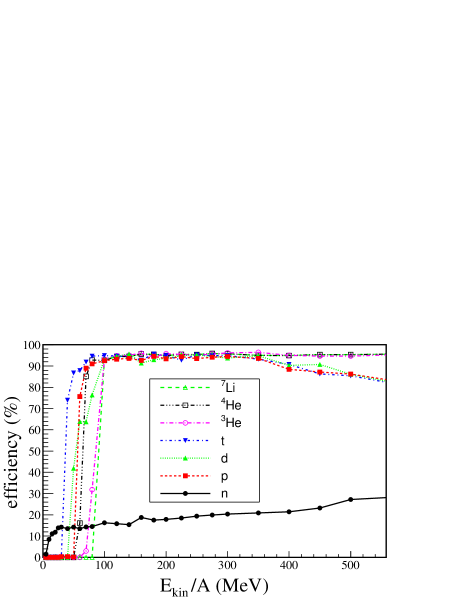
The still remaining uncertainty arising from this procedure is connected with the choice of the upper limit of the time-of-flight interval which determines the lower threshold of the neutron energy. For protons to pass through the veto wall and to be detected in a LAND module, a minimum energy of about 60 MeV is required while neutrons with lower energies may still be detected (Fig. 16). The magnitude of this effect has been assessed by varying the upper limit of time-of-flight integration between 60 and 90 ns, resulting in a slight variation of the obtained flow ratio and the exponent . The UrQMD calculations were performed for this purpose with kinetic-energy thresholds that corresponded to the chosen integration limit for neutrons and the physical lower detection thresholds for charged particles. Acceptance-integrated elliptic-flow values were then determined from the azimuthal anisotropy of the obtained yields and the linear interpolation between the predictions was used to determine the corresponding exponents .
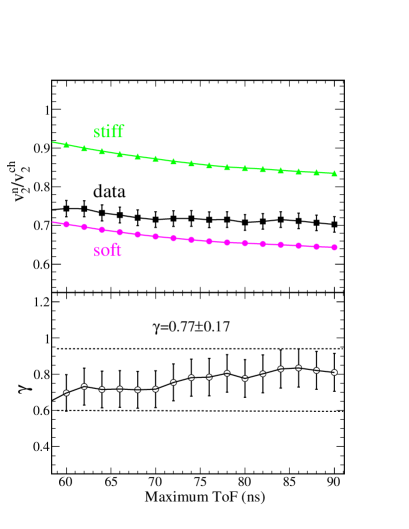
The results for the measured and calculated acceptance-integrated flow ratios and the resulting are shown in Fig. 17. A small monotonic variation of with the assumption regarding the upper limit of the ToF interval is evident. The 1- error margins are confined to the interval . It overlaps with the interval obtained by varying the fraction of hits included in the second correction step (Fig. 15). This is not unexpected as the two methods are both aiming at quantifying the remaining consequences of not recognized simultaneous timing errors of the two signals from a paddle. The variation of the maximum of the interval, in addition, includes the effect of a possible smearing of the energy threshold for neutrons and charged particles by the 25-ns time jumps.
V.3 Final corrections
Up to this point, the effects of charge-changing processes, nuclear or instrumental, have been ignored in the analysis. The largest effects of this kind are caused by misidentifications of charged particles as neutrons, because of a missing veto signal, and of neutrons as charged particles because of a neutron-induced reaction in a veto panel that produces a signal. Nuclear charge-exchange reactions with cross sections on the level of millibarn are less important in comparison (see, e.g., Refs. anderson96 ; tanihata15 ). Furthermore, protons converted into neutrons in the veto wall may still have left a signal there while neutrons converted to protons are included in the measured, rather small, efficiency for neutron detection of the thin veto paddles (see below). Misidentifications reduce the difference between the measured flow patterns and thus cause a small increase of the apparent flow ratio. The resulting symmetry-term coefficient appears stiffer than without these effects.
Calculations within the R3BRoot simulation framework fairroot have been performed with different assumptions regarding the detector response and particle recognition. In particular, the particle-dependent detection thresholds have been taken into account (Fig. 16). The obtained reduction of the power-law exponent varied between and -0.07, with the lower and upper boundaries being obtained with the most extreme assumptions.
The magnitude of the required correction is, qualitatively, easily understood. A 1-mm gap between veto paddles causes an inefficiency of approximately 1%. It may cause the equivalent amount of charged particles to appear as neutrons in the analysis. As charged particles by nature, they have a five-fold higher probability for being detected in the first layer of LAND. By taking into account the known yield ratio of charged particles over neutrons of approximately 2/3 and the measured flow ratio of (Fig. 17), a corrected ratio is obtained. With the sensitivity of the flow ratio as represented in the figure, the correction amounts to . It represents an upper limit for this particular effect because the veto paddles are aligned with respect to the elements of the first plane of LAND and not all particles passing through the veto gaps are recorded. As an analysis detail, we note here that in testing the coincidence of timing signals in the veto wall and first plane of LAND the possibility of undetected -ns displacements of one of the signals was taken into account (errors in the positions derived from the time signals have all been corrected, see Appendix). Other processes exist but are less important. The detection probability for neutrons in the 5-mm veto paddles is below 1% (cf. Fig. 1 of Ref. LAND ) and the coincidence requirement of a matching hit in the first module of LAND further reduces the probability of misidentifications of this kind. In the simulations, all these effects are included.
The adopted reduction leads to a final result for the power-law coefficient . The quoted uncertainty is obtained by a linear addition of the systematic error of the correction and the uncertainty resulting from the comparison of the acceptance-integrated flow ratio with the UrQMD calculations (Fig. 17). The possibility of charge misidentifications considered here has not been taken into account in the FOPI-LAND analysis. There its magnitude appears small in comparison with the uncertainty of this earlier result. It was also not included yet in presentations of preliminary ASY-EOS results at conferences russotto15 .
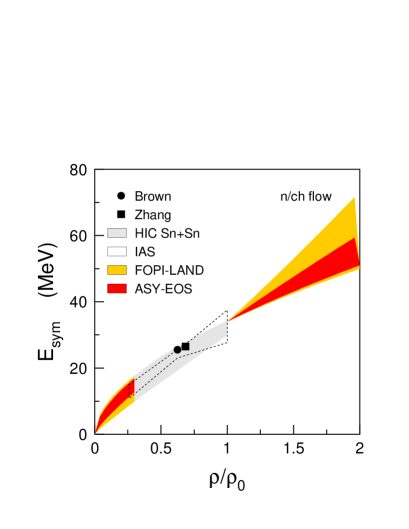
The obtained constraint for the density dependence of the symmetry energy is shown in Fig. 18 in comparison with the FOPI-LAND result of Ref. Rus11 as a function of the reduced density . The new result confirms the former and has a considerably smaller uncertainty. Judging from the purely statistical error of (Fig. 14), even smaller errors can be expected from future measurements.
For reference, the low-density behavior of the symmetry energy from Refs. tsang09 ; dani13 ; brown13 ; zhang13 as reported in Ref. horowitz13 is included in the figure. The present parametrization is found compatible also with these results from nuclear structure studies and from reactions at lower bombarding energy. The corresponding slope parameter describing the variation of the symmetry energy with density at saturation is MeV. Judging from the analysis work done with the FOPI-LAND data, one may expect that the analysis of the present data with the Tübingen QMD Coz11 ; Coz13 will lead to a similar or possibly slightly larger value for the parameter Rus14 ; wang14b ; Traut14 .
The sharp value MeV is a consequence of the chosen parametrization [Eq. (8)]. Using values lower than the default MeV, as occasionally done in other UrQMD studies wang14a ; wang2012 , is likely to lower the result for . Values of the symmetry energy at saturation in the interval between 30 MeV and 32 MeV seem to be favored by a majority of terrestrial experiments and astrophysical observations as shown in recent compilations lihan2013 ; lattimer14 . Motivated by these results, the present UrQMD analysis has, in addition, been performed with MeV, corresponding to MeV. The obtained power-law coefficient is lower by and the corresponding slope parameter MeV is lower by 9 MeV, changes that both remain within the error margins of these quantities. It is to be noted, however, that the precise results of Brown brown13 and Zhang and Chen zhang13 are no longer met with this alternative parametrization of the symmetry energy.
VI Density probed
Calculations predict that central densities of two to three times the saturation density may be reached in 197Au+197Au collisions at 400 to 1000 MeV/nucleon on time scales of fm/ li_npa02 . The resulting pressure produces a collective outward motion of the compressed material whose strength, differentiating between neutrons and protons, is influenced by the symmetry energy in asymmetric systems dani02 . It is to be expected, however, that the observed transverse momenta of emitted particles and their azimuthal variation apparent as elliptic flow carry information acquired during the full reaction history. The tests performed with the FOPI-LAND flow data and varying parameters for the potential part of the symmetry energy in the UrQMD had already indicated that densities above and below saturation contribute to the observed flow patterns Rus11 .
A force-weighted density has been defined by Le Fèvre et al. in their recent study of the equation of state of symmetric matter, based on FOPI elliptic-flow data and IQMD calculations lefevre15 . For 197Au+197Au collisions at 400 MeV/nucleon, its broad maximum extends over densities . Liu et al. report in their study of pion production in the same reaction that the relative sensitivity of the yield ratios to the symmetry energy is distributed over a density range of approximately with a maximum near liuyongwen15 . These more quantitative studies, with partly different methods, consistently support the assumption that suprasaturation densities up to nearly twice saturation are probed at this energy with collective flows and meson production, not exclusively but with major effects produced above saturation.
For the present purpose, a detailed analysis of the collision processes has been performed with the Tübingen version Coz13 of the QMD model (TüQMD). The sensitivity to the various density regimes probed in heavy-ion collisions was studied quantitatively by examining their impact on the variation of elliptical-flow-ratio observables with the two choices of a mildly stiff and a soft parametrization for the density-dependent asymmetric-matter equation of state (asy-EoS). To that end, the density-dependent quantity DEFR (difference of elliptic-flow ratio)
| (9) |
has been determined using the TüQMD transport model. Here labels a particle or a group of particle species and the asy-EoS stiffness resulting from the momentum-dependent one-body potential introduced by Das et al. Das:2002fr . The density-dependent elliptic-flow ratios (EFR) in this expression are calculated with a modified symmetry potential
| (12) |
with according to Eq. (9). The difference of the potentials is tested only at densities up to the particular , the argument of DEFR. This choice leads to DEFR and to the proper stiff-soft splitting for large values of the density . Values at intermediate densities are a measure of the impact on elliptic flow observables of regions of density lower than that chosen for the argument. The derivative of DEFR with respect to density provides thus the sensitivity density of the elliptic flow ratio observable under consideration as a function of the nuclear matter density.
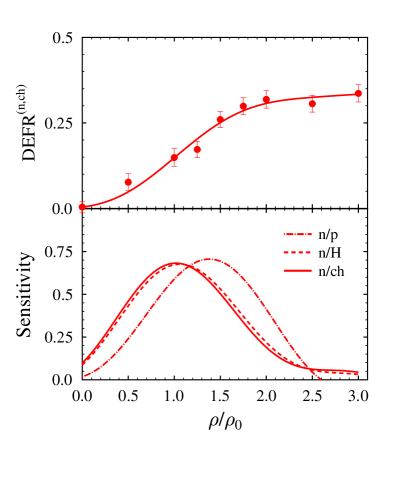
In the top panel of Fig. 19, the density dependence of DEFR(n,Y) for the choice =all charged particles (ch) is presented. It is seen that DEFR increases monotonically up to density values in the neighborhood of 2.5 , close to the maximum density probed by nucleons in heavy-ion collisions at 400 MeV/nucleon incident energy. The relative sensitivity of the elliptic flow ratio of neutrons over charged particles to the various density regions is presented in the bottom panel of Fig. 19, together with the same quantity for the neutron-over-proton and neutron-over-hydrogen flow ratios. It is readily observed that the maximum sensitivity of the neutron/proton EFR lies in the 1.4 to 1.5 region. It is lowered to 1.0 to 1.1 for the choices that involve light complex particles. The probed regions of nuclear density are thus considerably higher than the densities around or below 0.7 probed with nuclear structure observables brown13 ; zhang13 ; horowitz13 . Even lower densities in the vicinity of have very recently been reported as the region of sensitivity probed with the dipole polarizability of 208Pb zhang15 .
The moderately different density regions probed by EFR observables involving protons and, respectively, light complex particles are expected to lead to slightly different extracted values for the asy-EoS stiffness. Preliminary results, employing existing experimental FOPI-LAND data for and and the TüQMD transport model, suggest this to be the case Cozma:2015 . A slightly stiffer asy-EoS is favored by the latter observable, a difference that will be enhanced if one corrects for the fact that transport models coupled with phase-space coalescence algorithms tend to underpredict light cluster multiplicities by factors ranging up to 2-3. Deuterons and tritons are of particular interest here. This result suggests that, at higher densities, the asy-EoS density dependence is somewhat softer than at saturation. It may thus be feasible to extract constraints for the parameters of the higher-order terms of the Taylor expansion of the symmetry energy in density around the saturation point, in particular the curvature parameter . Information regarding the curvature is of high interest as, e.g., the inclusion of exchange terms in microscopic models cause a stiffening greco04 , while considering the momentum tails caused by short-range correlations may cause a softening caili16 of the predictions for the symmetry energy in the density regime near and above saturation.
It is, therefore, of extreme importance for future experiments to be able to extract a clean separate proton signal. Additionally, theoretical models that allow for an independent adjustment of the slope and curvature parameters of the symmetry energy term will be required to be able to push the extracted constraints for the asy-EoS density dependence into the 2 region.
VII Conclusion and outlook
From the measurement of the elliptic flows of neutrons and light charged particles in the reaction 197Au+197Au at 400 MeV/nucleon incident energy a new, more stringent constraint for the nuclear symmetry energy at suprasaturation density has been deduced. From the comparison of the elliptic flow ratio of neutrons over charged particles with UrQMD predictions, a value is obtained for the power-law coefficient of the potential part in the parametrization of the model. It confirms the moderately soft to linear density dependence of the symmetry energy deduced previously from the FOPI-LAND data. The densities probed were shown to reach beyond twice saturation.
The effects of deficiencies of the LAND timing electronics have been studied in detail and their effects assessed by systematically varying correction parameters over their intervals of uncertainty. An acceptance-integrated flow ratio for neutrons over charged particles has been generated by integrating over the time-of-flight spectra. It is largely insensitive to timing uncertainties but still subject to a systematic error caused by an instrumental smearing of detection thresholds. Their effect contributes to the total error of the acceptance-integrated result that includes a statistical error .
The slope parameter that corresponds to the obtained parametrization of the symmetry energy is MeV. As densities near and beyond saturation are efficiently probed with the present observable, one may convert this result into a symmetry pressure MeVfm-3 (with fm-3), equivalent to Pa. It represents the pressure in pure neutron matter at saturation because the pressure in symmetric matter vanishes at this density. The pressure in neutron-star matter with asymmetries less than unity should be lower. The estimate developed in Sec. 9.1 of Ref. lipr08 , based on equilibrium, yields a proton fraction of about 5% for MeV [cf. Eq. (8)] and saturation density. With the corresponding asymmetry 0.90, the pressure of the asymmetric baryonic matter is reduced to 3.1 MeVfm-3. Adding the contribution of the degenerate electrons yields a value of 3.4 MeVfm-3 for the pressure in neutron-star matter at saturation density. The same or very similar values are obtained with the expressions presented in Refs. lattimer01 ; lattimer14 . Compared to the results of Steiner et al. steiner13 , they are located within the upper half of the 95% confidence interval obtained by these authors from neutron-star observations.
While interpretations in this direction may still appear speculative at present and in need of further study, they reveal the potential of pressure measurements in nuclear reactions. As far as the modeling of nuclear reactions is concerned, it will be important to improve the description of the nuclear interaction in transport models junxu16 , reduce the parameter ranges also in the isoscalar sector, improve the algorithms used for clusterization, as well as go beyond the mean-field picture, including short-range correlations. The latter have recently been investigated in nuclei subedi08 ; hen14sc and their consequences for transport descriptions of intermediate-energy heavy-ion reactions are of high interest and need to be investigated hen15 . Moreover, it will be quite important to compare the experimental data with the predictions of several transport models, of both Boltzmann-Vlasov and molecular-dynamics type guoyongwang13 , to pursue the work towards a model-independent constraint of the high-density symmetry energy initiated in Ref. Coz13 .
The results of the present experiment, together with the theoretical study of the density probed, may also be seen as a strong encouragement for extending the measurement of neutron and charged particle flows to other reaction systems and energies. The presented calculations suggest that the curvature parameter can be addressed experimentally if higher precision and elemental and isotopic resolution for charged particles can be achieved. Future experiments will, therefore, benefit from the improved calorimetric capabilities of the NeuLAND detector presently constructed as part of the experimental setup NeuLAND and from the availability of radioactive ion beams for reaction studies at FAIR.
Acknowledgements.
The authors are indebted to the Accelerator Department and the Target Laboratory of the GSI Helmholtzzentrum for providing high-quality beams and targets. We are particularly grateful to the Laboratori Nazionali del Sud for making parts of the CHIMERA multidetector available for the experiment. We thank W. Reisdorf and the FOPI Collaboration for providing specifically selected data sets from their experiments and for continuing support of the project. The contributions of R. Bassini and C. Boiano during the preparatory phase are gratefully acknowledged. This work has been supported by the European Union under Contract No. FP7-25431 (Hadron-Physics2), by INFN (Istituto Nazionale di Fisica Nucleare) experiments EXOCHIM and NEWCHIM, by the National Natural Science Foundation of China under Grants No. 11375062, No. 11547312, and No. 11505057, by the Hungarian OTKA Foundation No. K106035, by the Polish Ministry of Science and Higher Education under Grant No. DPN/N108/GSI/2009, by the Foundation for Polish Science - MPD program, co-financed by the European Union within the European Regional Development Fund, by the Polish National Science Center (NCN), Contracts No. UMO-2013/10/M/ST2/00624 and No. UMO-2013/09/B/ST2/04064, by the Slovak Scientific Grant Agency under Contract 2/0121/14, by the UK Science and Technology Facilities Council (STFC) under Grants No. ST/G008833/1, No. ST/I003398/1, and No. STBA00019, by the U.S. Department of Energy under Grants No. DE-FG02-93ER40773 and No. DE-SC0004835, by the U.S. National Science Foundation Grant No. PHY-1102511, and by the Robert A. Welch Foundation through Grant No. A-1266.VIII Appendix: Correction of LAND timing
In the TACQUILA electronic board Koch05 , the time measurement of a recorded hit is performed by registering the time of the start signal (tac) inside a 25-ns clock-cycle window, the time of the common stop signal inside its 25-ns clock-cycle window (so-called ), and the number of cycles occurring between the start and stop cycles. The returned calibrated time information is then given by
| (13) |
The resolution of the timing system is of the order of 10 ps (rms) Koch05 .
Examples of the observed correlations between (in channels) and the so measured (in ns) for the two photomultipliers (PM’s) of a paddle of the first plane of LAND are shown in panels (a) and (b) of Fig. 20, respectively. Ideally, no correlation should be visible as the distribution of the stop signals inside the clock cycle window should be completely random. Unexpectedly, however, a strong correlation is observed; preferences exist, primarily, for high values at smaller times but also for low values at larger times. This behavior by itself implies an improper functioning of the TACQUILA board. It is evidence of incorrect determinations of , depending on where the signal appears within the clock cycle. In addition, it was found that the probability of wrong countings was rate dependent; it increased with increasing frequency of hits recorded in the LAND modules. This behavior, as discovered during the data taking was confirmed with bench tests performed after the experiment and ultimately corrected by replacing parts of the TACQUILA electronic readout system.
As a consequence, the region marked as A1 in Fig. 20 (a) must be considered as overpopulated because of a wrong counting of the number of clock cycles; the returned is likely to be one unit smaller than the true value, causing an offset of -25 ns of the calibrated time . With smaller probability, counting errors larger than one cycle were observed as well. It follows that any measured time in LAND is not necessarily but possibly wrong by ns or, with decreasing probability, even multiples of it.
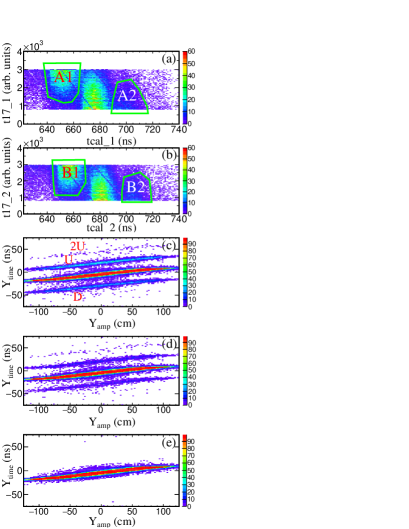
The described malfunctions clearly affect the measurements of the hit position along the vertically oriented paddles, derived from the difference, and of the arrival time at the paddle, derived from the sum of the two signals recorded for a hit. The two quantities are given by
| (14) |
| (15) |
where the indices 1 and 2 refer to the two PM’s of a given paddle; the signals and are, at this stage, not yet synchronized, i.e. not yet corrected for time offsets generated by, e.g., differences of the cable lengths of the two PMs. The position is, therefore, still given in units of nanoseconds and not necessarily centered with respect to the paddle length.
In the case of malfunctions, the time differences may be sufficiently large, so that the deduced hit position falls outside the physical length of the paddle. This can be easily corrected by adding or subtracting 25 ns to the time difference. It will move the hit to its correct position inside the paddle. To recover the correct arrival times is not equally feasible in this case. It would require the knowledge of whether the wrong position of is caused by erroneous +25 ns in one or -25 ns in the other of the two signals coming from a paddle. The two possibilities correspond to values that differ by 25 ns. Moreover, it is also possible that both time measurements are affected by the same ns time jump. In that case, the position is correct but the returned arrival time is erroneous by ns. Because the expected range of arrival times at LAND exceeds 25 ns, an easy and straightforward procedure for recovering the correct time information does not exist.
It has, nevertheless, been possible to develop a correction scheme for recovering the correct times with high probability and for determining the consequences of remaining uncertainties for the finally determined symmetry-term coefficient. This was achieved with the help of correction parameters whose effects can be assessed on a quantitative level. The scheme divides into two parts.
The first correction step starts from the observed correlation of the position measurement with the position obtained from the amplitudes of the normalized PM signals. The uncorrected correlation [Fig. 20(c)] shows clearly separated regions of unphysical positions , marked with U (up), D (down), and 2U (twice up), in addition to the strongest group of coinciding position measurements. The distribution of uncorrected positions for a typical module of the first plane of LAND is shown in the top panel of Fig. 21 and the corresponding distribution is shown in the bottom panel of the same figure (“no corr,” solid line in black). The two side groups with wrong positions are weak () compared to the main group but significant. The probability for double time jumps in the same direction is below 1% and essentially negligible. The 25-ns repetitions of structures in are clearly visible in Fig. 21 (bottom panel), in particular, the repeated appearance of narrow artificial peaks generated by the electronics. These structures were removed before other corrections were applied.
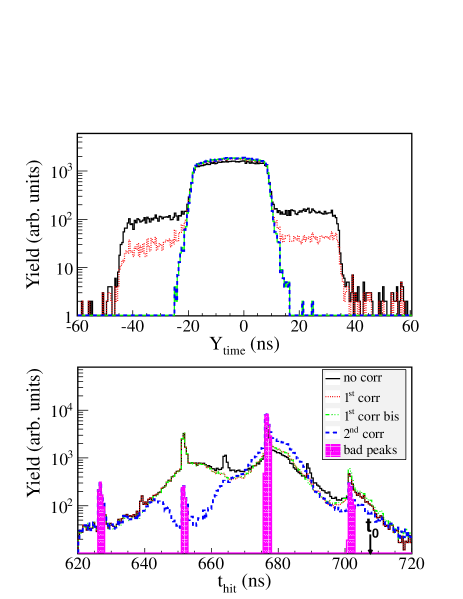
In the attempt to correct the wrong positions, the chosen scheme takes into account the value of relative to the returned time as shown in panels (a) and (b) of Fig. 20. In the example of a hit belonging to the region ’U’ in panel (c), may be located in what is defined as the “good” region, i.e., in the interval between 640 ns and 720 ns but outside the gates ’A1’ and ’A2’ in panel (a), and may be located in region ’B1’ of panel (b). In this case, it is obviously more probable that is incorrect, i.e., that the number of clock cycles is wrong by one unit, and 25 ns are thus added to its value. Instead, if is located in region ’A2’ and in the “good” region, i.e, outside the gates ’B1’ and ’B2’ in panel (b), 25 ns are subtracted from . Corresponding corrections are applied to hits belonging to regions marked as ’D’ and ’2U’ in Fig. 20(c), as well as to a region ’2D’ when it appeared in other cases. This part of the correction scheme is summarized in Table 3 and marked as step in the last column. Note that three possibilities exist for correcting the rare double jumps, depending on where the hits are found to be located. The superscripts “+” and “-” used in the table indicate regions analogous to the four regions ’A1’, ’A2’, ’B1’, and ’B2’ marked in panels (a) and (b) of Fig. 20 but located further out by another +25 ns or -25 ns from the central part of the spectrum.
| panel (c) | panel (a) | panel (b) | correction | ||
|---|---|---|---|---|---|
| U | A2 | -25 ns | |||
| U | B1 | +25 ns | |||
| D | A1 | +25 ns | |||
| D | B2 | -25 ns | |||
| 2U | A2 | B1 | -25 ns | +25 ns | |
| 2U | A2+ | -50 ns | |||
| 2U | B1- | +50 ns | |||
| 2D | A1 | B2 | +25 ns | -25 ns | |
| 2D | A1- | +50 ns | |||
| 2D | B2+ | -50 ns | |||
| good | A1 | B1 | +25 ns | +25 ns | |
| good | A2 | B2 | -25 ns | -25 ns |
Panel (d) of Fig. 20 shows the -vs- correlation after this first correction step. The corresponding and distributions are shown in Fig. 21 (in red). It is evident that not all the wrong positions have disappeared because some hits do not fulfill the assumptions made in devising the first step of the correction scheme (of the order of 2%, cf. Fig. 21, top panel). In that case, an additional correction called bis is applied. At this step, the location of the hit pattern in the -vs- maps [Figs. 20(a) and 20(b)] is ignored and the correct is recovered by either adding 25 ns to one or by subtracting 25 ns from the other of the two time signals and of that hit. The choice made between these two possibilities was based upon which of them had appeared with the higher probability when the correction step had been applied to the same paddle. Panel (e) of Fig. 20 shows the -vs- correlation after this correction: Now all the positions deduced from time signals are correct. They coincide with the positions deduced from the amplitudes and are within the physical length of the paddle (Fig. 21, top, in green, coinciding with blue).
At this stage, cases in which both time measurements are affected by the same time jump have not been touched. They remain correct regarding their positions but the problem of their erroneous arrival times is not solved yet. For that purpose, an additional correction step has been conceived. It is based on the assumption that the coincident location of the two signals of a hit in either regions ’A1’ and ’B1’ or in ’A2’ and ’B2’ of their respective -vs- maps is a strong indication of a simultaneous jump. The correction step consists of either adding or subtracting 25 ns to both values and of that hit, so that they fall into the central regions of their maps. It is marked as step in the last column of Table 3. It simply changes the arrival times by 25 ns but leaves the position and its correlation with unaffected. The so-obtained final distribution is shown in Fig. 21 (bottom panel, in blue).
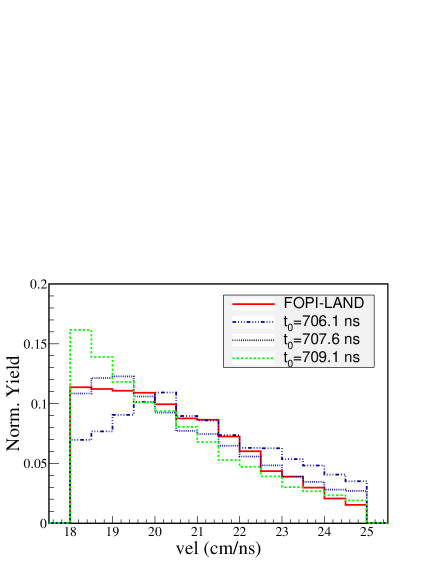
It is evident that the second correction step falsely modifies correctly measured cases of long or short times with time signals and accidentally falling into the marked regions. Its effect is particularly large in the interval 640 to 660 ns of the spectrum, where it causes a depression (Fig. 21, bottom panel). The geometric mean between the yields before and after this correction would approximately represent a smooth time spectrum that would seem more probable. This level can be reached if only about 80% of the hits near the center down to about 50% towards the edges of this region are actually moved in the second step, while the rest of the selected candidates are left at their original arrival times in the 640 ns-to-660 ns interval. However, as it is not known which of the hits should be moved and which should be left at their time positions, a correction of this kind is not properly feasible. It will smoothen the time spectrum but, because of the necessarily random selection, an inevitable mixing of hits between the affected time intervals will occur.
This situation was addressed by considering the fraction of randomly selected hits whose arrival times are actually modified in step 2 as an unknown correction parameter. The time spectrum in Fig. 21 (bottom panel) and the comparison of flow results as a function of this fraction with FOPI results (Fig. 12 in Sec. IV.1) suggest a value of at least 40%. Apart from that, it remains unknown and its significance for the differential flow ratios must be assessed. The result, a systematic variation of as a function of this fraction, is shown in Fig. 15 and discussed in Sec. V.1. For the acceptance-integrated analysis based on time-integrated data sets (Sec. V.2), the present corrections are of minor importance because very few hits are actually moved across the boundaries of the integration interval.
Owing to the logarithmic gain chosen for the new TACQUILA electronic board, the signals of low-energy rays fell below threshold with the effect that the calibration of the time spectra could not be based on a measured peak. The location of the zero-time-of-flight point was, therefore, determined from a comparison of velocity spectra, generated with various assumptions on , with the well-calibrated spectrum available from the FOPI-LAND experiment. The high-velocity part of the spectrum was found to exhibit the most distinctive variation as a function of the choice for (Fig. 22). The presence of artificial peaks at arrival times and 702 ns (Fig. 21, bottom panel) limited the useful range to velocities cm/ns or MeV for nucleons. The rapid variation of the velocity spectrum with the choice of permitted its determination with an uncertainty of the order of 1 ns (Fig. 22). Its location at ns is marked in the spectrum of arrival times . As the displayed times are measured with respect to a delayed common stop signal, finite time-of-flight values are to the left of . Photons would appear at ns, indicating that the yield at larger represents the level of background and of hits that are still misplaced. The interval cm/ns used for the comparison corresponds to ns, a region only mildly affected by corrections. The same is true for the main group of recorded hits with arrival times between and 685 ns, corresponding to flight times between 23 and 39 ns and to kinetic energies of 100 to 400 MeV for nucleons (note that artificial peaks are removed).
The correction effects are stronger for arrival times between and 663 ns, expected for nucleons with approximately 30 to 70 MeV kinetic energy. The time spectrum in that region is strongly modified by the second correction step moving particles from this region into the main group centered at ns (Fig. 21, bottom panel). The threshold energy of 60 MeV for protons to pass through the veto wall and to be detected in a LAND module is located within the affected region ( ns). The same is true for the thresholds of deuterons and tritons, located at smaller energy per nucleon and correspondingly longer times of flight.
To be independent of the applied corrections, the acceptance-integrated result was obtained by integrating the time spectra up to ns, i.e., beyond the critical regions. The maximum time of flight of 67.5 ns defines a threshold of 30 MeV for neutrons. It is lower than the physical thresholds for charged particles, a condition that was equally applied in the UrQMD simulations. Only double time jumps and background events, apart from the neutrons below threshold, can contribute to the low-intensity region at ns. Possible systematic effects related to these effects were investigated by varying the integration limit between ns, i.e., flight times between 60 and 90 ns, and by correspondingly adjusting the neutron-energy threshold in the calculations. The resulting variation of is small as shown in Fig. 17.
It is once more noted here that the timing corrections are applied to all particles independently of whether they are charged or neutral. This has obviously reduced their influence on the flow ratios that are used as the principal observables, in agreement with the results of the tests performed.
References
- (1) Bao-An Li, Zhongzhou Ren, C. M. Ko, and S. J. Yennello, Phys. Rev. Lett. 76, 4492 (1996).
- (2) Bao-An Li, Phys. Rev. Lett. 88, 192701 (2002).
- (3) V. Greco, V. Baran, M. Colonna, M. Di Toro, T. Gaitanos, and H. H. Wolter, Phys. Lett. B 562, 215 (2003).
- (4) Gao-Chan Yong, Bao-An Li, and Lie-Wen Chen, Phys. Rev. C 74, 064617 (2006).
- (5) P. Russotto et al., Phys. Lett. B 697, 471 (2011).
- (6) M. D. Cozma, Phys. Lett. B 700, 139 (2011).
- (7) Y. Leifels et al., Phys. Rev. Lett. 71, 963 (1993).
- (8) D. Lambrecht et al., Z. Phys. A 350, 115 (1994).
- (9) Qingfeng Li, Zhuxia Li, S. Soff, R. K. Gupta, M. Bleicher, and H. Stöcker, J. Phys. G 31, 1359 (2005).
- (10) Q. Li, Z. Li, S. Soff, M. Bleicher, and H. Stöcker, J. Phys. G 32, 151 (2006).
- (11) Q. Li, Z. Li, S. Soff, M. Bleicher, H. Stöcker, J. Phys. G 32, 407 (2006).
- (12) D. T. Khoa, N. Ohtsuka, M. A. Matin, A. Faessler, S. W. Huang, E. Lehmann, and R. K. Puri, Nucl. Phys. A 548, 102 (1992).
- (13) V. S. Uma Maheswari, C. Fuchs, A. Faessler, L. Sehn, D. S. Kosov, and Z. Wang, Nucl. Phys. A 628, 669 (1998).
- (14) M. D. Cozma, Y. Leifels, W. Trautmann, Q. Li, and P. Russotto, Phys. Rev. C 88, 044912 (2013).
- (15) P. Russotto, M. D. Cozma, A. Le Fèvre, Y. Leifels, R. Lemmon, Q. Li, J. Łukasik, and W. Trautmann, Eur. Phys. Jour. A 50:38 (2014).
- (16) C. B. Das, S. D. Gupta, C. Gale and B.-A. Li, Phys. Rev. C 67, 034611 (2003).
- (17) Th. Blaich et al., Nucl. Instr. and Meth. A 314, 136 (1992).
- (18) A. Pagano et al., Nucl. Phys. A 734, 504 (2004).
- (19) E. De Filippo and A. Pagano, Eur. Phys. Jour. A 50:32 (2014).
- (20) A. Schüttauf et al., Nucl. Phys. A 607, 457 (1996).
- (21) D. G. Sarantites et al., Nucl. Instr. and Meth. A 381, 418 (1996).
- (22) J. Łukasik et al., Nucl. Instr. and Meth. A 709, 120 (2013).
- (23) W. Reisdorf et al., Nucl. Phys. A 876, 1 (2012).
- (24) A. Le Fèvre, Y. Leifels, W. Reisdorf, J. Aichelin, and Ch. Hartnack, Nucl. Phys. A 945, 112 (2016).
- (25) P. Danielewicz, R. Lacey, and W. G. Lynch, Science 298, 1592 (2002).
- (26) W. Reisdorf et al., Nucl. Phys. A 781, 459 (2007).
- (27) Jun Hong and P. Danielewicz, Phys. Rev. C 90, 024605 (2014).
- (28) T. Song and C. M. Ko, Phys. Rev. C 91, 014901 (2015).
- (29) Gao-Chan Yong, Phys. Rev. C 93, 044610 (2016).
- (30) Bao-An Li, Phys. Rev. C 92, 034603 (2015).
- (31) Wen-Mei Guo, Gao-Chan Yong, and Wei Zuo, Phys. Rev. C 92, 054619 (2015).
- (32) M. D. Cozma, Phys. Lett. B 753, 166 (2016).
- (33) Zhigang Xiao, Bao-An Li, Lie-Wen Chen, Gao-Chan Yong, and Ming Zhang, Phys. Rev. Lett. 102, 062502 (2009).
- (34) Zhao-Qing Feng and Gen-Ming Jin, Phys. Lett. B 683, 140 (2010).
- (35) W.-J. Xie, J. Su, L. Zhu, and F.-S. Zhang, Phys. Lett. B 718, 1510 (2013).
- (36) V. Baran, M. Colonna, V. Greco, M. Di Toro, Phys. Rep. 410, 335 (2005).
- (37) J.M. Lattimer and M. Prakash, Phys. Rep. 442, 109 (2007).
- (38) Bao-An Li, Lie-Wen Chen, Che Ming Ko, Phys. Rep. 464, 113 (2008).
- (39) M. Di Toro, V. Baran, M. Colonna, V. Greco, J. Phys. G 37, 083101 (2010).
- (40) S. Gandolfi, A. Gezerlis, J. Carlson, Annu. Rev. Nucl. Part. Sci. 65, 303 (2015).
- (41) W. Trautmann and H.H. Wolter, Int. J. Mod. Phys. E 21, 1230003 (2012).
- (42) Topical Issue on Nuclear Symmetry Energy, Eur. Phys. Jour. A 50, number 2 (2014).
- (43) K. Koch et al., IEEE Trans. Nucl. Sci. 52, 745 (2005).
- (44) G. Pasquali et al., Nucl. Instr. and Meth. A 301, 101 (1991).
- (45) L. Acosta et al., IEEE Trans. on Nucl. Sci 60, 284 (2013).
- (46) R. Ogul et al., Phys. Rev. C 83, 024608 (2011).
- (47) http://fairroot.gsi.de/.
- (48) W. Reisdorf, priv. comm. (2013).
- (49) W. Trautmann et al., Phys. Rev. C 76, 064606 (2007).
- (50) J. Hubele, et al., Z. Phys. A 340, 263 (1991).
- (51) P. Danielewicz and G. Odyniec, Phys. Lett. B 157, 146 (1985).
- (52) A. Andronic, J. Łukasik, W. Reisdorf, and W. Trautmann, Eur. Phys. J. A 30, 31 (2006).
- (53) J.-Y. Ollitrault, preprint nucl-ex/9711003 (1997).
- (54) J.-Y. Ollitrault, Nucl. Phys. A 638, 195c (1998).
- (55) S. Kupny, J. Brzychczyk, J. Łukasik, P. Pawłowski et al., in Proceedings of IWM-EC 2014, International Workshop on Multi facets of EoS and Clustering, Catania, Italy, 2014, edited by B. Borderie, R. Bougault, A. Pagano, S. Pirrone, and G. Politi, EPJ Web of Conferences 88, 01010 (2015).
- (56) Y. Wang, C. Guo, Q. Li, H. Zhang, Z. Li, and W. Trautmann, Phys. Rev. C 89, 034606 (2014).
- (57) Y. Wang, C. Guo, Q. Li, H. Zhang, Y. Leifels, and W. Trautmann, Phys. Rev. C 89, 044603 (2014).
- (58) S. A. Bass et al., Progr. Part. Nucl. Phys. 41, 255 (1998).
- (59) Q. Li and M. Bleicher, J. Phys. G 36, 015111 (2009).
- (60) Qingfeng Li, C. Shen, C. Guo, Y. Wang, Z. Li, J. Łukasik, W. Trautmann, Phys. Rev. C 83, 044617 (2011).
- (61) Qingfeng Li, Caiwan Shen, and M. Di Toro, Mod. Phys. Lett. A 25, 669 (2010).
- (62) Bao-An Li, C. B. Das, S. Das Gupta, and C. Gale, Phys. Rev. C 69, 011603(R) (2004).
- (63) V. Giordano, M. Colonna, M. Di Toro, V. Greco, and J. Rizzo, Phys. Rev. C 81, 044611 (2010).
- (64) Zhao-Qing Feng, Nucl. Phys. A 878, 3 (2012).
- (65) Lei Zhang, Yuan Gao, Yun Du, Guang-Hua Zuo, and Gao-Chan Yong, Eur. Phys. J. A 48: 30 (2012).
- (66) Wen-Jie Xie, Zhao-Qing Feng, Jun Su, and Feng-Shou Zhang, Phys. Rev. C 91, 054609 (2015).
- (67) R. Subedi et al., Science 320, 1476 (2008).
- (68) O. Hen et al., Science 346, 614 (2014).
- (69) A. Carbone, A. Polls, and A. Rios, Europhysics Letters 97, 22001 (2012).
- (70) A. Rios, A. Polls, and W. H. Dickhoff, Phys. Rev. C 89, 044303 (2014).
- (71) Bao-An Li, Wen-Jun Guo, Zhaozhong Shi, Phys. Rev. C 91, 044601 (2015).
- (72) Or Hen, Bao-An Li, Wen-Jun Guo, L. B. Weinstein, and Eli Piasetzki, Phys. Rev. C 91, 025803 (2015).
- (73) Bao-Jun Cai and Bao-An Li, Phys. Rev. C 93, 014619 (2016).
- (74) Jun Xu et al., Phys. Rev. C 93, 044609 (2016).
- (75) B. D. Anderson, L. A. C. Garcia, D. J. Millener, D. M. Manley, A. R. Baldwin, A. Fazely, R. Madey, N. Tamimi, J. W. Watson, and C. C. Foster, Phys. Rev. C 54, 237 (1996).
- (76) I. Tanihata et al., preprint arXiv:1512.00590 [nucl-ex] (2015).
- (77) P. Russotto et al., in Proceedings of IWM-EC 2014, International Workshop on Multi facets of EoS and Clustering, Catania, Italy, 2014, edited by B. Borderie, R. Bougault, A. Pagano, S. Pirrone, and G. Politi, EPJ Web of Conferences 88, 00022 (2015).
- (78) M. B. Tsang, Y. Zhang, P. Danielewicz, M. Famiano, Z. Li, W. G. Lynch, and A. W. Steiner, Phys. Rev. Lett. 102, 122701 (2009).
- (79) P. Danielewicz and J. Lee, Nucl. Phys. A 922, 1 (2014).
- (80) B. A. Brown, Phys. Rev. Lett. 111, 232502 (2013).
- (81) Z. Zhang and L. W. Chen, Phys. Lett. B 726, 234 (2013).
- (82) C. J. Horowitz, E. F. Brown, Y. Kim, W. G. Lynch, R. Michaels, A. Ono, J. Piekarewicz, M. B. Tsang, and H. H. Wolter, J. Phys. G 41, 093001 (2014).
- (83) W. Trautmann, PoS Bormio2014, 036 (2014).
- (84) Y. Wang, C. Guo, Q. Li, H. Zhang, Sci. China Phys. Mech. Astron. 55, 2407 (2012).
- (85) Bao-An Li and Xiao Han, Phys. Lett. B 727, 276 (2013).
- (86) J. M. Lattimer and A. W. Steiner, Eur. Phys. J. A 50: 40 (2014).
- (87) Bao-An Li, Nucl. Phys. A 708 (2002) 365.
- (88) He-lei Liu, Gao-Chan Yong, and De-Hua Wen, Phys. Rev. C 91, 044609 (2015).
- (89) Zhen Zhang and Lie-Wen Chen, Phys. Rev. C 92, 031301(R) (2015).
- (90) M. D. Cozma, preliminary results and private communication (2015).
- (91) V. Greco, M. Colonna, M. Di Toro, G. Fabbri, and F. Matera, Phys. Rev. C 64, 045203 (2004).
- (92) J. M. Lattimer and M. Prakash, Astrophys. J. 550, 426 (2001).
- (93) A. W. Steiner, J. M. Lattimer, and E. F. Brown, Astrophys. J. Lett. 765, 5 (2013).
- (94) Wen-Mei Guo, Gao-Chan Yong, Yongjia Wang, Qingfeng Li, Hongfei Zhang, and Wei Zuo, Phys. Lett. B 738, 397 (2014).
- (95) https://www.gsi.de/r3b.