Cultural Evolution as a Non-Stationary Stochastic Process
Abstract
We present an individual based model of cultural evolution, where interacting agents are coded by binary strings standing for strategies for action, blueprints for products or attitudes and beliefs. The model is patterned on an established model of biological evolution, the Tangled Nature Model (TNM), where a ‘tangle’ of interactions between agents determines their reproductive success. In addition, our agents also have the ability to copy part of each other’s strategy, a feature inspired by the Axelrod model of cultural diversity. Unlike the latter, but similarly to the TNM, the model dynamics goes through a series of metastable stages of increasing length, each characterized by mutually enforcing cultural patterns. These patterns are abruptly replaced by other patterns characteristic of the next metastable period. We analyze the time dependence of the population and diversity in the system, show how different cultures are formed and merge, and how their survival probability lacks, in the model, a finite average life-time. Finally, we use historical data on the number of car manufacturers after the introduction of the automobile to the market, to argue that our model can qualitatively reproduce the flurry of cultural activity which follows a disruptive innovation.
I Introduction
Computer models of biological Drossel01 and social Castellano09 evolution often involve networks of interacting agents with a stochastic dynamics able to reach a stationary or steady state, which can then be given a biological or cultural iterpretation Rikvold03 ; Axelrod97 . The Axelrod model Axelrod97 is a case in point, where agents placed on a grid exchange traits with their neighbors with a probability proportional to the number of traits already shared. Making use of two social mechanisms: social influence - the tendency of interacting individuals to become more similar, and homophily - the tendency for individuals to associate with similar others, this model quickly reaches an equilibrium state, where interacting agents within spatially localized areas have identical traits, possibly differing from those in neighboring areas. This outcome, which is interpreted in terms of cultural diversity, strongly differs from the punctuated equilibrium dynamics of biological macro-evolution Gould93 ; Gould02 , where equilibrium is never reached, but is replaced by a series of increasingly long-lived metastable states. Similarly, human history is subdivided into successive metastable periods, each identified by the technologies mastered in the period, from the use of fire, through stone and metal tools, and up to our current modern technologies. Cultural and biological evolution are to some degree intertwined processes, since the abilities to communicate, use tools and form societal structures Diamond92 , all aspects of human culture, have co-determined the course of early human evolution Leland00 . It seems therefore justified to adapt biologically motivated computer models to study cultural evolution on the computer.
The Tangled Nature Model Christensen02 ; Hall02 ; Anderson04 ; Lawson06 (TNM) of biological evolution features a sequence of Quasi Evolutionary Stable States (QESS) of increasing duration, during which aggregated quantities only vary around fixed average values. The transitions between consecutive QESS are rapid and turbulent events, called quakes, which entail considerable rearrangements of the network structure Becker14 . The model presently introduced modifies the TNM by adding one feature inspired by the Axelrod model. Even though the changes introduced hardly affect the basic dynamical mechanisms of the TNM, we nevertheless for brevity refer to the resulting TNM version as the Tangled Axelrod Model, or TAM.
Postponing technical details to the next section, the properties of the TNM’s and TAM’s are first summarised below: The interacting agents of the TNM are represented by binary strings which can be interpreted in biological terms as genomes. We note that the TNM does not discriminate between genotype and phenotype and that the genome can also be interpreted as the carrier of cultural features, i.e. blueprints or strategies for action. The latter interpretation is the one carried over to the TAM, even though we keep the word ‘genome’ to refer to the string bits characterising TAM agents.
TNM agents reproduce asexually and in error prone fashion at a rate which depends on the ‘tangle’ of interactions connecting them to each other, with positive, or mutualistic, interactions leading to a higher reproduction rate. Since extant agents draw resources from a shared and finite pool, they all have an indirect, global and negative effect on each other’s reproductive success. Importantly, interactions between two TNM individuals are fully determined by a random but fixed function of their genomes. A TNM agent can thus be labeled in two different but equivalent ways, either using the genome itself or using the set of all interactions that the genome generates together with other genomes. In the following, agents connected by non-zero interactions will be called acquaintances. Agent removals happen at a constant rate and independently of interactions.
Each TAM agent’s genome has two parts of equal size. The first part, called interaction genome determines the interactions, just like in the TNM. The second part, called cultural genome or strategy is available for other agents to copy in full or in part. Sets of agents with the same interaction genomes constitute a family, and sets of agents with the same strategies constitute a culture.
in the TAM, subsets of randomly grouped agents, termed neighbors, are able to copy parts of each other’s strategy. When, say, agent ‘a’, copies part of the strategy of a neighbor ‘b’, a new agent, ‘c’ is produced. The latter inherits the family and the neighbors of ‘a’, and a mix of ‘a’s and ‘b’s strategies. Unlike the Axelrod model, there is no spatial grid in the TAM and neighbors have no spatial relation to one another. Our way of distributing the interactions makes sense with internet and mass media connecting people worldwide. In the Axelrod model, the probability of one agent inducing a change in the traits of another is proportional to the pre-existing overlap of traits between the two. In our model, overlap is not available information for agents decisions, and strategies are copied with a probability given by their relative frequency in the population, i.e. popular strategies are more likely to be copied.
Following the nomenclature developed in Ref. Becker14 , to which we refer for an in-depth discussion of TNM dynamics, extant species in the TNM are divided into a core and a cloud. Core species have, by definition, a population exceeding of the most populous species. As it turns out, they have mutualistic interactions with one another and together constitute the metastable core characterizing each QESS in a TNM trajectory. Cloud species are sparsely and intermittently populated, mainly by an influx of mutants from the core. The interactions between cloud species are distributed in the same way as the interactions between unsorted species. Core and cloud tougher make up an ecosystem. The core and cloud definitions are here extended to TAM families and cultures. ‘Culture’ can of course have different interpretations, e.g. production technologies, languages or even fashion. Only core families are those sufficiently populous and stable to deserve the name of cultures, but the term is used for simplicity for all families, even though the ‘cultures’ cloud families can carry are only tantamount to random noise.
The generic properties of the TAM are as follows: Starting out from a single family with a single culture, core species with different cultures soon appear, their number growing slowly as a function of time. An established culture can either disappear abruptly in a quake together with all its proponents or more slowly as more popular strategies get copied and eventually take over. The probability that a culture extant at time remains so at time depends on both and , and decays with in a power-law like fashion. Cultures in the TAM lack a finite average life-time, which translates into an expected large variation of the duration of actual cultures. The statistical properties of the model follow from a minimum of assumptions. In particular, our agents’ decisions are stochastic rather then rational and are based on a knowledge of the situation which is limited in both time and space. Due to these minimalistic assumptions, we suggest that the TAM might serve as a generic null model of cultural evolution.
Summary of nomenclature
This section is a short summary of the nomenclature used in this work, highlighting differences and similarities between the TNM and the TAM. It makes reference to details explained in the next Section.
- Genome
-
In the TNM the genome is a string of bits with an obvious biological interpretation. In the TAM the same word is used for historical reasons to describe a string of bits. The first bits constitute the interaction genome and determine all the interactions with other agents. The last bits can be copied by other agents, are understood as a blueprint for action and are called strategy. There is no biological interpretation.
- Strategy
-
In the TAM context, denotes the part of the genome that other agents can copy see above.
- Interactions
-
Interactions determine the reproductive success of both TNM and TAM agents. In the TNM, interactions between individuals are uniquely determined by their genomes. In the TAM they are determined in a similar fashion by the interaction part of the genome.
- Mutations
-
In the TNM mutation can hit anywhere in the genome. In the TAM they only affect the strategy part of the genome. The interaction part is affected indirectly, as described in the next section.
- Species
-
Set of TNM individuals with the same genome.
- Family
-
Group of TAM individuals each endowed with the same set of interactions. Not used in a TNM context, where the term corresponds to a species.
- Culture
-
Group of TAM individuals each endowed with the same strategy. Not used in a TNM context.]
- Core species
-
TNM species with at least 5% of the most populous species.
- Core culture/family
-
TAM culture/family with at least 5% of the most populous culture/family.
- Trait
-
The part of the genome/strategy of a TAM individual which can be copied in a single copying attempt. Not used for TNM.
- Neighbor
-
Each TAM agent can exchange traits with its neighbors.
- Acquaintance
-
Both TNM and TAM agents have non-zero interactions with their acquaintances.
II TAM implementation
Our model’s elementary dynamical variables are two binary strings of length , which together characterise an individual. The first string, the interaction genome is a point of the dimensional hypercube, which is populated by a family of individuals with the same interaction genome. A similar grouping can be done using the bit string, called strategy. A strategy is a point in a distinct dimensional hypercube, populated by individuals sharing the same culture. Simulation time is given in generations, each comprising the number of updates needed to remove the extant population. Initially, the population is and a generation comprises updates. Later, the generation length is computed similarly, but using the population present at the end of the preceding generation. Unlike the TNM, and due to the copying and mutation mechanism introduced, the interaction genome does not uniquely identify individuals. A second bit string, the strategy is attached to each individual and is subject to copying and mutation.
Neglect first the effect of copying and consider two agents, and , still having the interaction genome and strategy they inherited from their parent, possibly modified by point mutations. To generate the interaction between the two, three fixed arrays of length , , and are utilized. The first contains ones with probability and zeros otherwise, and the other two contain random numbers drawn from a Gaussian distribution with zero mean and unit variance. The interaction genomes of and are first XOR’red to produce a new binary string . Now reading binary strings as integer labels when needed, the coupling is zero if and only if . Otherwise, , where is a constant. Agents can copy parts of each other’s strategy if they are neighbours. Our agents and are neighbours if and only if , where the string is obtained as just described, and where is an array containing ones with probability and zeros otherwise.
Reproduction probabilities in the TAM are calculated as in the TNM: Let denote the ecosystem, denote the population size of species , and be the total population size. An individual of type is chosen as candidate for reproduction with probability , and successfully reproduces with probability , where
| (1) |
and where
| (2) |
is a density weighted coupling. In Eq. (1), is a positive constant which limits the size of the ecosystem. At each successful reproduction step, a point mutation in the strategy of the offspring occurs with probability of mutation per bit by . Parent and offspring strategies then differ by bits with probability Bin, the binomial distribution. Natural death occurs with probability . A copying move is performed with probability , and an individual of type is chosen to do the copying with probability . A second individual is then picked from a list of its neighbors with uniform probability. Strategies are partitioned in segments of equal length, called traits. Agent copies randomly chosen traits from with probability Bin, where
| (3) |
and where is the number of individuals sharing the same culture as agent , independently of these agents interaction genomes. The outcome of the process is a new agent with the same interaction genome, acquaintances and neighbors as parent , the parent doing the copying. Agents with a copied strategy and their progeny maintain the interactions and neighbors of their original parent until a strategy mutation occurs. Then, the interaction genome is set equal to the newly mutated strategy and new interactions are generated according to the prescription described above.
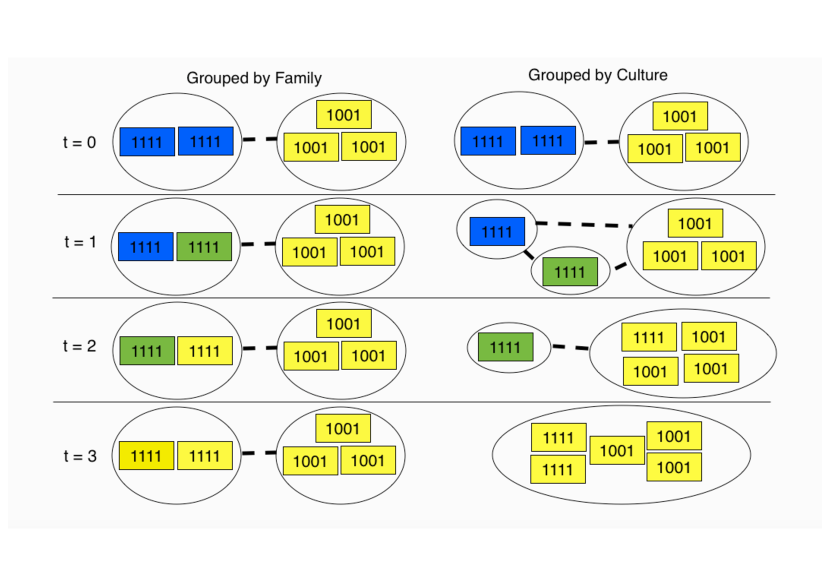
The TAM copying mechanism is illustrated in Fig. 1. In the figure, the interaction genome of individuals is a four bit string. Their likewise four bit strategy is omitted and replaced by a color code for visual clarity. The dashed lines represent neighbour relations and individuals are grouped either by family or by culture. At time , a blue individual copies part of the strategy of a yellow individual, resulting in a green individual with the same interaction code, , as its copying parent. At time the green individual copies the yellow strategy, resulting in a new yellow individual, with interaction string . At time the green culture has disappeared completely, leaving the yellow culture behind. Note that the individuals of this culture have different interaction genomes and hence different interactions.
The TAM mutation mechanism indirectly generating all new interaction patterns only affect s individuals with a copied strategy and leads to an exploration of configuration space which is faster than is the case in the TNM model. As a consequence, when the systems become more often unstable and a number of simulations ending in extinctions is significantly higher than in the TNM case. If the (still rare) cases where the system is heading to extinction, the last individual is not killed but replaced by of its clones. This is similar to the usual starting conditions, except that the individuals are not placed on a random point in cultural space, but keep the position already attained.
To summarize, unless otherwise stated, the following parameters were used in the simulations:
-
•
initial population contains identical agents.
-
•
environmental harshness .
-
•
interaction coupling strength .
-
•
strategy and interaction genome have each length .
-
•
each trait has length one and the two possible states .
-
•
probability of being connected as acquaintances: .
-
•
probability as being connected as neighbours: .
-
•
probability of death: .
-
•
probability of strategy mutation : .
-
•
probability of trait copy attempt from a neighbor: .
III Results
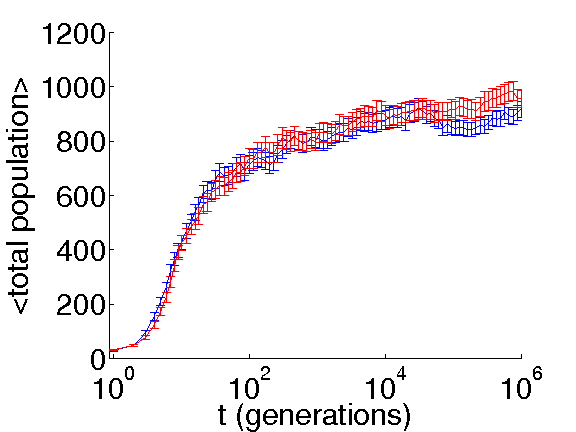
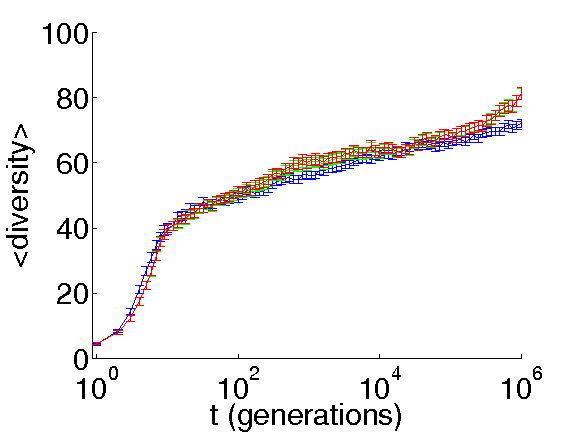
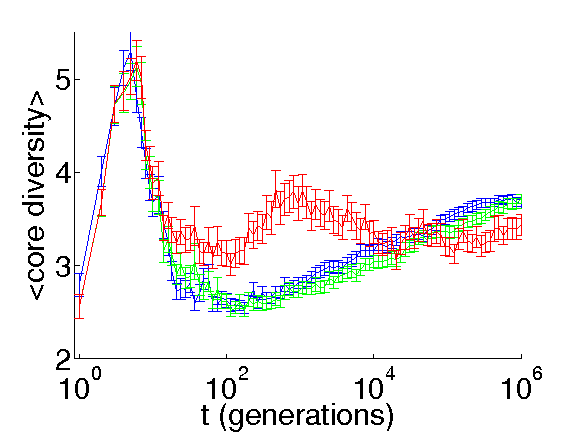
Each panel of figure 2 displays, with one- error bars, three different time series, each the outcome of averaging 200 independent trajectories. The nearly undistinguishable blue and green data pertain to TNM and TAM families, while the red data pertain to TAM cultures. The total population, which does not depend on the way in which individuals are grouped, is plotted vs. time in the uppermost left panel. We see a small difference between the TNM (blue) and TAM (red) data, both growing logarithmically in time after a short initial transient. A similar behavior is observed for the diversity, which is plotted in the uppermost right panel. The diversity of e.g. families is the number of different families extant at a certain time. The lower left panel shows the family and cultural diversity of the core vs. time. After an initial transient, family diversity increases logarithmically in both the TNM and the TAM. As cultures merge, several core families end up sharing the same culture, and cultural diversity becomes lower than family diversity. Both quantities appear then to keep growing in a logarithmic fashion.
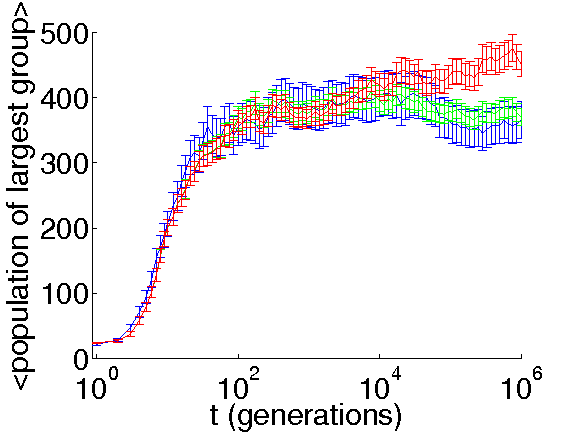
Figure 3 shows the time dependence of two core populations during a QESS. When agents are grouped by their interactions, i.e. in families, two families are present whose size exhibits a restricted variation around a fixed average. When the same individuals are grouped according to their strategies, several cultures are seen to appear, disappear and finally merge. The final merge is possible in this case, because the core populations are both each other’s acquaintances and neighbors, i.e. they have non-zero interactions and are able to copy each other’s strategies.
To go beyond a macroscopic description based on population and diversity and describe e.g. cultural similarities, visualization is called for. Using a decimal representation of TNM or TAM binary strings is not an option, because strings differing by a single bit can have either very different or almost identical decimal representations, depending on whether the bit in question is the most or least significant one. To obtain a more faithful 3D representation of our data, we use Principal Component Analysis (PCA) Jolliffe05 , a standard technique for data dimension reduction which reasonably maintains distance relationships. We start by replacing all zeros in our strings by negative ones, whereby each culture (or family) appears as a point in a twenty dimensional zero centered hypercube, which is naturally embedded in a Euclidean space. The twenty dimensional cloud of points representing an ecosystem is then projected into a 3D cloud, eventually producing Fig. 4, which illustrates the cultural exchanges occurring during a QESS between the two extant families depicted in Fig. 3.
For convenience and for completeness the steps taken are summarized below: We first form a rectangular matrix , whose columns are vectors of length , each consisting of a series of and each representing a culture. The six most populous core cultures are selected as columns of . The square symmetric matrix has real eigenvalues and orthogonal eigenvectors, the latter forming a new basis for culture space. We confine ourselves to the 3D subspace spanned by the eigenvectors corresponding to the three largest eigenvalues of , and project all our data onto these eigenvectors. This gives the 3D representation with the largest possible data variation. To follow cultural development in time, the eigenvectors calculated at the ‘initial’ time generations are used throughout the analysis. A culture’s 3D position is the center of a circle whose area is proportional to the corresponding population. The color of the circle encodes the family involved.
Initially, there are two main cultures (the two big circles) flanked by four less populous cultures (the smaller circles). As time goes, smaller cultures are gradually absorbed by the two larger ones. Even these two eventually merge, forming a hybrid culture differing from both its predecessors (the two concentric circles).
We now explore how long time core families survive in the TAM model and compare to the behavior of TNM species and TAM cultures. In both models, core families and species only disappear through quakes, while cultures may also disappear more gradually through the TAM copying mechanism. We might hence expect cultures to disappear at a faster rate. This only seems to hold at relatively early stages of the evolution process. Old and well entrenched cultures mainly disappear together with all their bearers during quakes and do so at approximately the same rate as families. To calculate the survival probability of cohorts of TAM families and cultures and of TNM species, all extant core families (cultures or species) are counted at times and . The fraction of the cohorts thus obtained which still are part of the core at time is then logged for independent trajectories. The survival probability is finally estimated by averaging the fraction remaining over all trajectories.
In the left panel of Fig. 6, the survival probabilities for TAM cultures (red) and families (green) are plotted on log-log scales together with those of TNM species (blue). As mentioned, at early times, cultures decay faster than both families and species. This means that, after a while, several families share the same culture, lading to fewer starting point for mutations. This stunts the exploration of configuration space and makes the core highly stable. At these later times all curves approximately decay at the same rate.
A sufficiently large core family or species disappears, usually together with the rest of the core, when a quake hits, while small core species might drift away from the core due to a decrease in their population. Neglecting the last possibility, the probability of family (or species) survival from to is the same as the probability that no quake hits in that time interval. Since quakes are approximately log-Poisson distributed Sibani03 we expect
| (4) |
for some exponent . The same reasoning applies to TNM species. In the right panel on Fig. 6, all three survival probabilities are on log-log scales plotted vs. . The TNM species survival data (blue curves) fall in two groups, with the two data sets collected at late times and the two collected at early times nearly overlapping. The same applies to the TAM family survival probabilities (green). The TAM culture survival probabilities only overlap at late times, in agreement with our previous remarks.
Clearly, scaling holds approximatively for the data collected at late times, i.e. for sufficiently large . The exponent for the power-law decay of the survival probability in that region is estimated as . Hence the probability density function for a family, species or culture lifetime
| (5) |
Even though the value of is uncertain, a finite average life-time for families, species or cultures would require , which can safely be excluded.
The lack of a finite average life time implies that empirically collected life-times would have a large scatter.
In the early stages of a QESS establishment, i.e. soon after a quake, the TAM always produces a flurry of short lived cultures, which eventually disappear. Intuitively, a similar situation could be expected in human cultural setting, soon after a new disruptive technology enters the scene. Recent examples could be the introduction of personal computers and, later, of cell phones.
The example we will discuss is older, and concerns the number of firms in the automobile manufacturing industry from 1886 to 1981, i.e. in a period starting soon after the automobile was introduced to the market. We consider ‘ways to build automobiles’ to be attributes of car companies which are somewhat similar to TAM cultures. The parallel is admittedly incomplete, since i) car companies are all different, and the equivalent of a population sharing a culture is unclear, and ii) the interactions of car companies with each other, with their suppliers and with their customers is not given. Our—thus merely qualitative—comparison utilizes data stemming from Ref. Hannan95 , where firms were counted that declared intentions to manufacture automobiles for the market. The birth and death of a firm are the dates when production commences, respectively ends. The left panel of Fig. 6 shows the number of car manufacturers in Germany and France vs. time, while the right panel shows the number of different cultures in a single trajectory of the TAM right after a quake. After an initial slow start, the number of automobile manufacturers rapidly increases to a plateau that lasts a few decades. The great variation seen during this period matches the great scatter expected for company lifetimes. Eventually, the number of companies ebbs to a much lower level of ‘entrenched’ manufacturers, those which, based on TAM properties, would only cease to build cars once the automobile itself is supplanted by a different product. The TAM data are rather similar: due to the flurry of activity right after a quake, the number of cultures has a broad peak and then slowly tapers off.
IV Discussion and outlook
The TAM dynamics is heavily based on the TNM model of biological evolution, and leads to the formation of a multicultural and evolving ecosystem, where long periods of stability labeled by extant families replace each other through rapid quakes, similarly to the QESS of the TNM. In a cultural setting, quakes could correspond to innovations disrupting the existing know-how and radically changing the way societies are organized. The hectic cultural exchanges accompanying these quakes are also reminiscent of aspects of cultural evolution. TAM cultures get more stable with age and lack a finite average life-time, leading to a large and time increasing scatter in the empirical distribution of cultures. At least qualitatively, these features resemble some aspects of real cultural evolution. Yet, TAM agents follow dynamical rules with a high degree of randomness and have limited information on the situation of other agents.
The only real difference between TAM and TNM dynamics lies in the copying and mutation mechanism: The TAM ‘genome’ is divided into two parts, called ‘interaction genome’ and ‘strategy’. Random mutations can only hit the second part directly. In a biologically inspired interpretation this could mean that the mutations affecting the first part are never viable. Secondly, individuals can copy each other’s strategies or parts thereof, with the choice of what to copy biased by the frequency or ‘popularity’ of the strategies copied. This swapping is similar to genetic recombination in bacteria. Note however that the new genetic material incorporated by an individual has no immediate effect on the latter’s reproductive ability. The effect comes first when an intervening mutation ‘promotes’ the copied and mutated material into the ‘interaction genome’ of the individual.
The macroscopic dynamics of both the TAM and the TNM and that of biological macroevolution Sibani95 ; Newman99e are decelerating, while it is commonly believed that human cultural evolution is an accelerating process. This point of view was recently challenged in a comparative study of cultural and biological evolution rates Perreault12 , where both types of rates are found to decrease with the inverse of the observation time over which they are measured. This behavior might be consistent with the deceleration of the TNM and TAM dynamics.
The perceived acceleration of cultural evolution might, at least in part, be due to time being measured in physical units. These units are appropriate for biological evolution, where the rate of mutation events (successful or not) can be considered constant in time. The same units are not necessarily appropriate, we would claim, for human cultural evolution, especially during periods where the population varies strongly. The intensity of inter-human interactions, i.e. their number per unit of (physical) time, has risen thousandfold from, say, neolithic times, where population was sparse and communication slow, to present times. The intensity has risen at an even faster pace during the last century, due to the increased levels of urbanization and, lately, to our pervasive and fast communication networks. It stands to reason that human cultural evolution should depend on the number of inter-personal interactions, and that time should be rescaled to units where the rate of these interactions is constant. Such rescaling would be very difficult to carry out, but it certainly inflate our current time compared to, say, neolithic time. Hence, the modern pace of human evolution expressed in rescaled units would come out greatly reduced.
Let us finally note they the population increase humanity has experienced is closely associated to emerging technologies and to the new cultural settings which allow their exploitation Leland00 . In the current version of the TAM cultures already affect, via the copying/mutation mechanisms, the agents’ reproduction rates, but the coupling is random.
In summary, the agents of the TAM model act in a probabilistic way based on partial knowledge
of their environment. The emergent properties of the model are its core, a group of established
and mutually supportive cultures which could qualitatively correspond to successful companies
trading with each other, and its intermittently populated cloud, similar to the large number
of start-ups which quickly go bankrupt every year. At least in the model, disruptive
innovations originate from ‘destabilizer’ start-ups, which grow and perish but trigger wave of change
eventually leading to new organizational ecosystems.
Acknowledgments.
The authors are indebted to Guido Fioretti for his insightful comments and for providing
an extensive and commented bibliography. Rudy Arthur has helped with his
interest and support through the different stages of the work, and
Nikolaj Becker has shared his insights on the dynamics of the TNM.
References
- [1] Ricard V. Solé, Sergi Valverde, Marti Rosas Casals, Stuart A. Kauffman, and Niles Eldredge. The Evolutionary Ecology of Technological Innovations. Complexity, 18:15–27, 2012.
- [2] Barbara Drossel. Biological evolution and statistical physics. Advances in physics, 50:209–295, 2001.
- [3] Claudio Castellano, Santo Fortunato, and Vittorio Loreto. Statistical physics of social dynamics. Reviews of Modern Physics, 81:591–646, 2009.
- [4] Per Arne Rikvold and R. K. P. Zia. Punctuated equilibria and noise in a biological coevolution model with individual-based dynamics. Phys. Rev. E, 68:031913, Sep 2003.
- [5] R. Axelrod. The dissemination of culture: A model with local convergence and global polarization. Journal of Conflict Resolution, 41(3):203–226, 1997.
- [6] S.J. Gould and N. Eldredge. Punctuated equilibrium comes of age. Nature, 366:223–227, 1993.
- [7] Stephen Jay Gould. The Structure of Evolutionary Theory. Belknap Harward, 2002.
- [8] Jared Diamond. The Rise and Fall of the Third Chimpanzee. Vintage, 1992.
- [9] Kevin N. Laland, John Odling-Smee, and Marcus W. Feldman. Niche construction, biological evolution, and cultural change. Behavioral and brain Sciences, 23:131–175, 2000.
- [10] K. Christensen, S.A. de Collobiano, M. Hall, and H.J. Jensen. Tangled nature: A model of evolutionary ecology. Journal of Theoretical Biology, 216(1):73–84, 2002.
- [11] Matt Hall, Kim Christensen, Simone A. di Collobiano, and Henrik Jeldtoft Jensen. Time-dependent extinction rate and species abundance in a tangled-nature model of biological evolution. Phys. Rev. E, 66:011904, 2002.
- [12] Paul Anderson, Henrik Jeldtoft Jensen, L.P. Oliveira and Paolo Sibani. Evolution in complex systems. Complexity, 10:49–56, 2004.
- [13] D. Lawson and H. J. Jensen. The species-area relationship and evolution. Journal of Theoretical Biology, 241(3):590–600, 2006. Cited By (since 1996):9.
- [14] Nikolaj Becker and Paolo Sibani. Evolution and non-equilibrium physics: A study of the Tangled Nature Model. EPL, 105:18005, 2014.
- [15] Ian Jolliffe. Principal Component Analysis. Encyclopedia of Statistics in Behavioral Science, Wiley, 2005.
- [16] Paolo Sibani and Jesper Dall. Log-Poisson statistics and pure aging in glassy systems. EPL, 64:8–14, 2003.
- [17] M. T. Hannan, E. A. Dundon, G. R. Carroll, and J. C. Torres. Organizational evolution in a multinational context. Entries of automobile manufacturers in Belgium, Britain, France, Germany, and Italy. American Sociological Review, 60(4):509–528, 1995.
- [18] M. Schmidt P. Sibani and Preben Alstrøm. Fitness optimization and decay of the extinction rate through biological evolution. Phys. Rev. Lett., 75:2055–2058, 1995.
- [19] M. E. J. Newman and P. Sibani. Extinction, diversity and survivorsip of taxa in the fossil record. Proceedings of the Royal Society London B, 266:1–7, 1999.
- [20] C. Perreault. The Pace of Cultural Evolution. PLoS ONE, 7(9):e45150, 2012.