Determining Health Utilities through
Data Mining of Social Media
Abstract
‘Health utilities’ measure patient preferences for perfect health compared to specific unhealthy states, such as asthma, a fractured hip, or colon cancer. When integrated over time, these estimations are called quality adjusted life years (QALYs). Until now, characterizing health utilities (HUs) required detailed patient interviews or written surveys. While reliable and specific, this data remained costly due to efforts to locate, enlist and coordinate participants. Thus the scope, context and temporality of diseases examined has remained limited.
Now that more than a billion people use social media, we propose a novel strategy: use natural language processing to analyze public online conversations for signals of the severity of medical conditions and correlate these to known HUs using machine learning. In this work, we filter a dataset that originally contained 2 billion tweets for relevant content on 60 diseases. Using this data, our algorithm successfully distinguished mild from severe diseases, which had previously been categorized only by traditional techniques. This represents progress towards two related applications: first, predicting HUs where such information is nonexistent; and second, (where rich HU data already exists) estimating temporal or geographic patterns of disease severity through data mining.
I Full Text:
The game theorist John Von Neumann and his collaborator, Morgenstern, designed one of the earliest measures of health utility (HU).neumann_theory_1944 Their method, called the Standard Gamble, quantifies quality-of-life by first asking patients to make a hypothetical, important decision. Ultimately, the information contained in that decision is converted to a number ranging between 0 and 1. To start, a patient imagines that researchers have developed a potent drug that can cure the patient’s disease. However the pill has a terrible side effect in some patients– instant death. So the patient is asked to decide on the maximum acceptable risk (m), expressed as a probability, that would allow proceeding with the therapy. A HU (u) is defined as 1 - m = u.
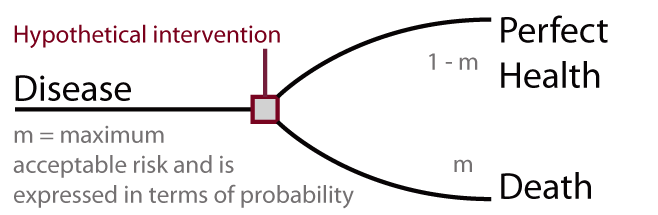
Patients with a lower quality of life (lower u) have a stronger desire for health and accommodate more risk (higher m). Importantly, health utilities are not disease-specific, so diverse health conditions and outcomes can be compared. For example, we can say that epilepsy is worse than asthma because, on average, epilepsy patients accept a higher risk of death when faced with the dilemma in the Standard Gamble. In contrast, there is no clear hierarchy for disease-specific endpoints such as seizure frequency or pulmonary function.
The integral of a HU, with respect to time, is called a Quality Adjusted Life Year (QALY). This is a metric widely used in cost-utility analyses which assess relative economic value of various health interventions. Therefore, thousands of published studies (including clinical guidelines and CDC assessments of public health) rely on estimates of disease severity in the form of HUs.neumann_legislating_2010
For decades, questionnaires or interviews like the Standard Gamble have served to elicit health utilities. Other examples in this class include: Time Trade Off and the Health Utilities Index. An alternative involves using algorithms that map clinical data to HUs. Generally, for a given health condition, clinical data and HU data must be collected simultaneously; then a regression model is built such that the objective data predicts the HU. For example, epilepsy patients with more frequent seizures may report lower quality-of-life, (although some evidence confounds this assumption).choi_seizure_2014 These mappings are generally limited to their disease context. For example, knowledge about the relationship of seizure frequency to HU does not transfer to a mapping of pulmonary function to HU.
Most recently, investigators have utilized natural language processing to filter Twitter and other social networks for novel indices of disease severity. Generally, HUs have not been utilized as training labels for these metrics, and algorithms apply to specific conditions only, such as toothachesheaivilin_public_2011 and depression.de_choudhury_social_2013 Despite vast repositories of patient generated data, there is no general data mining approach that can estimate a HU for any given disease.
Substantial progress has been made by Parimbelli et al.parimbelli_use_2014 who have used sentiment analysis (SA) of online health messaging boards to derive HUs. SA uses natural language processing (NLP) to extract emotional information from online messages; corporations have used it to monitor brand appeal and word-of-mouth recommendations by consumers. Parimbelli et al. use NLP to identify relevant content within five wellness domains (e.g. mobility, presence of pain, etc.). Then, using SA, a negativity score is created for each domain, providing weights for its HU estimate. The application computes a final score by weighting these HUs with traditionally derived HUs. So far the system has been validated on a scenario related to atrial fibrillation.
Like Parimbelli, we have an ambitious scope: we train an algorithm to estimate a HU for potentially any disease– not just a mapping that transforms disease-specific measurements into HUs. In contrast to Parimbelli, we use alternate natural language features to estimate HUs. We also highlight the performance of our method, comparing its estimates to held out data on 20 traditionally-derived HUs.

To test the idea that HUs can be derived from online health conversations, we attempted to build an algorithm to classify mild versus severe health conditions– the most essential dichotomy. We began by compiling a list of diseases with HUs previously determined by well-designed, highly-cited studies utilizing the traditional approach of interviews or surveys.
We preferred highly cited studies with the most scope in order to reduce the variation that inevitably arises between HU studies. Some studies undertake broad data collection efforts, apply a uniform methodology and report HUs for more than 100 diseases. Also, we required sufficient specificity with respect to the health conditions studied. Some HU studies aggregate conditions by International Classification of Disease code. Unfortunately, this lossy process results in terms that are too broad or vague for our purposes, such as “esophageal problem.”gold_toward_1998
For selected studies, we extracted health conditions with their HUs as ‘gold-standard’ labels. The conditions with the lowest HU became the ‘severe’ set, while the upper half became the ‘mild’ conditions, although we culled a margin of middle range of HUs (see table 2 below). Then for each condition in each class, we found related social media messages. We performed the search for related messages by using the exact term cited in the study, and then expanded our query to include all matching synonyms as provided by a consumer health vocabulary containing validated mappings between expert and layperson terminology.zeng-treitler_making_2007 We defined the entire corpora of social media messages related to a single disease, along with its class label, as ‘an example’.
Our social media content came from Twitter, a ‘microblogging’ site that limits user messages (called, ‘tweets’) to 140 characters. Challenges of using Twitter include its unmoderated content, unbounded by topic or context. Yet, users generate more than 500 million tweets every day and Twitter data has been utilized for hundreds of epidemiological studies. Data has been published showing that people share highly personal information.lee_what_2014 We obtained a dataset of 11 million health-related tweets, previously filtered from a dataset of two billion tweets.paul_discovering_2014
Finally we followed a standard methodology for machine learning experiments: each illness was randomly assigned to training, validation, and test sets. All sets had roughly the same proportion of mild and severe illnesses.
To develop a candidate set of features, we took two complementary approaches. For the first approach, we inspected a small sample of tweets. Scrolling through the data revealed that topics related to mild health problems often included a frivolous style such as usage of emoticons, while severe diseases engendered a more formal, grave tone that included conventional punctuation and syntax. Therefore, our candidate features became emoticons and patterns related to punctuation or capitalization.
![[Uncaptioned image]](/html/1608.03938/assets/PMT.png)
For the second approach, we relied on large scale screening to select single words (unigrams, hereafter). As a convenient source, we took a sentiment dictionary containing 2477 unigrams used for sentiment analysis (SA),nielsen_new_2011 then found the frequency of these unigrams in our social media corpus. Selecting the most frequent 50 unigrams, we further refined this set to include 16 unigrams that best separated the classes.
While we screened more than 60 variables for relevance, we selected only 24 features for training, which included 16 unigrams, three emoticon features, and five formality patterns. Using backward selection, we eliminated 15 features that had a minimal contribution to the classification accuracy on the validation set, leaving nine features in the final algorithm.
![[Uncaptioned image]](/html/1608.03938/assets/FFT.png)
For our learning algorithms, we compared the following classifiers implemented in the Python library, Scikit-learn: logistic regression, a decision tree, a linear support vector machine, and a Random Forest. These algorithms represent widely known, general-purpose algorithms in machine learning.
The decision tree classifier (with default settings) performed the best of the four algorithms: its accuracy is 72% on the test set. The final algorithm includes nine features, including emoticons, unigrams, and patterns indicating formality of sentence construction. The algorithm tends to misclassify mild diseases as severe. Amid these misclassified examples, there are no obvious trends in terms of data characteristics, such as number of tweets in the test set, nor are there obvious clinical features linking these diseases, such as age of onset, duration, or gender distribution.
Thus we have shown modest accuracy despite several challenges: our social media content is wide-ranging, and users are only a subset of the population. We did not extensively filter tweets to narrow context, such as for self-experience versus unrelated content. Also, the volume of tweets on each health condition is quite variable, ranging from about 100 tweets to 200,000. Since we had to manually extract suitable HUs from the literature, we have a limited supply of examples for training and validation.
![[Uncaptioned image]](/html/1608.03938/assets/Algorithm_table.png)
Limitations of data mining include the following: as noted in similar studies of online patient generated data, periodic crowd-level events cause unpredictability.ginsberg_detecting_2009 Using a diverse set of predictive features, and filtering for specific contexts could mitigate this to some degree. Also, attention will have to be paid to who is posting messages to social media and how they advocate or otherwise act as a proxy for patients with a particular disease. Sometimes HUs are obtained within highly controlled situations, such as clinical drug trials; clearly data mining cannot replace face-to-face elicitation in these circumstances.
Data mining addresses the many gaps in knowledge that exist (especially for the developing world) because of the expense of the traditional methodology. Our work represents a movement towards an information-age scaling of a clinical, research, and quality improvement task: gauging patient complaints related to health conditions and outcomes. In the business world, data mining of consumer sentiment is already widespread. Epidemiologists have already developed systems for tracking case counts using search engine data,ginsberg_detecting_2009 Twitter,lamb_separating_2013 or Wikipedia pageviews.generous_global_2014 Much of this work has focused on case counts but has lacked an assessment of case severity, and therefore misses an aspect of disease burden.
In summary, we have used 11 million health-related tweets and a learning algorithm to classify health conditions as severe or mild, a necessary step in the final goal of placing conditions on a continuum of severity. The power of data mining is that it can be applied to any disease with measurements occurring at any time interval. Unlike a survey, which has been the mainstay for more than 70 years, the marginal cost of analyzing an additional health condition is virtually zero. In particular, this has implications for the developing world, where text messaging and social media have grown increasingly prevalent and yet the assessment of disease burden remains challenging.
II Methods
Literature Selection: We used Pubmed and Google Scholar to identify established studies that defined health utilities for multiple, specific health conditions. Most of our HUs were obtained from a single study,gold_toward_1998 sponsored by the National Center for Health Statistics (NCHS). It met our criteria since it included 130 conditions and (as an indicator of acceptance) had 268 citations as of April 23, 2016. This agency, charged with monitoring the health of the US population for the Department of Health and Human Services, conducted the research to validate a novel HU measurement instrument (called HALex). The authors of the NCHS study conclude that HALex has good face validity and high correlations to other canonical studies. A secondary goal was to generate a catalog of HUs useful to studies that must rely on HU information from secondary data sources due to the prohibitive expense of acquiring primary data. We bolstered our HU dataset with other studies cataloging HUs,fryback_beaver_1993 including two containing pediatric health conditionscarroll_improving_2009 ; petrou_estimating_2009 in order to diversify the conditions studied. A few conditions were included that were not part of studies assessing multiple health conditions simultaneously.bilgic_psychiatric_2014 ; fluchel_self_2008 ; roux_burden_2012 To mitigate errors related to methodological variations between studies, we preferred that these single-study conditions had clear class membership (very mild or very severe).
Selection of Concepts: Although the NCHS study reports HUs on many specific illnesses, it still contains HUs associated with unhelpful, broader diagnostic bins: examples include ‘other extremity paralysis’, ‘orthopedic impairment-other’, ‘absent bone/joint’, and ‘hand or finger impairment’. We used common experience and the medical expertise of one of the authors, CLT, a medical doctor, to filter non-specific terms. In about 30 cases, we could not use a selected concept since we had an insufficient number of tweets (arbitrarily, fewer than 100).
Selection of Tweets: We filtered our dataset of 11 million health-related tweets for content related to our research. First, we selected all the tweets containing our concept of interest, matching tweets with a capitalization-insensitive algorithm. A concept is comprised of multiple descriptions (synonyms). For each HU study, we found a summary table listing every health condition measured and its corresponding HU. We extracted the exact health description mentioned in the summary table, and then retrieved all of its descriptions and pertinent word forms as defined by a consumer health vocabulary mentioned above. If a tweet matched more than one concept, it was selected for each concept.
Privacy: The health-related tweets obtained for this study contained only the content of the tweet, but we eliminated all other metadata. Because the tweets were intentionally public, this study was exempt from the IRB process. The tweets in table 1 were also public, and have been further modified by us to obscure attribution to a specific user.
Algorithm Development: For our learning algorithms, we compared the classifiers as discussed in the body of this article and implemented in the Python library, Scikit-learn. We randomized the examples to training, validation and test sets using stratified randomization, so that each set contained a similar range of health utilities. As discussed, we sequentially explored the decision tree hyperparameters by simply assigning increasingly extreme values while monitoring the effect on the validation error. As discussed above, we selected candidate predictive features via two approaches: manually developing features that capture differences in formality and in the second approach, differentiating frequencies of unigrams from the affective lexicon. Nuances related to the capitalization of these unigrams change their predictive value.
III References
References
- (1) Neumann, J. v. & Von Morgenstern, O. Theory of Games and Economic Behavior. Princeton University Press (1944).
- (2) Neumann, P. J. & Weinstein, M. C. Legislating against use of cost-effectiveness information. New England Journal of Medicine 363, 1495–1497 (2010).
- (3) Choi, H. et al. Seizure frequency and patient-centered outcome assessment in epilepsy. Epilepsia 55, 1205–1212 (2014).
- (4) Heaivilin, N., Gerbert, B., Page, J. E. & Gibbs, J. L. Public health surveillance of dental pain via Twitter. Journal of dental research 90, 1047–1051 (2011).
- (5) De Choudhury, M., Counts, S. & Horvitz, E. Social media as a measurement tool of depression in populations. In Proceedings of the 5th Annual ACM Web Science Conference, 47–56 (ACM, 2013).
- (6) Parimbelli, E. et al. Use of Patient Generated Data from Social Media and Collaborative Filtering for Preferences Elicitation in Shared Decision Making. In 2014 AAAI Fall Symposium Series (2014).
- (7) Gold, M. R., Franks, P., McCoy, K. I. & Fryback, D. G. Toward consistency in cost-utility analyses: using national measures to create condition-specific values. Medical care 36, 778–792 (1998).
- (8) Zeng-Treitler, Q., Goryachev, S., Kim, H., Keselman, A. & Rosendale, D. Making texts in electronic health records comprehensible to consumers: a prototype translator. In AMIA, 846–50 (2007).
- (9) Lee, J. L., DeCamp, M., Dredze, M., Chisolm, M. S. & Berger, Z. D. What are health-related users tweeting? A qualitative content analysis of health-related users and their messages on twitter. Journal of medical Internet research 16, e237 (2014).
- (10) Paul, M. J. & Dredze, M. Discovering health topics in social media using topic models. PLoS One 9, e103408 (2014).
- (11) Nielsen, F. A. A new ANEW: Evaluation of a word list for sentiment analysis in microblogs. arXiv preprint arXiv:1103.2903 (2011).
- (12) Ginsberg, J. et al. Detecting influenza epidemics using search engine query data. Nature 457, 1012–1014 (2009).
- (13) Lamb, A., Paul, M. J. & Dredze, M. Separating Fact from Fear: Tracking Flu Infections on Twitter. In HLT-NAACL, 789–795 (2013).
- (14) Generous, N., Fairchild, G., Deshpande, A., Del Valle, S. Y. & Priedhorsky, R. Global disease monitoring and forecasting with Wikipedia. PLoS Comput Biol 10, e1003892 (2014).
- (15) Fryback, D. G. et al. The beaver dam health outcomes study initial catalog of health-state quality factors. Medical Decision Making 13, 89–102 (1993).
- (16) Carroll, A. E. & Downs, S. M. Improving decision analyses: parent preferences (utility values) for pediatric health outcomes. The Journal of pediatrics 155, 21–25 (2009).
- (17) Petrou, S. & Kupek, E. Estimating preference-based health utilities index mark 3 utility scores for childhood conditions in England and Scotland. Medical decision making 29, 291–303 (2009).
- (18) Bilgiç, . et al. Psychiatric symptomatology and health-related quality of life in children and adolescents with alopecia areata. Journal of the European Academy of Dermatology and Venereology 28, 1463–1468 (2014).
- (19) Fluchel, M. et al. Self and proxy-reported health status and health-related quality of life in survivors of childhood cancer in Uruguay. Pediatric blood & cancer 50, 838–843 (2008).
- (20) Roux, C. et al. Burden of non-hip, non-vertebral fractures on quality of life in postmenopausal women. Osteoporosis International 23, 2863–2871 (2012).
IV End Notes
Supplementary Information Table comprised of all health conditions used in the study and for each: number of tweets, HU value from literature, source of HU value, partition (training, validation, or test).
Acknowledgements The authors are grateful to Michael J. Paul and Mark Dredze for sharing Tweets, Reid Priedhorsky for sharing feedback, and Rebecca Anthony for her editing, critiques, and encouragement.
Author Contributions: C.L.T. conceptualized the study. J.I. provided feedback on the study design. C.L.T. and C.Y. performed the analyses. C.L.T. prepared the manuscript, with extensive editing by J.I. and C.Y.
Author Information: The authors are affiliated with Michigan State University, (East Lansing, MI 48824, USA), from the following departments: Chris Thompson, MD, MHI is from pediatrics, Clint Young, PhD is from the department of Physics, Astronomy and the National Superconducting Cyclotron Laboratory. Josh Introne, PhD is from Media and Information. The authors declare no competing financial interests. The corresponding author is Christopher L. Thompson.