Measuring the State of the Art of Automated Pathway Curation Using Graph Algorithms - A Case Study of the mTOR Pathway
Abstract
This paper evaluates the difference between human pathway curation and current NLP systems. We propose graph analysis methods for quantifying the gap between human curated pathway maps and the output of state-of-the-art automatic NLP systems. Evaluation is performed on the popular mTOR pathway. Based on analyzing where current systems perform well and where they fail, we identify possible avenues for progress.
1 Introduction
Biological pathways encode sequences of biological reactions, such as phosphorylation, activations etc, involving various biological species, such as genes, proteins etc., in response to certain stimuli or spontaneous at times [Aldridge et al., 2006, Kitano, 2002]. Studying and analyzing pathways is crucial to understanding biological systems and for the development of effective disease treatments and drugs [Creixell et al., 2015, Khatri et al., 2012]. There have been numerous efforts to reconstruct detailed process-based and disease level pathway maps such as Parkinson disease map [Fujita et al., 2014], Alzheimers disease Map [Mizuno et al., 2012], mTOR pathway Map [Caron et al., 2010], and the TLR pathway map [Oda and Kitano, 2006]). Traditionally, these maps are constructed and curated by expert pathway curators who manually read numerous biomedical documents, comprehend and assimilate the knowledge in them and construct the pathway.
Manual curation of pathways is rather challenging given the ever increasing barrage of scientific publications. It is basically common place in this community that manual curation is not sufficient [Baumgartner et al., 2007]. Consequently, Automated Pathway Curation has been an active area of research - particularly in the BioNLP community [Miwa et al., 2012, Valenzuela-Escárcega et al., 2015]. It is also the goal of large scale research efforts such as DARPA’s Big Mechanism Project [Cohen, 2015].
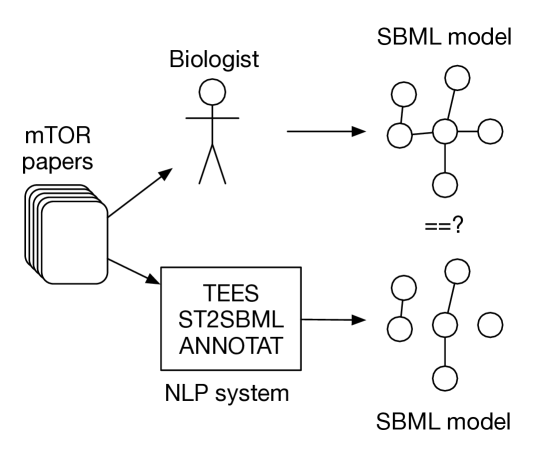
NLP systems have shown to perform well in BioNLP competitions [Nédellec et al., 2013, Ohta et al., 2013, Ananiadou et al., 2010], but so far we do not have systems that automatically assemble and curate pathways of the scope and complexity of, for example, the mTOR pathway. This paper investigates why this is the case. We measure the state of the art by closing the gap between NLP representations and biological networks, then we apply graph theory and in particular graph matching to quantify how much overlap there is between the NLP output and the information that humans assemble (see also Figure 1). The evaluation is performed on the popular mTOR pathway.
This paper starts by introducing our approach, followed by a description of data sets and evaluation results. We conclude by discussing where current system seem to fail and how to make progress.
2 Bridging the Gap
In this paper, we close the representational gaps between current NLP systems and human-generated pathways, measure the overlap and analyze possible shortcomings of current systems. Evaluation is performed on the popular, hand-curated mTOR pathway map [Caron et al., 2010]. Experts have curated and assembled the information from 522 papers into one large map using CellDesigner [Funahashi et al., 2008] - a software for modeling but also executing mechanistic models of pathways. CellDesigner represents information using a heavily customized XML-based SBML format [Hucka et al., 2003].
mTOR has been published along with a list of the 522 papers used to build the map. This allows us to treat the same papers with state-of-the-art NLP extraction systems. Here we used one of the most successful NLP systems around - the TURKU event extractions system [Björne, 2014, TEES]. TEES has won 1st place in BioNLP 2009 ST, 2011 ST and DDI 2011 [Björne et al., 2012]. The system integrates various NLP techniques to extract events from text. Processing roughly proceeds as follows 1) A number of external tools detect protein names and parse the sentences. 2) The event detector detects trigger words such as verbs, which is followed by detection of interactions. 3) Complex events are constructed. 4) The system detects modifiers such as negation and speculation.
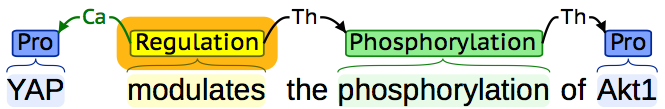
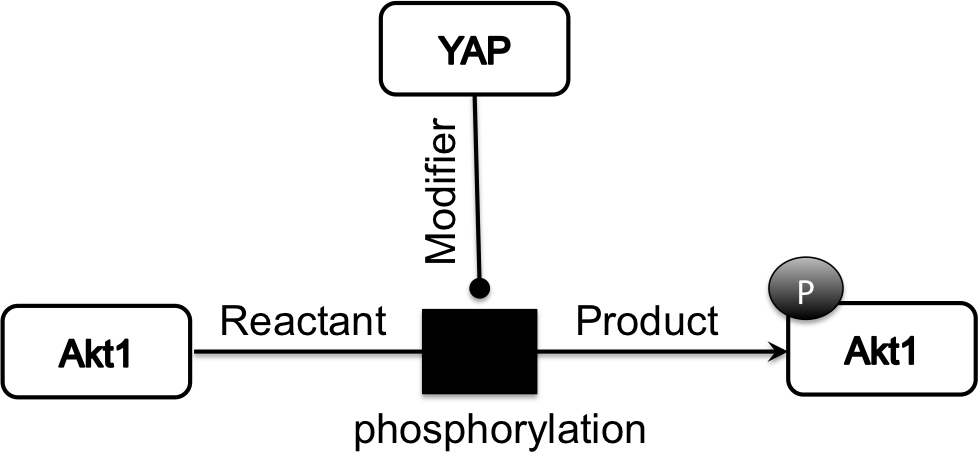
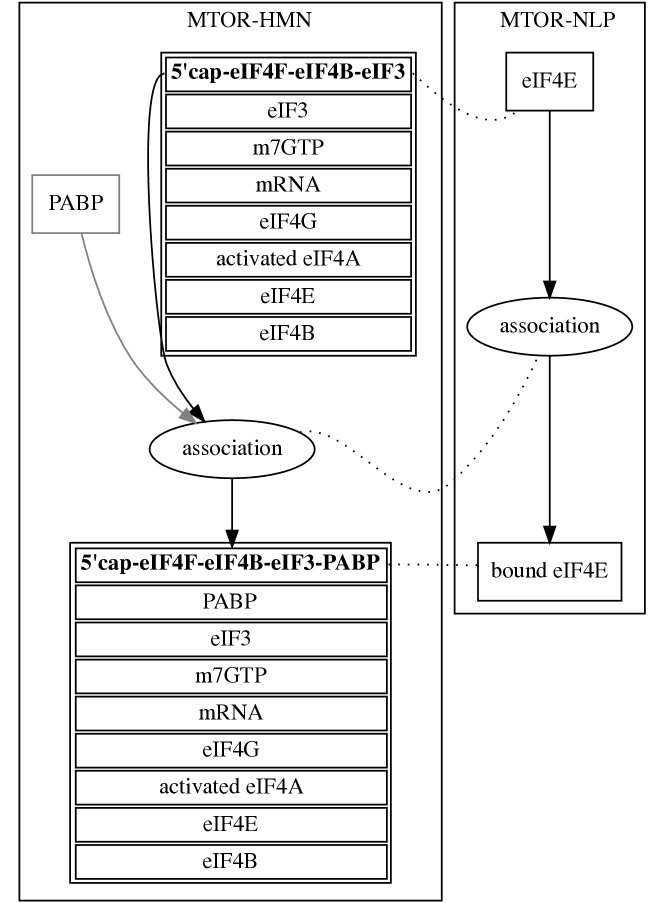
NLP systems typically operate on something called the standoff format. From a sentence such as in Figure 3, standoff containing entities and events will be extracted. These in principle correspond to biological species and reactions. We translate the NLP representation into SBML pathways and perform additional annotation [Spranger et al., 2015] of species and reactions. For the sentence in Figure 3, the extracted SBML is visualized in Figure 1.
Datasets
We compared 3 different sets of data all related to mTOR pathway.
MTOR-HMN
is a mTOR pathway map manually constructed by human expert pathway curators. [Caron et al., 2010]. The pathway is encoded in a dialect of SBML used by CellDesigner [Funahashi et al., 2008]. We convert the CellDesigner format into pure SBML and annotate reactions and species further by automatically assigning reaction types and gene/protein identifers (see description below).
MTOR-ANN
consists of 57 abstracts of scientific papers from Pubmed related to the mTORpathway map. The data set was human-annotated for NLP system training [Ohta et al., 2011, Corpus annotations (c) GENIA Project111http://nactem.ac.uk/GENIA/current/Other-corpora/mTOR-Pathway-Events/]. This corpus gives an idea of the potential performance of a machine with human-level NLP extraction capabilities. Annotated NLP entities and events were used to create SBML representations and further annotated using various tools (discussed below).
MTOR-NLP
consists of 522 full text papers mentioned in the mTOR pathway map. Paper pdfs were downloaded automatically and translated into raw txt files using CERMINE [Tkaczyk et al., 2015]. We managed to extract text from 501 papers. The 501 papers were processed using the Turku Event Extraction System mentioned earlier. From the extracted NLP events we created SBML representations of pathway maps for each text using [Spranger et al., 2015]. The SBML was further annotated using various tools (discussed below) and, finally, loaded into a single pathway map.
Notice that MTOR-ANN and MTOR-NLP are different in how they are constructed and consequently what kind of conclusion we can draw from them. MTOR-ANN is a human-annotated dataset which contains much less data than MTOR-NLP. However, because it is human-annotated it allows us to evaluate a human-level performance extraction systems. So we cannot expect that MTOR-ANN is able to reconstruct everything in MTOR-HMN (recall). However, as we will argue in this paper, we might expect that what is extracted in MTOR-ANN does occur in MTOR-HMN (high precision).
The following table shows number of species, reactions and edges between them for the different datasets.
| Dataset | # species | # reactions | # edges |
|---|---|---|---|
| MTOR-HMN | 2242 | 777 | 2457 |
| MTOR-ANN | 2457 | 857 | 2343 |
| MTOR-NLP | 292049 | 100130 | 203042 |
Annotation
Annotation SBO
Reactions in datasets MTOR-HMN, MTOR-ANN and MTOR-NLP were automatically annotated using Systems Biology Ontology (SBO) [Le Novère, 2006] and Gene Ontology (GO) terms. SBO provides a class hierarchy of reactions. Reactions can be of a certain type. For instance, NLP systems often identify regulation events. Regulation reactions form a hierarchy. For instance, positive regulation is a subclass of regulation reactions. Phosphorylation reactions are a subclass of conversion reactions.
All reactions in MTOR-HMN, MTOR-ANN, and MTOR-NLP are annotated using SBO/GO (coverage 100%). SBO/GO annotations are computed using different approaches. For MTOR-ANN and MTOR-NLP we used an automated annotation system that is also used to convert NLP event representations to SBML [Spranger et al., 2015]. For MTOR-HMN, we used annotations provided by humans extended by automatic annotations. Automatic annotations were deduced by examining the reactants and products of reactions. For example, if a phosphoryl group is added the reaction is annotated using the SBO term for phosphorylation. Notice, in MTOR-HMN each reaction can be annotated with multiple SBO/GO terms. For instance, a single reaction can be annotated as phosphorylation and activation. This is not the case for MTOR-ANN and MTOR-NLP where each reaction corresponds to exactly one SBO/GO term.
| MTOR-HMN | MTOR-ANN | MTOR-NLP | |
|---|---|---|---|
| activation | 72 | 104 | 16485 |
| association | 210 | 204 | 21055 |
| conversion | 171 | 0 | 0 |
| deacetylation | 1 | 0 | 0 |
| dephosphorylation | 28 | 14 | 0 |
| deubiquitination | 13 | 0 | 0 |
| dissociation | 43 | 55 | 0 |
| gene expression | 4 | 40 | 18810 |
| localization | 0 | 16 | 474 |
| negative regulation | 33 | 99 | 10723 |
| phosphorylation | 85 | 241 | 25406 |
| protein catabolism | 24 | 18 | 1080 |
| regulation | 0 | 0 | 4832 |
| transcription | 78 | 8 | 1265 |
| translation | 23 | 1 | 0 |
| transport | 87 | 53 | 0 |
| ubiquitination | 13 | 4 | 0 |
Annotation Entrez Gene
Species in all three datasets were annotated using the gene/protein named entity recognition and normalization software GNAT [Hakenberg et al., 2011] - a publicly available gene/protein normalization tool. GNAT returns a set of Entrez Gene identifiers [Maglott et al., 2005] for each input string. Species were annotated using all returned Entrez Gene identifiers for a particular species (organism human). We call the set of Entrez Gene identifiers returned by GNAT for each species Entrez Gene signature.
| # species | coverage | # Entrez ids | |
|---|---|---|---|
| MTOR-HMN | 2242 | 90% | 538 |
| MTOR-ANN | 2457 | 87% | 317 |
| MTOR-NLP | 292049 | 83% | 4194 |
3 Species
Pathways contain many references to the same protein or gene. We measured the number of unique genes and proteins in each dataset using various ways of identifying (normalizing) genes and proteins in a particular dataset.
| MTOR-HMN | MTOR-ANN | MTOR-NLP | |
|---|---|---|---|
| # species | 2242 | 2457 | 291218 |
| # names | 582 | 359 | 27928 |
| # appr names | 568 | 316 | 4517 |
| # Entrez signatures | 443 | 201 | 6220 |
The first row repeats the number of species per data set. The second row condenses the species names by removing prefixes such as “phosphorylated” and other adjectives irrelevant for determining the actual biological entity. The third row shows what happens when we reduce the names further by using a Levenshtein-based string distance with a cutoff point of 90. The last row measures how many different unique Entrez Gene id signatures there are. Each species is annotated with a set of Entrez Gene ids. The set of the Entrez Gene identifiers for each species is taken as a signature.
The numbers show the degree of redundancy or reuse of species within each pathway. They also suggest that there are far more species implicated in MTOR-NLP than there are in MTOR-HMN. In other words, human annotators of mTOR have selected 568 species and not the 4517 found by the NLP systems (approx names).
Unique Species Overlap
To better understand species identification we can measure the overlap of MTOR-ANN and MTOR-NLP with MTOR-HMN based on the unique species. Here we consider names equal (nmeq), names approximately equal (appeq), Entrez Gene id signature equal (enteq) and Entrez Gene id signature overlap (entov). The focus is on unique items.
| precision | recall | f-score | |
| MTOR-HMN/MTOR-ANN | |||
| nmeq | 20.89 | 12.89 | 15.94 |
| appeq | 27.30 | 15.64 | 19.88 |
| enteq | 45.27 | 20.54 | 28.26 |
| entov | 83.08 | 55.53 | 66.57 |
| MTOR-HMN/MTOR-NLP | |||
| nmeq | 0.96 | 45.88 | 1.87 |
| appeq | 1.59 | 51.20 | 3.08 |
| enteq | 4.60 | 64.56 | 8.58 |
| entov | 58.04 | 99.55 | 73.33 |
The rows nmeq show precision and recall for unique species names in MTOR-NLP with respect to MTOR-HMN. Precision is low - meaning that only a small percentage of unique species names in MTOR-NLP actually appear in MTOR-HMN. On the other hand, recall is higher. This shows that the few correctly identified species in MTOR-NLP overlap with large parts of MTOR-HMN species. Less than a percent of unique species names in MTOR-NLP cover 46% of species in MTOR-HMN. What is interesting is that MTOR-ANN does not fair too great on precision either. 79% of the unique annotated names do not appear in MTOR-HMN. Especially the annotated version dataset MTOR-ANN, lets us conclude that many species mentioned in papers actually do NOT make it into the pathway or at least not as mentioned in the papers. These analyses point to the fact that researchers building pathways select species. In other words, pathway curation is not just extraction, but active selection and, in fact, identification of species with proteins and genes known to the scientist.
Complex Species
MTOR-HMN pathway contains a lot of complex species - i.e. species that contain other species. There are 351 complex species with a total of 1192 total constituents. 16 complexes are part of other complexes. Together this accounts for more than 70% of the species in MTOR-HMN. In other words, this is important information. Both MTOR-NLP and MTOR-ANN do not provide information about complexes explicitly. However, for this paper complexes are essentially treated like any other species.
4 Reactions
We first measured how many unique reaction types there are for each of the datasets.
| # reactions | # SBO/GO terms | # SBO/GO signatures | |
|---|---|---|---|
| MTOR-HMN | 777 | 15 | 29 |
| MTOR-ANN | 857 | 13 | 13 |
| MTOR-NLP | 100130 | 9 | 9 |
MTOR-HMN contains 777 reactions with 12 SBO/GO terms, i.e. reaction types. MTOR-ANN contains 12 and MTOR-NLP slightly less. Each reaction can have multiple SBO/GO terms associated with it. We call this the SBO/GO signature of a reaction. For instance, a particular reaction can be typed as phosphorylation and activation. Its signature are then the SBO/GO terms for these 2 reactions. The table shows that this actually only happens in MTOR-HMN. Human annotators are free to combine various reactions into a single reaction if they see fit. There is no replication of this in the automated data.
Unique Reaction Signature Overlap
We then measured how much unique signatures overlap across the different datasets. We checked three different measures: 1) sboeq requires that both signatures are the same, 2) sboov requires that the intersection of the signatures overlaps - i.e. is not empty - and 3) sboisa requires that there is at least one SBO/GO term in each signature that relate in a is_a relationship in the SBO reaction type hierarchy. For instance, if there is a phosphorylation reaction and a conversion reaction, then sboisa will match because phosphorylation is a subclass of conversion according to the SBO type hierarchy.
| precision | recall | f-score | |
| MTOR-HMN/MTOR-ANN | |||
| sboeq | 69.23 | 31.03 | 42.86 |
| sboov | 45.51 | 50.19 | 47.74 |
| sboisa | 92.31 | 93.10 | 92.70 |
| MTOR-HMN/MTOR-NLP | |||
| sboeq | 55.56 | 17.24 | 26.32 |
| sboov | 77.78 | 68.97 | 73.11 |
| sboisa | 88.89 | 79.31 | 83.83 |
MTOR-ANN catches 1/3 of the reaction SBO/GO signatures directly and up to 93% when we allow for overlap sbo_is_a relationship. MTOR-NLP only directly includes 1 out of 5 reaction signatures. However, the overlap is higher when allowing for reaction SBO/GO signatures to overlap and individual SBO terms to be in a is_a relationship.
These results also show that there are reactions in MTOR-NLP and MTOR-ANN that are not part of MTOR-HMN (see also Table 1)
From this preliminary data, we can immediately identify an important difference between human annotation and automated NLP event extraction. Human annotators combine multiple reactions into a single reaction representation to condense information.
5 Networks - Connectedness
Ultimately we are interested in networks of reactions and species. Studying the output of NLP systems it becomes immediately clear that the result of these systems differs from hand-curated data in an important aspect: connectedness. To show this we measured isolation of species and networks (reactions cannot be isolated for structural reasons in SBML).
| # isolated networks | # isolated species | |
| MTOR-HMN | 4 | 6 |
| MTOR-ANN | 475 | 632 |
| MTOR-NLP | 83,093 | 110,490 |
In MTOR-HMN there are 4 separate subgraphs (no connection between them). 3 of them are modeling mistakes by human curators. Basically MTOR-HMN is one connected network. On the other hand, MTOR-ANN and MTOR-NLP consist of numerous unconnected networks. Each of them is quite small as the following data shows.
We measured min, max, mean and median number of species and reactions in each connected component subgraph.
| dataset | min | mean | median | max |
|---|---|---|---|---|
| MTOR-ANN | 1 | 3.00 | 1.0 | 24 |
| MTOR-NLP | 1 | 2.02 | 1.0 | 215 |
Results show that subgraphs in MTOR-ANN and MTOR-NLP on average contain between 2 and 3 species and reactions. So very often there will be a single reaction in a subgraph plus some reactant and maybe a product. On the other hand MTOR-HMN consists of essentially one large connected graph. So here is another fundamental difference: human modelers compose a single large graph, as opposed to just extracting single reactions.
6 Networks - Overlap
Arguably the most important question is how much overlap there is between disconnected reactions extracted by MTOR-ANN/MTOR-NLP with MTOR-HMN. For this, we measure subgraph isomorphisms of MTOR-ANN and MTOR-NLP subgraphs with the MTOR-HMN graph. We measured max overlap and allow multiple hits for each subgraph from MTOR-ANN and MTOR-NLP with parts of MTOR-HMN. We compare different strategies for node (species and reactions) and edge matching.
Species matching
We investigated name matches (nmeq), approximate name matches (appeq), Entrez Gene signature equal (enteq) and Entrez Gene signature overlaps (entov) and combinations thereof. For example, appeq/enteq matches two species if either their names match approximately OR their Entrez Gene signatures are equal. appeq/entov matches two species if their names match approximately OR their Entrez Gene signatures overlap. Since there is no information on complexes in MTOR-ANN/MTOR-NLP, we also allowed matches not only on the complex itself but also on its constituents (wc). So a link present in MTOR-NLP between some protein and its phosphorylated version, will match if a link is present in a complex that contains that protein in MTOR-HMN.
Reaction matching
Reaction matching relies on SBO/GO signatures. We checked with signatures equal (sboeq), signatures overlapping overlap (sboov) and signatures overlapping with individual SBO terms in is_a relationship (sboisa).
Edge matching
We only allowed strict edge matching. So if an edge marks a reactant, then it has to be a reactant in MTOR-HMN. Same holds for product and modifier.

The final point to note for the results of matching is that we removed isolated nodes (which are always species) from MTOR-ANN and MTOR-NLP, because here we are really interested in graph structure.
Network overlap results
Table 2 shows precision and recall for max overlap of different matching strategies (see also Figures 6 to 6). The table shows results for MTOR-ANN and MTOR-NLP successively. In general the first rows (nmeq, sboeq) represent very strict matching strategies. The last row (appeq/entov/wc, sbois) shows results for the most “relaxed” strategy.
Let us first analyze the performance of MTOR-NLP. The automated NLP system is able to retrieve roughly 9% of all edges given the strictest matching strategy. This means that 1 in 10 edges in the NLP extracted dataset actually appears as is in the human curated data (MTOR-HMN). Also, if we look at the most relaxed matching strategy appeq/entov/wc, sbois, we find that roughly 2 of 3 edges and 3 of 4 nodes (species and reactions) in the human curated MTOR have something to do with the NLP extracted data. In particular, the conversion and regulation reactions play a part in the 20 percentage points jump from 45.59 to 65.04 for edges from appeq/entov/wc, sboov to appeq/entov/wc, sboisa matching. Conversion and regulation are super classes for a whole range of reactions (conversion: phosphorylation etc; regulation: activation, inactivation etc).
Matching strategies that allow for matching complex constituents always have a higher recall and precision performance than their non constituent matching counterparts. For instance, nmeq, sboeq matches almost 20 percentage points less edges than nmeq/wc, sboeq (MTOR-HMN/MTOR-NLP). This increase in performance of constituent matching points to the fact that human modelers often attribute reactions to the whole complex. For instance, a phosphorylation may be acting on a constituent of a complex but the human modeler chooses to connect the reaction with the whole complex. These matching strategies do account for that and therefore are able to improve the numbers (in some cases) considerably.
Reactions in MTOR-HMN are sometimes incorporating various reaction types. In MTOR-ANN and MTOR-NLP, on the other hand, each reaction only has a single type. Reaction matching strategies sboov and sboisa account for that by looking at overlaps. This means that reactions in MTOR-ANN and MTOR-NLP will match with a reaction MTOR-HMN if the reaction type signatures intersection is not empty. In reality this means that the reaction in MTOR-ANN or MTOR-NLP has to be an element of the reaction in MTOR-HMN.
Lastly, let us take a look at MTOR-HMN/MTOR-ANN. MTOR-ANN contains much less data than MTOR-NLP but the reason we include it here is because MTOR-ANN consists of human annotated data. It therefore gives an idea about the limits of the annotation data and the limits of human annotation. If all of the problems discussed so far are purely a problem of the NLP system, then MTOR-ANN should do better than MTOR-NLP in terms of precision but not in terms of recall. Recall will be low because the MTOR-ANN consists of less data. However, we would expect high precision numbers. Interestingly, data shows that even for NLP-ANN precision is low. With relaxed matching strategies appeq/enteq/wc, sboisa and appeq/entov/wc, sboisa, we see some substantial recall 20% (remember NLP-ANN is only abstracts). Nevertheless precision for edges is only 1 in 10 and for nodes about the same.
| MTOR-HMN/MTOR-ANN | ||||
|---|---|---|---|---|
| nodes | edges | |||
| prec | rec | prec | rec | |
| nmeq, sboeq | 1.22 | 1.93 | 0.94 | 1.30 |
| nmeq, sboov | 1.52 | 2.72 | 1.15 | 1.91 |
| nmeq, sboisa | 3.15 | 4.00 | 2.43 | 2.65 |
| nmeq/wc, sboeq | 3.48 | 8.60 | 2.77 | 6.76 |
| nmeq/wc, sboov | 3.78 | 9.34 | 2.99 | 7.45 |
| nmeq/wc, sboisa | 5.59 | 12.21 | 4.44 | 9.73 |
| appeq, sboeq | 1.44 | 2.22 | 1.11 | 1.47 |
| appeq, sboov | 1.81 | 3.11 | 1.37 | 2.12 |
| appeq, sboisa | 3.93 | 4.50 | 2.99 | 2.89 |
| appeq/wc, sboeq | 3.85 | 8.90 | 3.07 | 7.04 |
| appeq/wc, sboov | 4.22 | 9.74 | 3.33 | 7.77 |
| appeq/wc, sboisa | 6.67 | 12.85 | 5.25 | 10.22 |
| appeq/enteq, sboeq | 2.74 | 3.02 | 2.13 | 1.95 |
| appeq/enteq, sboov | 3.19 | 3.86 | 2.43 | 2.65 |
| appeq/enteq, sboisa | 5.81 | 5.78 | 4.48 | 3.74 |
| appeq/enteq/wc, sboeq | 9.78 | 13.69 | 8.15 | 10.99 |
| appeq/enteq/wc, sboov | 10.48 | 15.37 | 8.66 | 12.54 |
| appeq/enteq/wc, sboisa | 14.67 | 23.88 | 11.95 | 19.90 |
| appeq/entov, sboeq | 8.85 | 10.33 | 7.34 | 7.41 |
| appeq/entov, sboov | 9.41 | 12.01 | 7.73 | 8.79 |
| appeq/entov, sboisa | 13.59 | 19.53 | 11.01 | 14.73 |
| appeq/entov/wc, sboeq | 9.78 | 13.69 | 8.15 | 10.99 |
| appeq/entov/wc, sboov | 10.48 | 15.37 | 8.66 | 12.54 |
| appeq/entov/wc, sboisa | 14.67 | 23.88 | 11.95 | 19.90 |
| MTOR-HMN/MTOR-NLP | ||||
| nodes | edges | |||
| prec | rec | prec | rec | |
| nmeq, sboeq | 6.31 | 13.25 | 5.84 | 8.67 |
| nmeq, sboov | 7.26 | 17.40 | 6.67 | 11.48 |
| nmeq, sboisa | 9.85 | 27.73 | 8.88 | 17.50 |
| nmeq/wc, sboeq | 9.83 | 40.19 | 9.21 | 31.14 |
| nmeq/wc, sboov | 10.82 | 44.34 | 10.08 | 34.43 |
| nmeq/wc, sboisa | 14.48 | 58.58 | 13.30 | 46.68 |
| appeq, sboeq | 6.56 | 14.04 | 6.07 | 9.24 |
| appeq, sboov | 7.53 | 18.69 | 6.92 | 12.37 |
| appeq, sboisa | 10.39 | 30.35 | 9.35 | 19.41 |
| appeq/wc, sboeq | 10.27 | 40.83 | 9.63 | 31.62 |
| appeq/wc, sboov | 11.28 | 45.53 | 10.52 | 35.33 |
| appeq/wc, sboisa | 15.24 | 60.85 | 13.98 | 48.43 |
| appeq/enteq, sboeq | 9.33 | 18.44 | 8.64 | 12.21 |
| appeq/enteq, sboov | 11.06 | 23.63 | 10.16 | 15.71 |
| appeq/enteq, sboisa | 15.94 | 37.22 | 14.28 | 24.50 |
| appeq/enteq/wc, sboeq | 21.40 | 49.73 | 20.11 | 40.58 |
| appeq/enteq/wc, sboov | 23.59 | 55.66 | 22.06 | 45.95 |
| appeq/enteq/wc, sboisa | 32.88 | 75.33 | 30.18 | 65.04 |
| appeq/entov, sboeq | 20.18 | 44.44 | 18.90 | 34.88 |
| appeq/entov, sboov | 22.35 | 50.32 | 20.83 | 39.97 |
| appeq/entov, sboisa | 31.34 | 69.85 | 28.65 | 57.51 |
| appeq/entov/wc, sboeq | 21.40 | 49.73 | 20.11 | 40.58 |
| appeq/entov/wc, sboov | 23.59 | 55.66 | 22.06 | 45.95 |
| appeq/entov/wc, sboisa | 32.88 | 75.33 | 30.18 | 65.04 |
Caveats
There are number of issues that need to be taken into account when analyzing these results. For instance, SBO/GO term annotation for MTOR-HMN is not perfect, as can be seen from the large number of conversion operations. Similarly, Entrez Gene id normalization has its problems, especially when dealing with complex species. Lastly, reaction signature overlap does not count reactions with multiple reaction types as separate. We are currently working on dealing with each of these issues. Some will arguably improve performance, others decrease precision and recall numbers. We are confident though that the general trends in the results will uphold.
7 Discussion
The last section quantitatively demonstrated differences between extraction and curation. Curation involves processes such as annotation, selection and, in particular, composition (of subgraphs into a large graph). The next paragraphs summarize the most important problems.
Species Normalization
There has been a lot of work on this topic [Van Landeghem et al., 2013, Wei et al., 2015, Sohn et al., 2008, Doğan et al., 2014, Hakenberg et al., 2011] provide impressive performance. But there is the problem of how to use the information provided by tools such as GNAT. GNAT, for instance, returns hypotheses of possible identifiers. It is then up to subsequent systems to use this information and reject certain hypotheses based on other information in the text.
Complex formation
Identification of complexes is missing from NLP extraction systems. To the best of our knowledge, there is very little work on extraction of complexes and their participants from text (except generally in terms of Named Entity Recognition). However, complexes are extremely important for the mTOR pathway. For a large part the pathway consists of complexes that form and subsequently modify other reactions. Not being able to extract such information is a significant disadvantage for automated systems.
Composition of pathways
The NLP system produces pathway maps that consist of scattered reactions without integrating them into one. The human map on the other hand is all about a single network of reactions. Composition is a combinatorial problem constrained by cues in the Natural Language as well as biology. This paper proposed a number of matching strategies. These strategies are not only useful for measuring the state-of-the-art. For instance, matching of species based on Entrez Gene normalization could be useful in pathway composition.
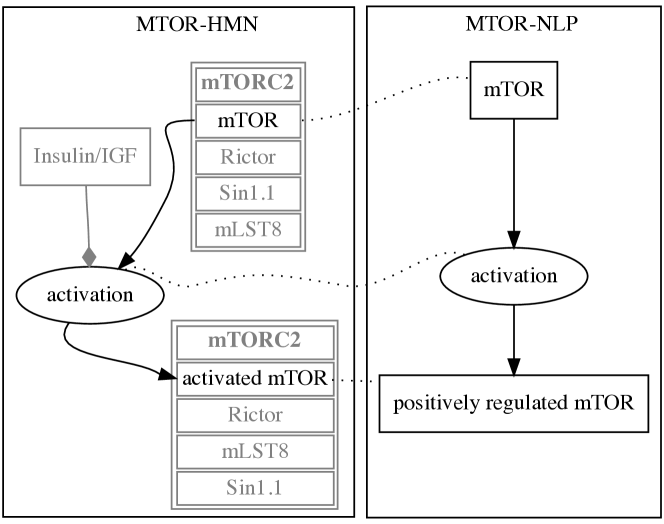
Understanding levels of detail of representation
A fundamental problem in pathway curation is that information can be represented on different levels of specificity. For instance, it might be sufficient to capture phosphorylation instead of capturing the exact sites or the number of phosphoryl groups added. Often human modelers make various abstractions and conceptualizations of the same underlying biological process. Final pathway maps are affected by prior knowledge of the curator and this shapes the pathway that a human produces. The problem then becomes how to build machines that can extract knowledge on various levels of abstraction.
It is important to realize that these issues are not just a problem of more data or more precise annotation. Current NLP systems are good at classifying strings and their relations but they have no notion of the underlying processes (in this case the biological processes involved). The learning signal of NLP systems is annotated text and it is not the human-curated biological model. The human as an expert in Systems Biology reading the text will pick out relevant detail and try to build a consistent overall model based on the information in the various texts. The NLP system relies on information detected in the text without any actual notion of what the text actually means, i.e. without building an internal model and integrating it with prior information.
8 Conclusion
To the best of our knowledge, this paper is the first to evaluate automated pathway extraction systems by measuring the difference between automated systems and human curation. We believe this kind of analysis is crucial to make progress towards the ultimate goal of complete automation of pathway curation. The contribution of this paper is twofold: 1) we propose a number of measures that can be used to quantify the state-of-the-art; 2) we identify a number of areas where progress can improve the state-of-the-art measurably.
This paper is part of a larger trend in NLP to move from event extraction to knowledge base creation [Kim et al., 2015] and construction of biologically relevant networks [Rinaldi et al., 2016]. It is therefore perfectly aligned with people trying to automatically build mechanistic dynamic pathway models [Cohen, 2015] that could ultimately have a big scientific impact [Kitano, 2016].
References
- [Aldridge et al., 2006] Bree B Aldridge, John M Burke, Douglas A Lauffenburger, and Peter K Sorger. 2006. Physicochemical modelling of cell signalling pathways. Nature cell biology, 8(11):1195–1203.
- [Ananiadou et al., 2010] S. Ananiadou, S. Pyysalo, J. Tsujii, and D. Kell. 2010. Event extraction for systems biology by text mining the literature. Trends in biotechnology, 28(7):381–90.
- [Baumgartner et al., 2007] W. Baumgartner, B. Cohen, L. Fox, et al. 2007. Manual curation is not sufficient for annotation of genomic databases. Bioinformatics, 23(13):i41–i48.
- [Björne et al., 2012] J. Björne, F. Ginter, and T. Salakoski. 2012. University of turku in the bionlp’11 shared task. BMC bioinformatics, 13(11):1.
- [Björne, 2014] J. Björne. 2014. Biomedical Event Extraction with Machine Learning. Ph.D. thesis, University of Turku.
- [Caron et al., 2010] E. Caron, S. Ghosh, Y. Matsuoka, et al. 2010. A comprehensive map of the mtor signaling network. Molecular systems biology, 6(1).
- [Cohen, 2015] P. Cohen. 2015. Darpa’s big mechanism program. Physical Biology, 12(4):045008.
- [Creixell et al., 2015] P. Creixell, J. Reimand, S. Haider, et al. 2015. Pathway and network analysis of cancer genomes. Nature methods, 12(7):615.
- [Doğan et al., 2014] Rezarta Islamaj Doğan, Donald C Comeau, Lana Yeganova, and W John Wilbur. 2014. Finding abbreviations in biomedical literature: three bioc-compatible modules and four bioc-formatted corpora. Database, 2014:bau044.
- [Fujita et al., 2014] K. Fujita, M. Ostaszewski, Y. Matsuoka, et al. 2014. Integrating pathways of parkinson’s disease in a molecular interaction map. Molecular neurobiology, 49(1):88–102.
- [Funahashi et al., 2008] A. Funahashi, Y. Matsuoka, A. Jouraku, et al. 2008. Celldesigner 3.5: a versatile modeling tool for biochemical networks. Proceedings of the IEEE, 96(8):1254–1265.
- [Hakenberg et al., 2011] Jörg Hakenberg, Martin Gerner, Maximilian Haeussler, Illés Solt, Conrad Plake, Michael Schroeder, Graciela Gonzalez, Goran Nenadic, and Casey M Bergman. 2011. The gnat library for local and remote gene mention normalization. Bioinformatics, 27(19):2769–2771.
- [Hucka et al., 2003] M. Hucka, A. Finney, H. Sauro, et al. 2003. The systems biology markup language (sbml): a medium for representation and exchange of biochemical network models. Bioinformatics, 19(4):524–531.
- [Khatri et al., 2012] P. Khatri, M. Sirota, and A. Butte. 2012. Ten years of pathway analysis: current approaches and outstanding challenges. PLoS Comput Biol, 8(2).
- [Kim et al., 2015] Jin-Dong Kim, Jung-jae Kim, Xu Han, and Dietrich Rebholz-Schuhmann. 2015. Extending the evaluation of genia event task toward knowledge base construction and comparison to gene regulation ontology task. BMC bioinformatics, 16(Suppl 10):S3.
- [Kitano, 2002] H. Kitano. 2002. Computational systems biology. Nature, 420(6912):206–210.
- [Kitano, 2016] H. Kitano. 2016. Artificial intelligence to win the nobel prize and beyond: Creating the engine for scientific discovery. AI Magazine.
- [Le Novère, 2006] N. Le Novère. 2006. Model storage, exchange and integration. BMC neuroscience.
- [Maglott et al., 2005] Donna Maglott, Jim Ostell, Kim D Pruitt, and Tatiana Tatusova. 2005. Entrez gene: gene-centered information at ncbi. Nucleic acids research, 33(suppl 1):D54–D58.
- [Miwa et al., 2012] M. Miwa, P. Thompson, J. McNaught, et al. 2012. Extracting semantically enriched events from biomedical literature. BMC bioinformatics, 13(1):1.
- [Mizuno et al., 2012] S. Mizuno, R. Iijima, S. Ogishima, et al. 2012. Alzpathway: a comprehensive map of signaling pathways of alzheimer’s disease. BMC systems biology, 6(1):52.
- [Nédellec et al., 2013] C. Nédellec, R. Bossy, J.-D. Kim, et al. 2013. Overview of bionlp shared task 2013. ACL, page 1.
- [Oda and Kitano, 2006] K. Oda and H. Kitano. 2006. A comprehensive map of the toll-like receptor signaling network. Molecular systems biology, 2(1).
- [Ohta et al., 2011] T. Ohta, S. Pyysalo, and J. Tsujii. 2011. From pathways to biomolecular events: opportunities and challenges. In Proceedings of BioNLP 2011 Workshop, pages 105–113. ACL.
- [Ohta et al., 2013] T. Ohta, S. Pyysalo, R. Rak, et al. 2013. Overview of the pathway curation (pc) task of bionlp shared task 2013. In Proceedings of the BioNLP Shared Task 2013 Workshop, pages 67–75. ACL.
- [Rinaldi et al., 2016] F. Rinaldi, T. Effendorf, and S. Madan. 2016. Biocreative 5 track 4: A shared task for the extraction of causal network information in biological expression language. Database.
- [Sohn et al., 2008] S. Sohn, D. Comeau, W. Kim, and J Wilbur. 2008. Abbreviation definition identification based on automatic precision estimates. BMC bioinformatics, 9(1):1.
- [Spranger et al., 2015] M. Spranger, S. Palaniappan, and S. Ghosh. 2015. Extracting biological pathway models from nlp event representations. In Proceedings of the 2015 Workshop on Biomedical Natural Language Processing (BioNLP 2015), pages 42—51. ACL.
- [Tkaczyk et al., 2015] D. Tkaczyk, P. Szostek, M. Fedoryszak, et al. 2015. Cermine: automatic extraction of structured metadata from scientific literature. International Journal on Document Analysis and Recognition (IJDAR), 18(4):317–335.
- [Valenzuela-Escárcega et al., 2015] M. Valenzuela-Escárcega, G. Hahn-Powell, T. Hicks, and M. Surdeanu. 2015. A domain-independent rule-based framework for event extraction. In Proceedings of the 53rd Annual Meeting of the Association for Computational Linguistics (ACL-IJCNLP), pages 127–132. ACL.
- [Van Landeghem et al., 2013] S. Van Landeghem, J. Björne, C.-H. Wei, et al. 2013. Large-scale event extraction from literature with multi-level gene normalization. PloS one, 8(4):e55814.
- [Wei et al., 2015] Chih-Hsuan Wei, Robert Leaman, and Zhiyong Lu. 2015. Simconcept: A hybrid approach for simplifying composite named entities in biomedical text. Biomedical and Health Informatics, IEEE Journal of, 19(4):1385–1391.