The insight into the dark side.
I. The \textcolor[rgb]0.00,0.00,0.00pitfalls of the dark halo parameters estimation
Abstract
We examined the reliability of estimates of pseudoisothermal, Burkert and NFW dark halo parameters for \textcolor[rgb]0.00,0.00,0.00 the methods based on the mass-modelling of the rotation curves. To do it we constructed the maps for the grid of the dark \textcolor[rgb]0.00,0.00,0.00matter halo parameters for a sample of 14 disc galaxies with high quality rotation curves from THINGS. \textcolor[rgb]0.00,0.00,0.00We considered two variants of models in which: a) the mass-to-light ratios of disc and bulge were taken as free parameters, b) the mass-to-light ratios were fixed in a narrow range according to the models of stellar populations.
To reproduce the possible \textcolor[rgb]0.00,0.00,0.00observational features of the real galaxies we made tests showing that the parameters of the three halo types change \textcolor[rgb]0.00,0.00,0.00critically in the cases of a lack of kinematic data in the central or peripheral areas and for different spatial resolutions.
We showed that due to the degeneracy between the central densities and the radial scales of the dark haloes there are considerable uncertainties of their concentrations estimates. Due to this reason it is also impossible to draw any firm conclusion about universality of the dark halo column density based on mass-modelling of even a high quality rotation curve. The problem is not solved by fixing the density of baryonic matter.
In contrast, the estimates of dark halo mass within optical radius are much more reliable. We demonstrated that one can evaluate successfully the halo mass using the pure best-fitting method without any restrictions on the mass-to-light ratios.
keywords:
galaxies: kinematics and dynamics, galaxies: evolution, dark matter1 Introduction
The problem of the dark matter (DM) that was discovered firstly by Zwicky (1933) and then found on galactic scales by Freeman (1970) plays important role in the current understanding of the evolution and formation processes in galaxies. Despite the long-lasting history of the studies of this problem there are still many open questions. For example, there is still no consensus on the form of the DM halo density profiles. The problem becomes much more complicated by the fact that the DM density profile could be changed due to the interaction with baryons (see, e.g., Macciò et al., 2012). The cosmologically motivated cuspy density profile by Navarro et al. (1996) fails to reproduce the observations of some galaxies including dwarfs and both high and low surface brightness galaxies — hereafter HSBs and LSBs (see, e.g., Burkert, 1995; Swaters et al., 2003; de Blok et al., 2001, 2003; Kuzio de Naray et al., 2008; Spano et al., 2008; Del Popolo, 2009; Kuzio de Naray & Kaufmann, 2011; Oh et al., 2011a, b; Oh et al., 2015). The DM halo-to-total mass fraction also remains quite uncertain because it depends on the assumptions that are made in the methods of its determination (see, e.g., Saburova & Del Popolo, 2014). For \textcolor[rgb]0.00,0.00,0.00disc galaxies the most popular and frequently used method to estimate the dark halo mass and density profile is the rotation curve decomposition into dark and luminous components, it is also called the mass-modelling technique. This task could have several different solutions especially if there is no additional information on the luminous matter density. \textcolor[rgb]0.00,0.00,0.00It became evident in the beginning of the studies of the dark matter in galaxies (van Albada & Sancisi, 1986) and it was discussed in the subsequent studies until the present day (see, f.e., Bershady et al., 2010; Saburova & Del Popolo, 2014). Complementary information can play a critical role. For instance, if we assume that the mass-to-light ratio of LSB discs is similar to that of HSBs it gives evidences that the dark matter dominates by mass even in the innermost regions. In this case one can explore directly the central regions of the dark halo radial distribution in LSBs (see, e.g. zero disc models in Kuzio de Naray et al., 2008). On the contrary, if the stellar discs of these galaxies are heavy, then the DM halo-to-total mass fraction is close to that of normal spirals (Fuchs, 2003; Saburova, 2011).
[rgb]0.00,0.00,0.00The pure best-fitting mass-modelling of rotation curve without the additional observational data becomes less popular with the appearance of the photometrical data for big samples of galaxies, especially in the infrared bands like, e.g., Spitzer Survey of Stellar Structure in Galaxies (S4G), which allows one to determine \textcolor[rgb]0.00,0.00,0.00more reliably the stellar mass. \textcolor[rgb]0.00,0.00,0.00This gave hope that one can finally put the valid constraints on the dark halo shapes, and compare masses and concentrations of the haloes with predicted ones to draw conclusions about the evolution of the galaxies. \textcolor[rgb]0.00,0.00,0.00However, this possibility should be verified.
In recent years, researchers claim the universality of such composite dark matter characteristic as its column or surface density: , where is the core radius (or the radial scale) of the density profile, and is its central density. Kormendy & Freeman (2004) obtained the DM surface density for a sample of late type galaxies and found that it is almost independent on the B-band luminosity. Donato et al. (2009) explored a more numerous sample of galaxies with wider range of luminosities. They utilized the different mass-modelling techniques and found that the DM halo surface density is constant for a wide range of luminosities. The conclusion of the universality of the DM halo surface density could be extremely important because it could give additional information about the nature of dark matter. Thus Milgrom (2009) concluded that the constancy of the DM surface density is in good agreement with the modified Newtonian dynamics (MOND) which predicted a quasi-universal value of for objects of all masses and of any internal structure except LSBs \textcolor[rgb]0.00,0.00,0.00(because these systems possess much lower mean accelerations). The universality of DM column density can also lead to the important conclusions on the evolution of galaxies of different types. Kormendy & Freeman (2016) showed that it could imply that the spiral, Im and dSph galaxies form a sequence of decreasing baryon-to-DM mass fraction with decreasing luminosity and they even found the hints toward the solution of too big to fail problem.
However, the universality of the DM surface density was not confirmed in a number of studies (see, e.g., Boyarsky et al., 2010; Napolitano et al., 2010; Del Popolo et al., 2013; Saburova & Del Popolo, 2014). The studies of Saburova & Del Popolo (2014) and Napolitano et al. (2010) show a dichotomy for the galaxies with low and high masses. According to these studies dwarf galaxies have a similar DM surface density (see also Burkert, 2015, giving evidences for the universality of in dwarf spheroidal galaxies) in contrast to high mass systems for which this parameter varies with luminosity and mass.
In current paper we present a research of the popular mass-modelling \textcolor[rgb]0.00,0.00,0.00of the rotation curve, which is widely used for the disc galaxies. Our goal is to test the reliability of the estimates of dark halo parameters using high quality input data. Using our technique we can also study the interconnection between the halo parameters and test the universality of the DM halo surface density.
2 The method and the data
The concept of universality of the DM surface density gave us idea that the rotation curve of a galaxy could be equally good fitted by several different pairs of values of radial scale and central density of DM halo, and there could be interdependence between these parameters in a galaxy. \textcolor[rgb]0.00,0.00,0.00 For models with fixed density of baryonic matter \textcolor[rgb]0.00,0.00,0.00this interconnection is mostly due to the halo shape (de Blok et al., 2001). For example for the pseudoisothermal DM halo profile the central density and the core radius are linked through the asymptotic velocity , which is restricted by the velocity on the flat part of the rotation curve. \textcolor[rgb]0.00,0.00,0.00However, in general case when the stellar density is considered as a free parameter this relation is less evident.
To study the interconnection between the dark halo parameters and their uncertainty we developed a technique, the main point of which is similar to that used in some studies (e.g., van den Bosch et al., 2000; de Blok et al., 2001; Napolitano et al., 2014; Corbelli et al., 2014). Its basic concept is to calculate the for the grid of values of the DM halo parameters. The advantage of the current paper is that we study the behavior of maps in details for a sample of galaxies with accurate rotation curves and also analyze the connection of the map features with the shape, the extension and spatial resolution of the rotation curves. \textcolor[rgb]0.00,0.00,0.00This study allows to get an idea about the reliability of output halo parameters simply by looking at the features of the input kinematical data.
[rgb]0.00,0.00,0.00We consider both the photometrical approach111The recent papers using the similar method: de Blok et al. (2008); Oh et al. (2015); Frank et al. (2015); Karachentsev et al. (2016)., in which the stellar surface density is found from the photometry (mostly in infrared band), and the pure best-fitting technique222This approach was utilized for example by the following papers: Barnes et al. (2004); Chemin et al. (2006); Spano et al. (2008); de Blok et al. (2008); Cardone & Del Popolo (2012); Kasparova (2012); Sofue (2015); Katz et al. (2016)., when the mass-to-light ratios of stellar disc and bulge represent the free parameters.
2.1 \textcolor[rgb]0.00,0.00,0.00The used equations
We consider disc galaxies with rotation curves that could be decomposed into the contributions of bulge, gas and stellar discs and DM halo:
| (1) |
The contribution of the DM halo is defined by the parameters of its density profile. In the current paper we used three \textcolor[rgb]0.00,0.00,0.00halo types:
(i) The density profile by Burkert (1995):
| (2) |
Here and are the central density and the radial scale of the halo333Below and are different for the various DM density profiles.. The corresponding contribution to the rotation curve:
| (3) |
where is the gravitational constant. We calculated \textcolor[rgb]0.00,0.00,0.00the halo masses within optical radius444\textcolor[rgb]0.00,0.00,0.00The values of are given in Tables A.1–A.3. For most galaxies of the sample (except NGC 2976 and NGC 4736, for which these values were taken from Leroy et al., 2008) we assumed that the optical radius is equal to four disc radial scalelengths. . \textcolor[rgb]0.00,0.00,0.00In case of Burkert profile, it is given by the following formula:
| (4) |
(ii) The pseudoisothermal profile (hereafter, piso):
| (5) |
| (6) |
| (7) |
(iii) The Navarro-Frenk-White profile Navarro et al. (1996) (hereafter, NFW):
| (8) |
| (9) |
| (10) |
For the bulge component we adopted Sersic profile of surface density (Sersic, 1968):
| (11) |
Here is the bulge central surface density, is the effective radius containing a half of the luminosity, (Caon et al. 1993) and is the Sersic index. We used the rotation curve of Sersic bulge determined according to Noordermeer (2008).
We calculated the gas and stellar disc contributions to the rotation curve \textcolor[rgb]0.00,0.00,0.00using the method by Casertano (1983) for a non-parametric density profile. The surface density profile of gas, the disc radial scalelength, bulge effective radius and \textcolor[rgb]0.00,0.00,0.00Sersic index were fixed and taken from observations (see Sect. 2.3). For the galaxies with available S4G images the surface density radial profile of stellar disc was determined from a difference between the total observed surface brightness profile and that of the bulge (see below).
2.2 \textcolor[rgb]0.00,0.00,0.00The assumptions on mass-to-light ratios: the two models
[rgb]0.00,0.00,0.00We considered the two possibilities for mass-to-light ratios of the stellar bulge and disc which were independent parameters during the fitting. In \textcolor[rgb]0.00,0.00,0.00the Models A the disc and bulge mass-to-light ratios were considered as free parameters (the best-fitting approach). In \textcolor[rgb]0.00,0.00,0.00the Model B we allowed them to vary in a narrow range between 0.45 (obtained using Tully-Fisher relation in a good agreement with the models of stellar population by McGaugh & Schombert, 2015) and 0.6 (Meidt et al., 2014) solar units at 555\textcolor[rgb]0.00,0.00,0.00For NGC 0925 and NGC 7331 absented in S4G with photometrical data in V-band we used the ranges of : and , correspondingly, according to their total colors and model relations from Zibetti et al. (2009) for Chabrier IMF and Bell et al. (2003) for scaled Salpeter IMF. . The value of the mass-to-light ratio at is almost independent on the color of stellar population (McGaugh & Schombert, 2014), thus it is reasonable to consider it to be nearly constant for all galaxies of the sample. But for three galaxies of our sample (NGC 2903, NGC 5055, NGC 6946) we had to widen the range of possible mass-to-light ratios to 0.3-0.6 in order to avoid unacceptably bad fit of the rotation curve.
[rgb]0.00,0.00,0.00The pure best-fitting model (Model A) is worth consideration despite it becomes less popular. The reasons are the following. Model A can be regarded as the most general case of the technique of mass-modelling of a rotation curve. If for example some DM halos profiles fail to reproduce the observed rotation curve even in this general case, they will definitely fail when the baryonic surface density is fixed. Another issue: in some cases, the photometrical model gives unsatisfactorily fit to the rotation curve (see the discussion of this problem in Sect. 3.1).
[rgb]0.00,0.00,0.00The results of our analysis of the best-fitting technique could also be useful if one needs to study the samples of galaxies for which there are no homogeneous high quality surface photometry data and no other information, that can be used to obtain the independent estimate of the disc surface density. For some unusual objects, like LSBs or galaxies with low dynamical mass-to-light ratios (see Saburova et al., 2015) the photometrical method can be less plausible than the best-fitting modelling, because there is possibility that the model color– relations for standard IMF (e.g. Salpeter) are not valid for them.
Thus, in order to understand the uncertainty of the dark halo parameters in general one should examine it for both fixed and free baryonic density distribution.
2.3 The sample and the data
We \textcolor[rgb]0.00,0.00,0.00performed our analysis on the sample of HSB spiral galaxies with accurate rotation curves from The Hi Nearby Galaxy Survey (THINGS, de Blok et al., 2008). The high spatial and velocity resolution made these data ideal for this aim. To put constraints on the stellar surface densities we choose the 3.6 m data from Spitzer Survey of Stellar Structure in Galaxies (S4G, Sheth et al., 2010). Unfortunately, these data were available not for all galaxies of the sample. For the galaxies absented in the S4G we used the structural parameters of disc and bulge taken from other literature. In Table 1 we give the names of the galaxies, the adopted distances and the note on the source of photometric data.
When the photometric data were available in S4G we firstly constructed the radial surface brightness profiles using ELLIPSE routine of IRAF software (Tody 1986). After that we decomposed the profiles into the contribution \textcolor[rgb]0.00,0.00,0.00of Sersic bulge (Eq. 11) and exponential disc:
| (12) |
where and are the disc central surface brightness and the exponential scalelength, correspondingly. Since in some cases the special features on the surface density profile (like knees) can play important role in the decomposition of the rotation curve we did not use in our analysis the smoothed radial density profile of exponential disc for the galaxies with available S4G data except NGC 2976. We came further and subtracted the contribution of the bulge from the total surface brightness profile to estimate the non-parametric surface brightness profile of the disc which we used in our analysis together with the bulge profile. \textcolor[rgb]0.00,0.00,0.00The calibration of the profiles was performed according to Querejeta et al. (2015). We also corrected the 3.6 m surface brightness for the inclination following Graham (2001). The \textcolor[rgb]0.00,0.00,0.00inclination angles were taken from (de Blok et al., 2008).
2.4 \textcolor[rgb]0.00,0.00,0.00Visualization of the results
We calculated the values of for a grid of parameters of the DM halo. The minimization was performed using the constrained non-linear Levenberg–Marquardt minimization implemented in the mpfit IDL package (by C. Markwardt, NASA). We believe that the choice of method of finding of minimum does not influence the results.
The resulting maps demonstrate the goodness of the rotation curve fitting for given parameters of DM halo. Each point of the map corresponds to the concrete values of the mass-to-light ratio of disc and bulge which, in cases of Models A, were varied without any limits in order to get the best-fitting of the rotation curve, while the dark halo radial scale and central volume density were fixed. \textcolor[rgb]0.00,0.00,0.00For Model B it is the same, but the mass-to-light ratios are varied in a narrow ranges given above.
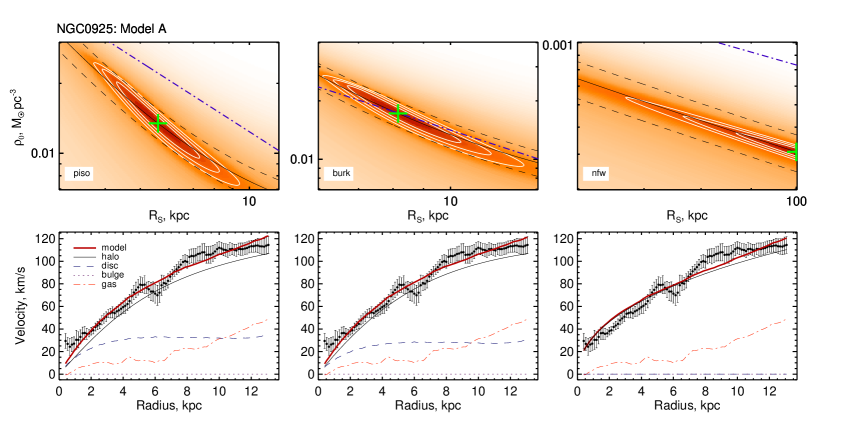
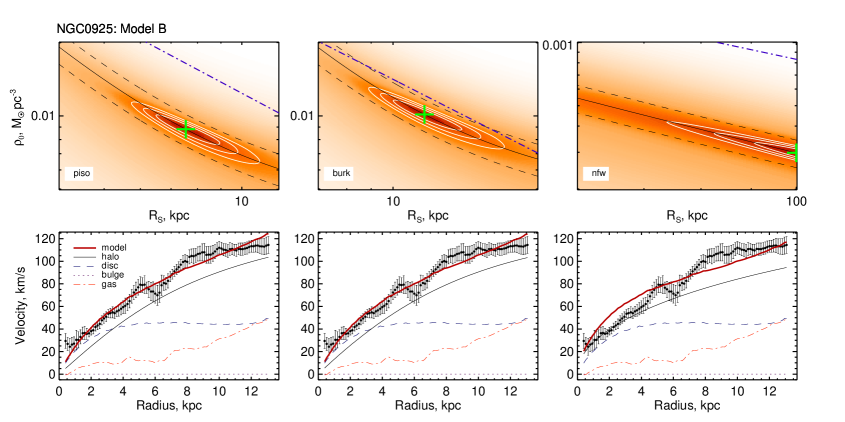
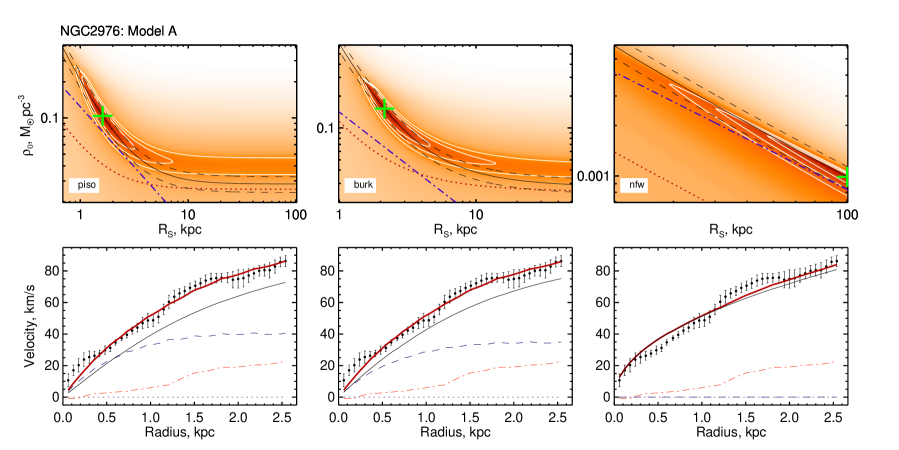
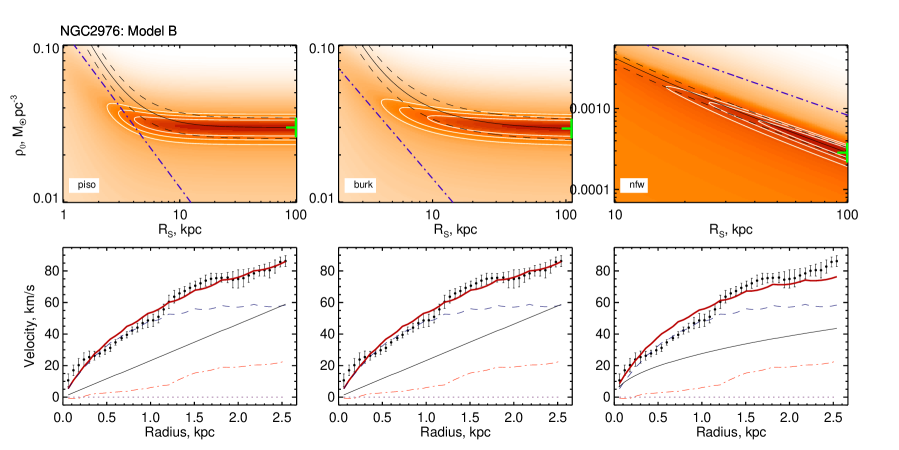
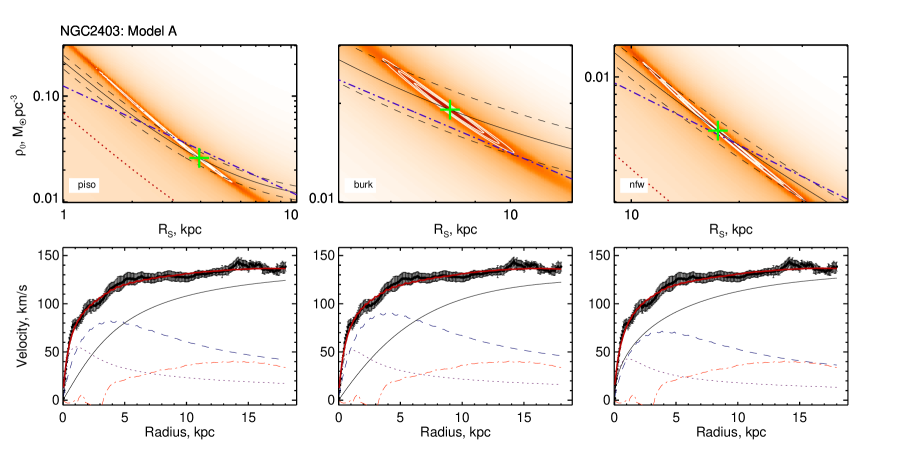
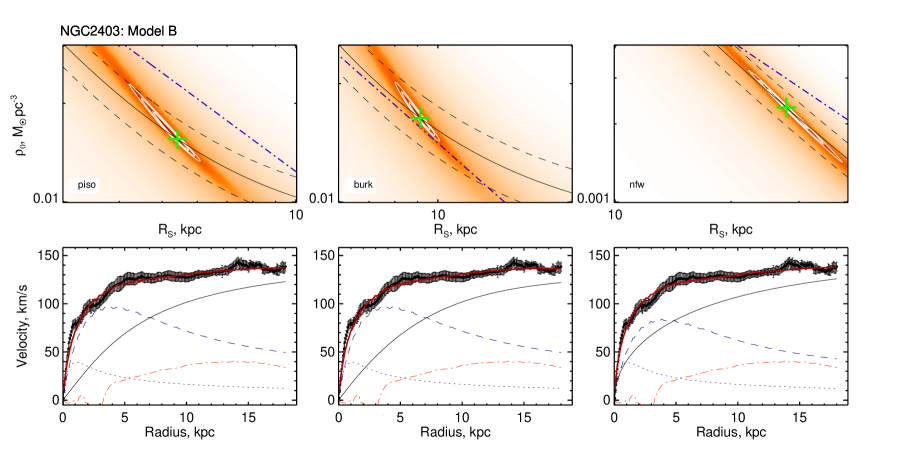
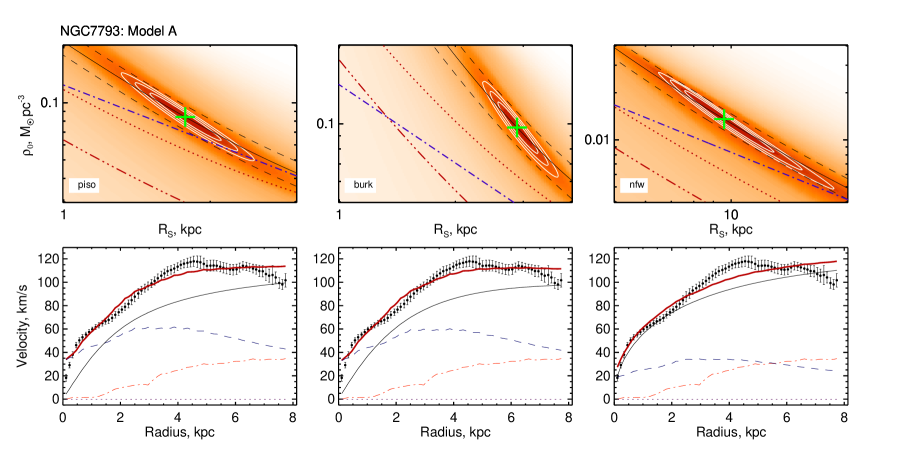
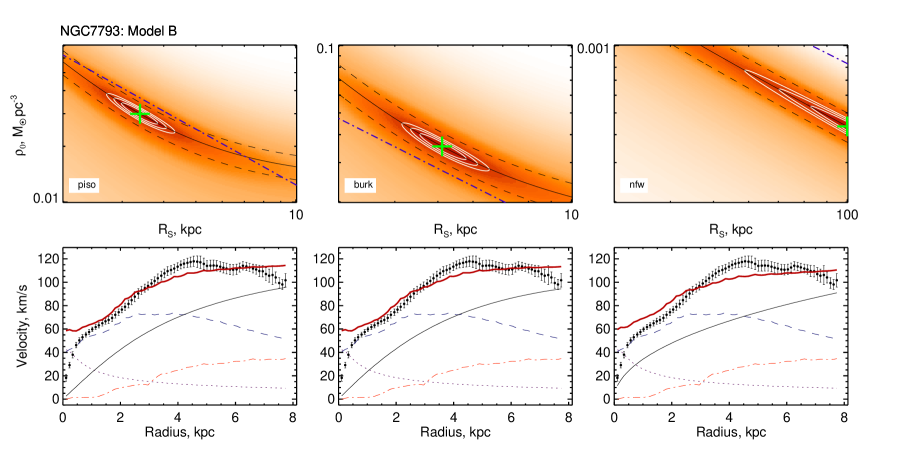
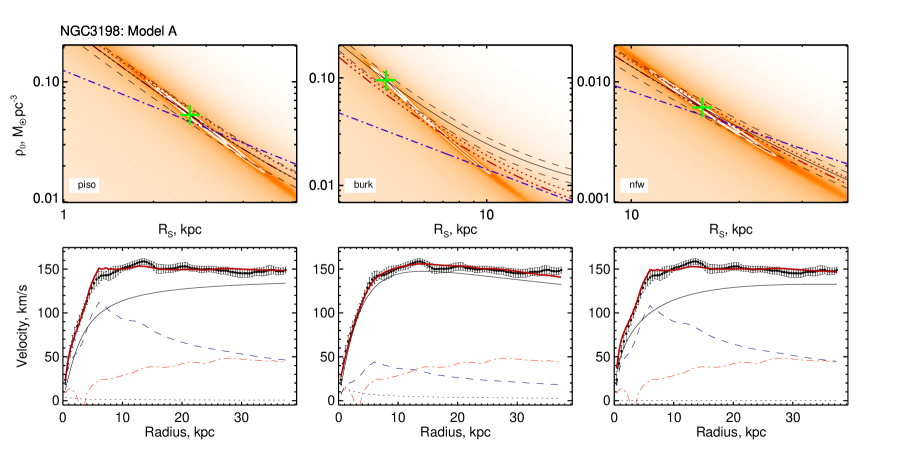
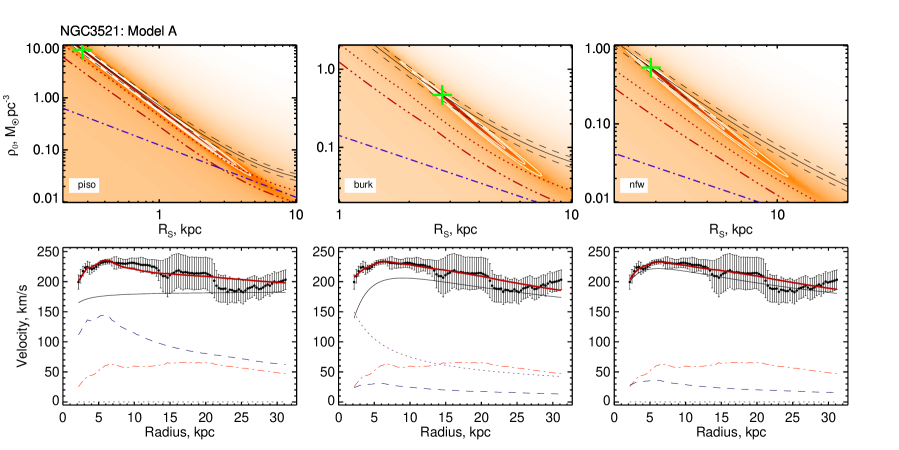
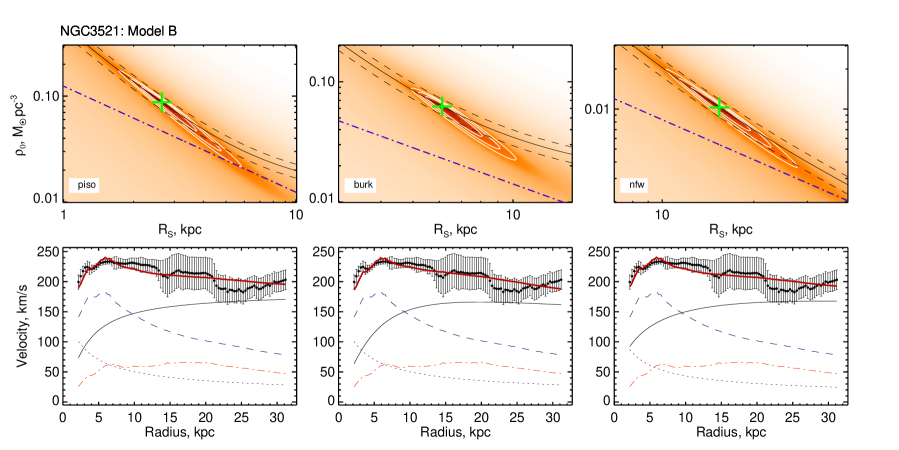
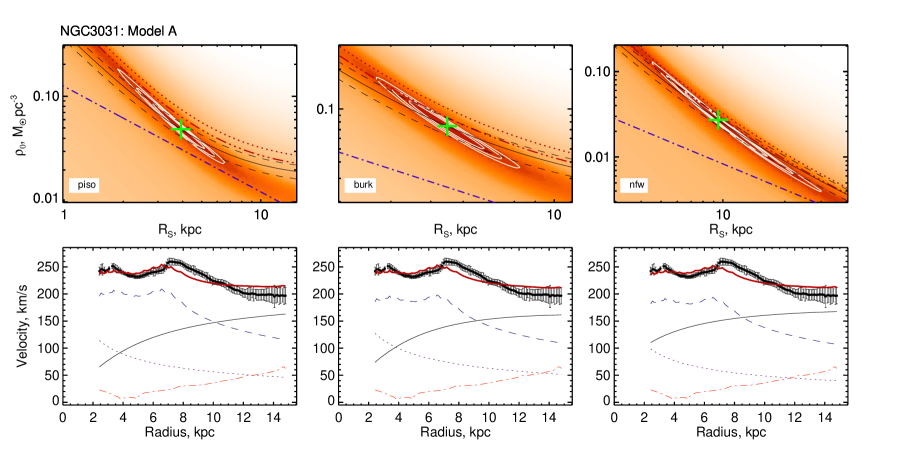
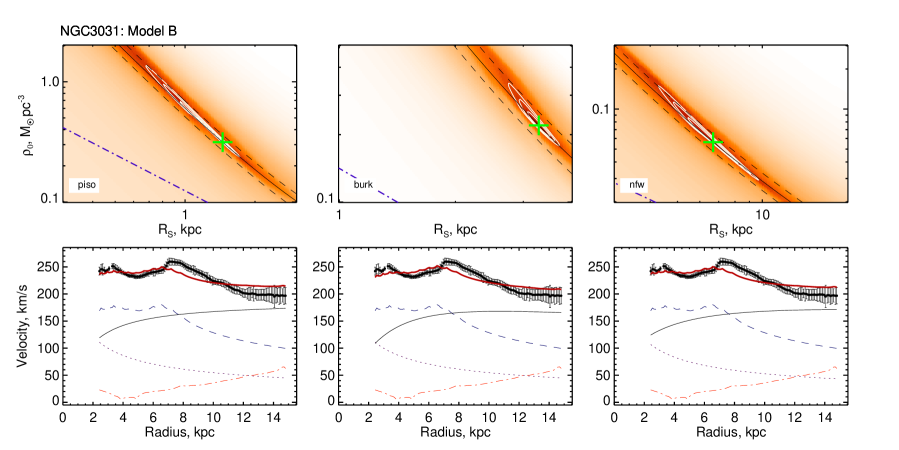
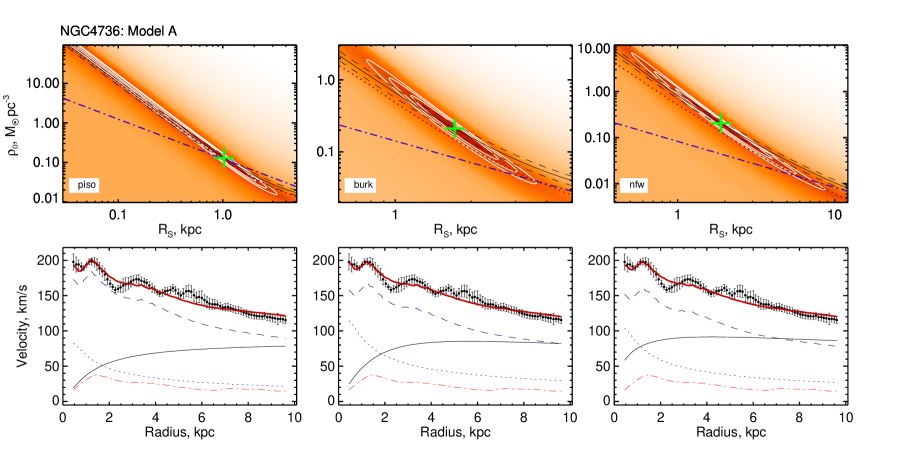
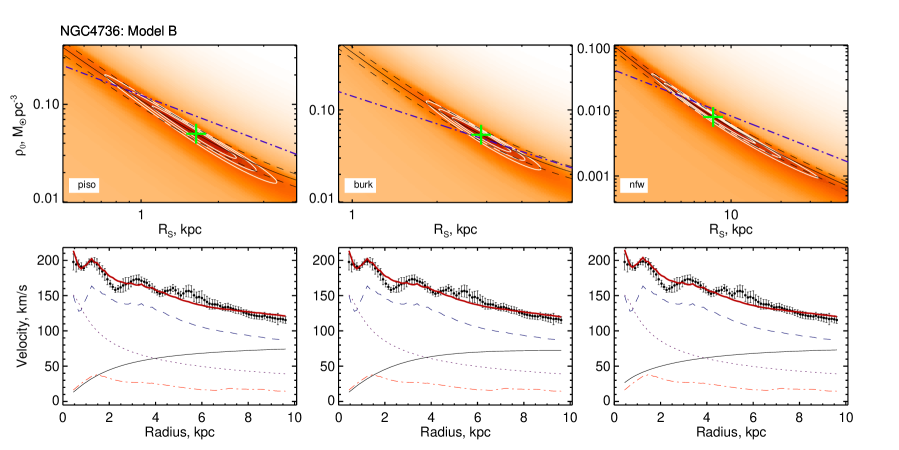
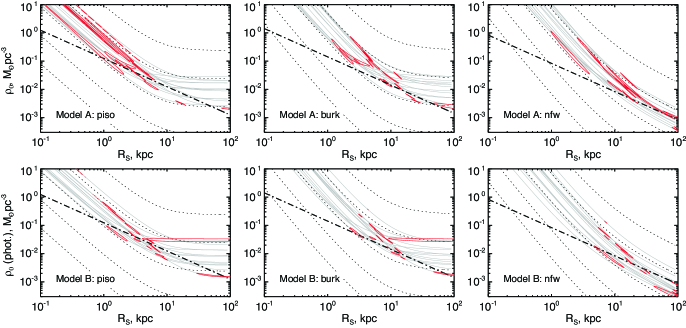
[rgb]0.00,0.00,0.00In Figs. 1–4 we show examples of the maps for both A and B Models. Left panels correspond to the models with the piso profiles of the dark halo, centre panels — to the Burkert profiles, right panels — to the NFW profiles. The color on the maps denotes the value, the darker the color, the lower the and the better is the fit. The white contours refer to , and confidence limits. The position of the parameters resulting from decomposition corresponding to the minimum is shown by cross in each map. \textcolor[rgb]0.00,0.00,0.00Black solid and dashed curves refer to the lines of constant mass of the dark halo inside of optical radius calculated from the parameters of the minimum models per cent. Blue dot-and-dash line corresponds to the constant surface density of dark halo taken from Donato et al. (2009) in the case of Burkert density profile. To convert into corresponding values of NFW and piso profiles we used the translation formulas from Boyarsky et al. (2009):
| (13) |
| (14) |
[rgb]0.00,0.00,0.00Red lines (dotted and dash-dot-dot-dotted) show the positions of the constant ratios , which were discussed in Sect. 2.2.
[rgb]0.00,0.00,0.00For illustrative purposes we also performed best-fitting of the rotation curves corresponding to the minimum (the lower row for each galaxy in Figs. 1–4). The black dots with error bars demonstrate the observed rotation curve (de Blok et al., 2008), thick red line — the total model, thin black line — dark halo, blue dashed line — stellar disc, dot-and-dashed red line — gas disc, dotted line — bulge.
We also give in Tables A.1–A.3 the parameters corresponding to the minimal values of for each type of DM density profile \textcolor[rgb]0.00,0.00,0.00for both A and B Models together with the errors associated with the range covered by confidence limit (each pair of the parameters of DM halo on the map corresponds to the certain values of , disc mass-to-light ratio and bulge central surface density) and \textcolor[rgb]0.00,0.00,0.00the minimal values of divided by the number of degrees of freedom. The listed estimates of disc mass-to-light ratio correspond to 3.6 m for all galaxies except for V-band cases of NGC 925 and NGC 7331.
| NGC | Dist., Mpc | Photometry source |
|---|---|---|
| 0925 | 9.2 | Baggett et al. (1998) |
| 2403 | 3.2 | de Blok et al. (2008) |
| 2841 | 14.1 | S4G |
| 2903 | 8.9 | S4G |
| 2976 | 3.6 | S4G |
| 3031 | 3.6 | S4G |
| 3198 | 13.8 | S4G |
| 3521 | 10.7 | S4G |
| 3621 | 6.6 | de Blok et al. (2008) |
| 4736 | 4.7 | S4G |
| 5055 | 10.1 | S4G |
| 6946 | 5.9 | de Blok et al. (2008) |
| 7331 | 14.7 | Baggett et al. (1998) |
| 7793 | 3.9 | S4G |
| NGC | |||
|---|---|---|---|
| arcsec | mag/arcsec2 | ||
| 2841 | |||
| 2903 | |||
| 2976 | |||
| 3031 | |||
| 3198 | |||
| 3521 | |||
| 4736 | |||
| 5055 | |||
| 7793 |

3 Results
| NGC | piso | burk | nfw |
|---|---|---|---|
| i. Increasing rotation curve | |||
| 0925 | + | + | |
| 2976 | + | + | |
| ii. Detailed data is present for inner parts of rotation curve | |||
| 2403 | + | + | |
| 3198 | + | + | + |
| 3621 | + | + | |
| 5055 | + | + | \textcolor[rgb]0.00,0.00,0.00+ |
| 7793 | |||
| iii. Only plateau | |||
| 2841 | |||
| 2903 | |||
| 3031 | + | + | + |
| 3521 | \textcolor[rgb]0.00,0.00,0.00 | \textcolor[rgb]0.00,0.00,0.00 | |
| 6946 | + | + | |
| 7331 | |||
| iv. Falling rotation curve | |||
| 4736 | \textcolor[rgb]0.00,0.00,0.00 | \textcolor[rgb]0.00,0.00,0.00 | |
3.1 \textcolor[rgb]0.00,0.00,0.00Comparison of the models
[rgb]0.00,0.00,0.00The interconnection between the DM halo parameters represents a separate important problem. As one can see from Figs. 1–4 for both models the maps show similar degeneracy of the density and scale of dark halo, but in case the photometrical approach (Model B) the spread of the parameters is significantly lower. Despite of the lower estimation errors (see Tables A.1–A.3) of the dark halo parameters the photometric method has its own weak point. The reduced values of the are significantly higher than for the best-fitting technique, which is expectable, but makes these models less reliable. \textcolor[rgb]0.00,0.00,0.00Moreover, for the three galaxies (as mentioned in Sect. 2.2), we were unable to get a satisfactory fit for the standard range of M/L at all. In some cases the M/L range extension does not improve a situation \textcolor[rgb]0.00,0.00,0.00(see Fig. 2 for NGC 7793). This problem was also mentioned in de Blok et al. (2008)666See Figs. 30, 37, 48, 50, 52, 53 for fixed baryonic surface density in the cited paper.. \textcolor[rgb]0.00,0.00,0.00Thus despite of the restriction of mass-to-light ratio decreases the dispersion of the possible parameters of DM halo it does not make the results of the mass-decomposition more reliable in many cases.
[rgb]0.00,0.00,0.00Another problem is the existence of models with infinite contours of confidence levels. \textcolor[rgb]0.00,0.00,0.00In other words, in these cases, the rotation curve can be described equally well by using a halo with the cardinally different parameters. \textcolor[rgb]0.00,0.00,0.00Even when the baryonic surface density is fixed we still got such models777\textcolor[rgb]0.00,0.00,0.00For NGC 0925 (NFW), NGC 2976, NGC 2841 (piso), NGC 2903 (piso, Burkert), NGC 3621 (NFW), NGC 6946 (NFW), NGC 7793 (NFW).. Noticeably models with NFW profile fail more often than that with other profiles when the baryonic surface density is fixed.
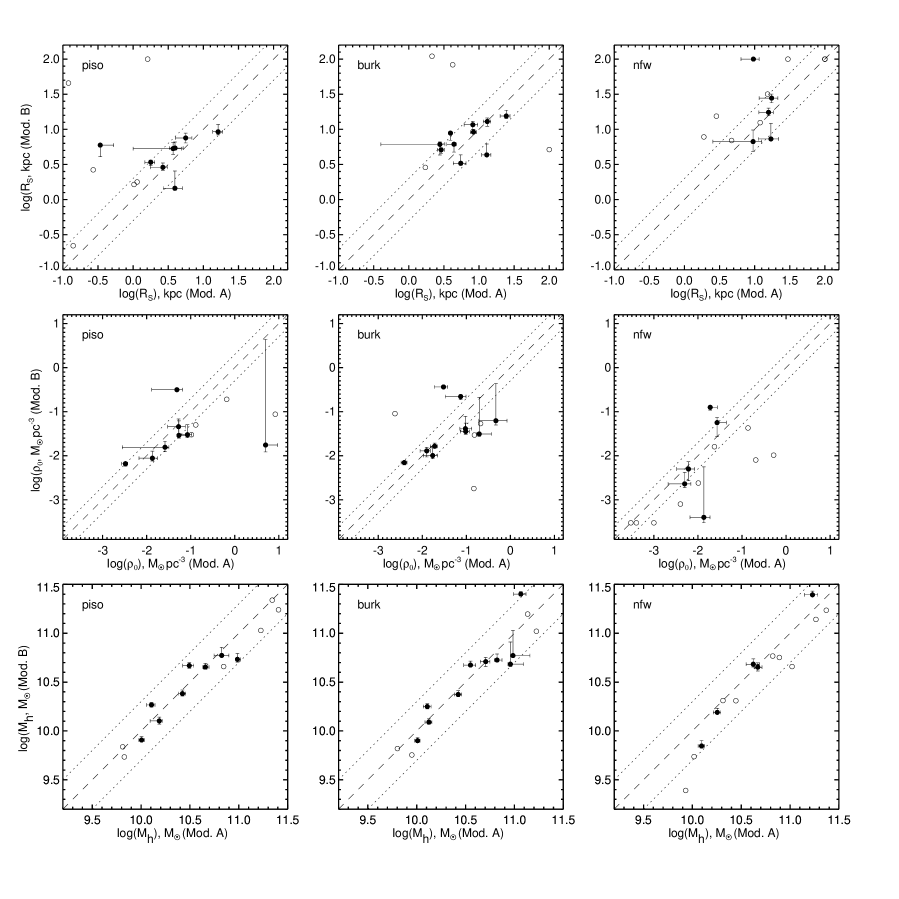
[rgb]0.00,0.00,0.00In Fig. 5 we demonstrate the comparison of central densities, radial scales and DM masses within optical radius resulting from \textcolor[rgb]0.00,0.00,0.00Models A and B. \textcolor[rgb]0.00,0.00,0.00Open circles mark the galaxies for which one of the two models for a considered halo profile give the infinite contours. The dashed and dotted lines correspond to the equal parameters and their twofold change. As one can see, \textcolor[rgb]0.00,0.00,0.00the results of DM halo mass determinations are in good agreement for Models A and B. Moreover, even the unreliable models (with infinite contours) give the stable mass estimations, due to the degeneracy between and along the line of constant halo mass. \textcolor[rgb]0.00,0.00,0.00The solutions for the central density and the scale are much more sensitive to the choice of the baryonic surface density.
3.2 Comparison with other authors
[rgb]0.00,0.00,0.00We compared the results of our best-fitting mass-modelling with the dark halo parameters found in de Blok et al. (2008)888We took their estimations for the best-fitting model, if these results were missing we used photometrical approach., Cardone & Del Popolo (2012), Kasparova (2012), Frank et al. (2015) and Karukes et al. (2015). We found a satisfactory agreement for most of the cases. But for some galaxies the discrepancies exceeded the 3 confidence limits (NGC 5055, NGC 7793, NGC 3621, NGC 0925 for Burkert halo). In most cases the discrepancies are most likely related to the difference between the photometrical data from the present and other papers.
Another cause of the discrepancy of the estimations is that the observed rotation curve is badly reproduced by given type of halo density profile and it could lead to big uncertainties of the DM halo parameters. For example, for NGC 0925 the Burkert halo density profile gives the bad fit to the rotation curve according to Cardone & Del Popolo (2012).
3.3 Halo masses
[rgb]0.00,0.00,0.00Our results show that in most of the cases the minimum regions lie along the line of the constant dark halo mass and the spread of the dark halo parameters corresponds to the range of per cent. Thus, for the best-fitting modelling the estimation of is much more accurate than that of and . As it was discussed above, in case of the baryonic density fixation it can just \textcolor[rgb]0.00,0.00,0.00follow from a halo shape. However, this relation becomes less evident for the best-fitting modelling without any limits on the mass-to-light ratios of disc and bulge when the stellar density can vary by several times.
[rgb]0.00,0.00,0.00The constancy of dark halo mass could possibly arise from the narrow range of the dark halo contribution to the rotation curve at the outermost regions. If the halo velocity at optical radius is close to the observed velocity at the outskirts of a galaxy , we can get approximate estimate of the dark halo mass which is almost identical to the dynamical mass inside of : . In order to test this possibility, we calculated this rough estimate of dark halo mass and compared it to the values followed from the rotation curve decomposition. We give the ratios of the estimates in column 9 of Tables A.1–A.3. As one can see from the Tables despite there are some cases when the rough estimate is close to that found from the rotation curve decomposition there is a significant number of galaxies for which the ratios of the dynamical masses and the halo masses found from the rotation curve decomposition differ significantly from unity. For roughly a quarter of the sample the ratios of the masses exceed 2. In a majority of cases the dynamical estimate is higher than follows from the mass-modelling which is expectable due to the neglecting of the baryonic matter contribution to the rotation curve at the outer radius which appears to be different for different galaxies. However, in a few cases the ratio of masses is lower than one, which indicates that the contribution of the dark halo at the optical radius in the model is higher than the velocity at the outermost point of the rotation curve. It is possible when the rotation curve has a bump followed by the lower rotational velocity amplitude in the plateau. In this case the mass-model traces the shape of the rotation curve which is impossible for the rough estimate. Another possibility is when the rotation curve does not reach the plateau making the estimate of uncertain.
[rgb]0.00,0.00,0.00Having in mind all described problems of the rough estimate of the dark halo mass we conclude that the rotation curve mass-modelling is still needed to obtain the reliable mass of the dark halo.
[rgb]0.00,0.00,0.00It should be noted that in the case of Models A, there are some exceptions in which the minimum behaves differently in comparison to the line of equal mass. In 6 out of 42 models — NGC 2903 (Burkert), NGC 3521, NGC 6946 (Burkert), NGC 7331 (piso) — confidence limits form two separate isolated contours, corresponding to two different values of DM halo mass. In these cases the two different total halo masses are possible, since there are two separate minima on the which lie in the two spaced and parallel lines of constant DM halo mass.
[rgb]0.00,0.00,0.00In spite of this for the majority of instances we can make the following general conclusion. \textcolor[rgb]0.00,0.00,0.00If the study is concerned on the dark halo masses, and is not aimed on its density, radial scale or \textcolor[rgb]0.00,0.00,0.00concentration, the pure best-fitting mass-modelling of the rotation curve could be enough for this purpose.
[rgb]0.00,0.00,0.00In addition to the above it is worth mentioning that the usage of NFW profile gives the halo mass estimations systematically higher (up to per cent) in comparison with other two halo shapes for most of the galaxies of our sample.
3.4 The disc mass-to-light ratio
The disc mass-to-light ratio can give important information that narrows the range of the dark halo parameters estimated from the mass-modelling. From Tables A.1—A.3 it is evident that \textcolor[rgb]0.00,0.00,0.00in the best-fitting approach in contrast to the the mass-to-light ratio of the disc is much more uncertain (the error exceeds 100 per cents in some cases).
We plotted on all maps (for Model A) the red lines of constant disc mass-to-light ratios999\textcolor[rgb]0.00,0.00,0.00In some cases (NGC 0925, NGC 2403 for Burkert halo) the pure best-fitting model gives the mass-to-light ratios that differ significantly from the photometrical ones, thus the red lines lie beyond the limits of the maps. \textcolor[rgb]0.00,0.00,0.00coinciding with the limit values for the Model B given in Sect. 2.2. As we can see from Figs. 1–4, in some cases one value of corresponds to the set of pairs (see e.g. Model A in Fig. 2 for NGC 3198). Another problem is that in some galaxies from the sample the result of \textcolor[rgb]0.00,0.00,0.00Models A is associated with that are too low or too high in comparison to the value expected from the photometry. It could indicate that either the part of mass is incorrectly assigned to some of the galaxy components or that the disc is more/less massive than it follows from the photometry. The later reason seems more questionable.
3.5 \textcolor[rgb]0.00,0.00,0.00Analysis of Model A results based on the characteristics of rotation curves
One of our aims was to understand how the features of a rotation curve influence the results of the mass-modelling. We decided to do it for the most general model (Model A).
[rgb]0.00,0.00,0.00We found from the maps (together with the parameters limits given in Tables A.1–A.3) that not in every case the results of Models A are reliable. We developed the following criteria in order to unveil the untrustworthy models: (a) the lack of separate minimum on the map (the infinite contour); (b) the solutions with zero disc contribution to the rotation curve.
For the convenience we arbitrarily divided the galaxies into the subsamples with different types of input kinematic data. Thus, taking into account the behaviour of the map and best-fitting models, we assert the importance of the four features of rotation curves.
-
i.
The increasing rotation curve. Only two galaxies of our sample (NGC 0925 and NGC 2976) do not have a plateau on the rotation curves, their rotational amplitudes are lower than 120 km/s. The rotation curves of NGC 0925 and NGC 2976 are not extended enough (the outermost radius is in contrast with other galaxies of the sample which have more extending rotation curves). In both cases, the \textcolor[rgb]0.00,0.00,0.00Models A for NFW halo ignore the disc presence (in the case of NGC 0925 the disc mass-to-light ratio also equals to zero inside the entire contour of map, for NGC 2976 there are solutions with which is quite low). The other DM halo profiles work correctly for these galaxies. Probably, this is due to a specific shape of the NFW profile and, at the same time, because of the lack of a certain rotation curve plateau. The latter does not allow to lock the parameters of the halo in the finite contour on map. It is worth noting that as it was previously shown by Kuzio de Naray et al. (2008), the contributions of NFW profile and maximal exponential disc into rotation curves are mutually exclusive for LSBs. We strengthen this conclusion for HSBs with increasing rotation curves.
-
ii.
Rotation curves with detailed data in the inner parts (including region within kpc). For this type of rotation curves on average, all models give satisfactory results. \textcolor[rgb]0.00,0.00,0.00Exceptions are the unsuccessful models with all halo types which are insensitive to the velocity fall on the disc periphery of NGC 7793. \textcolor[rgb]0.00,0.00,0.00Besides it, though the best-fitting model seems reasonable at first sight, it is impossible to obtain the NFW halo parameters of NGC 3621 (infinite contour).
-
iii.
The rotation curve with a lack of data in a few inner kiloparsecs (it could be probably due to the depression of Hi surface brightness in the central regions of these galaxies). In this case \textcolor[rgb]0.00,0.00,0.00almost half of models do not work well. The majority of best-fitting models give very different estimations of the dark halo masses and the disc-to-halo mass ratios for three different DM halo profiles. \textcolor[rgb]0.00,0.00,0.00Burkert and NFW models of NGC 3521 give a zero disc solution at almost the entire area. \textcolor[rgb]0.00,0.00,0.00There are two galaxies of this category (NGC 3031 and NGC 6946)101010\textcolor[rgb]0.00,0.00,0.00We did not take into account in our analysis that NGC 3031 has strong streaming motions along the spiral arms and NGC 6946 has a low inclination angle which leads to high uncertainty of the rotation curve. It can possibly influence the accuracy of the input data but will not change the main results of our analysis., which have good estimations of the dark matter parameters \textcolor[rgb]0.00,0.00,0.00probably due to the special features of their kinematic data. The first galaxy has a prominent bump on the rotation curve (at kpc) correlated with the stellar disc profile. The second one has a very small bulge (de Blok et al., 2008), which is reflected in the slow growth of rotation velocity within 5 kpc.
-
iv.
Decreasing rotation curve. This type is represented only by NGC 4736. \textcolor[rgb]0.00,0.00,0.00Our modelling of this galaxy \textcolor[rgb]0.00,0.00,0.00is very sensitive to the photometric data. Even small changes in the input data can lead to the \textcolor[rgb]0.00,0.00,0.00zero disc solution. As a result, we suppose that the method \textcolor[rgb]0.00,0.00,0.00should be used with caution for galaxies with decreasing rotation curves.
In Table 3 we show the classification of our models taking into account the types of the input data. For clarity we use the following denotation: we put “” for models that we think are unreliable (see above), “” marks good models, we mark “” sign, if, from our point of view, the best-fitting \textcolor[rgb]0.00,0.00,0.00Model A gives an incorrect contribution of one of the components due to not sufficient extension of the rotation curve (e.g., in the case of NGC 7793).
As one can see from Table 3, models with various profiles of DM halo are differently sensitive to the characteristic features of the input kinematic data. Applying the Burkert halo gives good results for \textcolor[rgb]0.00,0.00,0.0011 of the 14 galaxies. \textcolor[rgb]0.00,0.00,0.00In cases of the piso and NFW profiles — 8/14 good and 5/14 false models for both.
4 Discussion
4.1 The dark halo surface density
To test \textcolor[rgb]0.00,0.00,0.00the behaviour of dark halo surface densities and to understand how uncertain they could be we \textcolor[rgb]0.00,0.00,0.00plotted the confidence limits of the maps for all our galaxies together. In Fig. 6 we show the central densities versus the radial scales for three types of dark haloes \textcolor[rgb]0.00,0.00,0.00for Models A (top panels) and Models B (bottom panels). The dash-dotted lines correspond to found by Donato et al. (2009), corrected for given type of dark halo density profile as shown above (Eq. 13–14). \textcolor[rgb]0.00,0.00,0.00Dotted curves mark the constant mass lines for examples of objects with kpc and , , , and (from bottom-left to top-right of each panel) in solar units. Gray lines correspond to the constant mass lines of galaxies of our sample.
[rgb]0.00,0.00,0.00We can see that it is impossible to make valid conclusion about the universality of dark halo surface density using mass-modelling of the rotation curve in spite of the high quality of input data due to the big uncertainty even for Models B. \textcolor[rgb]0.00,0.00,0.00The possible exception can be made for the diagrams for models with Burkert profile which are more stable than the others, so the estimates are less uncertain. Despite of the wide ranges of the DM halo parameters and a small number of the galaxies we can see that there are several galaxies that have DM surface densities higher than was found by Donato et al. (2009) and the overall scatter of points is high.
[rgb]0.00,0.00,0.00 Another conclusion, that we draw from Fig. 6 is that as far as we consider here the sample of galaxies with the narrow range of halo masses we observe the steeper artificial correlation related to the degeneracy between and along the lines of halo mass constancy. Similar artificial correlation for LSBs was found and discussed e.g. by de Blok et al. (2001).
4.2 On the effect of data quality on the mass-decomposition
4.2.1 The influence of the rotation curve extension on the modelling
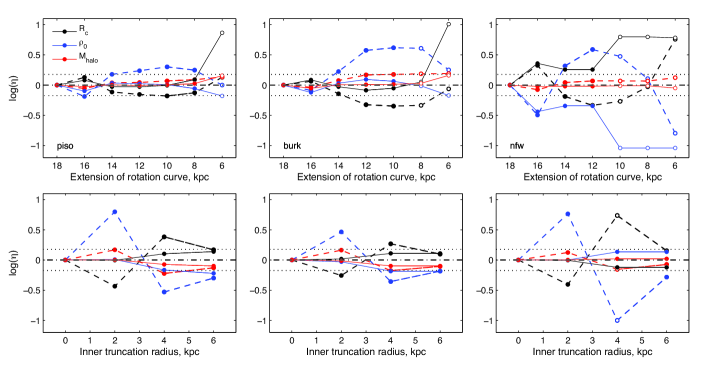
To test the sensitivity \textcolor[rgb]0.00,0.00,0.00of both Models A and B to the quality of the input kinematic data, we made two types of experiments. In the first type we chose several galaxies with sufficiently extended rotation curves and good mass-models. Then we cut the part of their observed rotation curve, as if these data are not available. After that, we run our program of the rotation curve decomposition using the truncated data and look at the changes of the parameter estimations of all halo types (piso, Burkert and NFW) \textcolor[rgb]0.00,0.00,0.00for both pure best-fitting Models A and photometrical Models B. We did this test both for \textcolor[rgb]0.00,0.00,0.00the truncation of inner and outer radii, \textcolor[rgb]0.00,0.00,0.00in order to simulate observational features connected to the evolution of galaxies (the Hi stripping from the disc periphery and the depletion of cold gas in the inner kiloparsecs).
We show in Fig. 7 the results of our test for NGC 2403 as an example. The top panels demonstrate the logarithm of the relative changes of the parameters , and (normalized to the ones for the models of non-truncated rotation curve) as a function of the outermost radius of known rotation curve (from 18 to 6 kpc). Dashed lines show the best-fitting Models A, solid lines — Models B. Open symbols mark the cases of infinite contour and accordingly untrustworthy model parameters. The dotted lines limit the change of the parameters in the range of \textcolor[rgb]0.00,0.00,0.00per cent. In the bottom panels we show the same plots but for the case of the inner part truncation of the rotation curve from to 6 kpc.
The diagrams for various galaxies look a bit differently, but we can make the following general conclusions:
-
•
There is an obvious degeneracy between parameters and for all types of halo profiles. This conclusion also follows from the maps — the contours of confidence limits are elongated and inclined in the vs diagrams.
-
•
The and parameters can vary dramatically (by several times), even for a small changes of the rotation curve extension.
-
•
\textcolor
[rgb]0.00,0.00,0.00 The truncation of the rotation curve at certain radius lead in some cases to the infinite contour, which makes impossible the correct determination of and . It is seen for the models with NFW profile of NGC 2403 starting from the outer cutting at 10 kpc (this is about the middle of the rotation curve plateau of NGC 2403).
-
•
\textcolor
[rgb]0.00,0.00,0.00The changes of the parameters become more moderate (especially for the inner truncation) for Model B in comparison to Model A. In certain points, however, the changes for Model B are even higher than for Model A (see e.g. upper row of Fig. 7 for NFW profile). The influence of the data extension can be significant even for the models with fixed baryonic surface density.
-
•
The DM halo mass is the most reliable parameter that comes from the mass-modelling, this conclusion is strengthened by the analysis of maps.
[rgb]0.00,0.00,0.00In the best-fitting Models A the solution for the disc mass-to-light ratio and central surface density of bulge is also unstable. Namely, in the absence of the additional information on the densities of disc and bulge one can get crucially different contributions of disc and bulge using the rotation curves of the same object but obtained, for instance, with different observational instruments. It can make the estimate of the parameters of dark halo even more unreliable.
4.2.2 The effect of spatial resolution on the results of mass-modelling
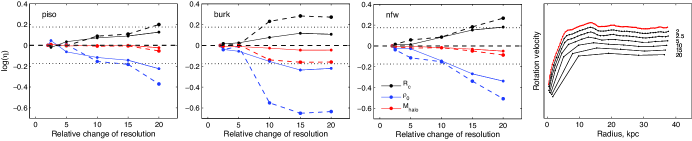
In the second type of experiments we decided to test the influence of the spatial resolution on the results of rotation curve decomposition. This effect could be very important especially for distant galaxies. And it could be essential to know whether the estimates of densities and radial scales of DM haloes for distant galaxies can deviate from that of the nearby galaxies due to some systematical errors related to the effects of finite spatial resolution.
To make this test we chose again the galaxies with reliable mass-models. In order to get worth resolution, we convolved the rotation curves with Gaussian with FWHM equal to the ratio of the new and initial spatial resolutions. After that we changed the number of bins proportionally to the relative change of resolution. We got gradually larger and larger bins and ran our program for each resolution. In Figs 8 we show the effects of degradation of rotation curve resolution on the example of NGC 3198 for three types of DM haloes \textcolor[rgb]0.00,0.00,0.00in cases of the best-fitting Model A (dashed lines) and the photometrical Model B (solid lines). The \textcolor[rgb]0.00,0.00,0.00right panel demonstrates the rotation curves for different resolution (the ratio of the resolutions is marked near each curve). Red line gives the initial rotation curve. In left panels we plot the logarithm of relative changes of parameters , and (normalized to the ones for the models of the observed rotation curve) as a function of the ratio between the new and initial resolution of the rotation curve. From Figs 8 one can see that the degradation of resolution has significant impact on the DM parameters, \textcolor[rgb]0.00,0.00,0.00which does not disappear if the baryonic density is fixed. \textcolor[rgb]0.00,0.00,0.00The change of resolution has the highest effect on the estimates of , (and hence on the dark halo concentration), that is consistent with the conclusions by de Blok et al. (2001) on the influence of the data resolution on the concentration parameter of dark halo for models with the NFW profile. In principle it can lead to the wrong conclusions if one compares the DM halo parameters of the nearby and distant galaxies obtained using the data with the same angular resolution. At the same time as in previous test the DM halo mass remains the closest to its value for the initial resolution.
5 Summary
We showed that in the case of mass-modelling of rotation curves there are considerable \textcolor[rgb]0.00,0.00,0.00estimate uncertainties of the central densities and the scales (and thus the concentrations) of the dark halo, unlike its mass, even using quite good input data.
We constructed the maps of the parameters of dark haloes for a sample of galaxies with high quality rotation curves taken from de Blok et al. (2008). We considered three types of dark halo \textcolor[rgb]0.00,0.00,0.00 radial density profiles: pseudoisothermal \textcolor[rgb]0.00,0.00,0.00(piso), Burkert and Navarro-Frenk-White \textcolor[rgb]0.00,0.00,0.00(NFW) . \textcolor[rgb]0.00,0.00,0.00In our analysis we deal with two possibilities. In the first \textcolor[rgb]0.00,0.00,0.00case the mass-to-light ratios of disc and bulge were taken as free parameters \textcolor[rgb]0.00,0.00,0.00(pure best-fitting, Models A). In the second possibility they were confined by the narrow range followed from the models of stellar population \textcolor[rgb]0.00,0.00,0.00(photometric approach, Models B).
[rgb]0.00,0.00,0.00The Model A is worth consideration because it represents the most general case of rotation curve mass-modelling, it is suitable for a large number of objects. The halo parameters obtained in this way are still widely used, e.g. for comparison with the predictions of the evolution simulations. The Model B has its disadvantages in comparison to Model A: it needs high quality photometrical data and uses assumptions on the stellar population properties such as stellar initial mass function.
The analysis of the maps allowed us to make conclusions on the reliability of the estimates of dark halo masses within optical radii, their central densities, radial scales \textcolor[rgb]0.00,0.00,0.00(and hence concentrations). The main results are given below.
-
1.
We showed that \textcolor[rgb]0.00,0.00,0.00in \textcolor[rgb]0.00,0.00,0.00one-third of cases, the Models A are not enough trustworthy (see Sect. 3.5). The ability to determine reliably the halo shape depends critically on the features of the rotation curve (type and extension of rotation curve, the presence of detailed data for its centre parts).
-
2.
\textcolor
[rgb]0.00,0.00,0.00If there are accurate enough kinematic data with detailed internal parts (including within kpc) the pure \textcolor[rgb]0.00,0.00,0.00best-fitting Models A give satisfactory results in most cases. In the case of the falling rotation curve or the poor data of inner parts, almost all models give predominantly unreliable results in the absence of some characteristic features in the kinematic data (as for NGC 3031). \textcolor[rgb]0.00,0.00,0.00The model with NFW profile gives unreliable estimates of and for the increasing rotation curve.
-
3.
\textcolor
[rgb]0.00,0.00,0.00Models A with the various halo forms are differently sensitive to the input kinematic data. Applying the Burkert halo gives good results for 11 of 14 galaxies. In cases of the piso and NFW profiles — 8/14 good and 5/14 false untrustworthy models for both.
-
4.
\textcolor
[rgb]0.00,0.00,0.00In the photometrical \textcolor[rgb]0.00,0.00,0.00Models B the uncertainty \textcolor[rgb]0.00,0.00,0.00of the halo parameters is significantly lower, \textcolor[rgb]0.00,0.00,0.00than in Models A. However, even when the baryonic density is fixed there are still cases of infinite confidence limit contours on the maps. Moreover, the results of the photometrical modelling correspond to systematically higher values of (in several cases Model B gives unsatisfactorily fits to observed rotation curve).
-
5.
\textcolor
[rgb]0.00,0.00,0.00 The comparison of Model A and B results shows that the halo mass estimates are consistent for each halo shapes in both cases, in contrast to and . Moreover, the untrustworthy models give stable mass estimations, due to the degeneracy between and along the line of constant halo mass. Therefore, we can estimate successfully the halo mass using the pure best-fitting method without any restrictions on the mass-to-light ratios.
-
6.
We tested the method sensitivity to the quality of the input kinematic data (extension and spatial resolution of the rotation curve). In our tests we modified the input data by analogy with the observation characteristics, that can make the data less detailed (the Hi stripping from the disc periphery, the depletion of cold gas in the inner kiloparsecs and poor spatial resolution \textcolor[rgb]0.00,0.00,0.00of data for distant galaxies). Our experiments show that, \textcolor[rgb]0.00,0.00,0.00unlike the halo masses, the estimates of and can vary significantly, even in response to small changes of the rotation curve extension. The degradation of the spatial resolution has \textcolor[rgb]0.00,0.00,0.00noticeable influence on the resulting parameters too. \textcolor[rgb]0.00,0.00,0.00All these effects persist even if the baryonic density is fixed, though become more modest. It could be essential if one tries to compare the halo \textcolor[rgb]0.00,0.00,0.00concentrations for nearby and distant galaxies using the data with the same angular resolution.
-
7.
For most of our maps the contour of confidence limit lies along the line of constant halo mass and is covered by the uncertainty of the halo mass of 15 per cent. \textcolor[rgb]0.00,0.00,0.00Therefore, taking into account the results of our experiments too, the halo mass \textcolor[rgb]0.00,0.00,0.00within optical radius is the most reliable parameter in the mass-modelling \textcolor[rgb]0.00,0.00,0.00even when the dark-to-luminous mass ratio is varied by several times in the inner region of a galaxy.
-
8.
There is an obvious degeneracy between parameters and for all types of halo profiles, which is evident both from the analysis of maps and from our tests of the method sensitivity \textcolor[rgb]0.00,0.00,0.00for Models A and B. \textcolor[rgb]0.00,0.00,0.00So, we are convinced that it can be impossible to obtain the truthful estimates of the halo concentrations from observations using the mass-modelling of rotation curves.
-
9.
Our research has shown the impossibility to come to valid conclusion about the universality of dark halo surface density using mass-modelling in spite of the high quality of input data. \textcolor[rgb]0.00,0.00,0.00Instead of it, there is a steeper artificial correlation related to the degeneration of and along the lines of constant halo masses.
Acknowledgements
We thank the anonymous referee for the valuable critical comments. We are thankful to Anatoly Zasov and Ivan Zolotukhin for valuable comments on the manuscript. We thank Erwin de Blok who kindly provided the Hi surface density profiles. We are grateful to Nataliya Zaitseva for the support. Development of the program package for analysis of maps has been supported by the project by Russian Foundation for Basic Research (RFBR) project No. 14-22-03006-ofi-m. The tests of the effects of rotation curve truncation and angular resolution on the reliability of the parameters of dark halo were made with the support of RFBR grants No. 15-32-21062-a and 15-52-15050. The analysis and classification of maps and model rotation curves was performed with aid of the Russian President’s grant No. MD-7355.2015.2. The surface photometry was done with the support of the Russian Science Foundation project 14-22-00041.
References
- Baggett et al. (1998) Baggett W. E., Baggett S. M., Anderson K. S. J., 1998, AJ, 116, 1626
- Barnes et al. (2004) Barnes E. I., Sellwood J. A., Kosowsky A., 2004, AJ, 128, 2724
- Bell et al. (2003) Bell E. F., McIntosh D. H., Katz N., Weinberg M. D., 2003, ApJS, 149, 289
- Bershady et al. (2010) Bershady M. A., Verheijen M. A. W., Swaters R. A., Andersen D. R., Westfall K. B., Martinsson T., 2010, ApJ, 716, 198
- Boyarsky et al. (2009) Boyarsky A., Ruchayskiy O., Iakubovskyi D., Maccio’ A. V., Malyshev D., 2009, preprint, (arXiv:0911.1774)
- Boyarsky et al. (2010) Boyarsky A., Neronov A., Ruchayskiy O., Tkachev I., 2010, Physical Review Letters, 104, 191301
- Burkert (1995) Burkert A., 1995, ApJ, 447, L25
- Burkert (2015) Burkert A., 2015, ApJ, 808, 158
- Caon et al. (1993) Caon N., Capaccioli M., D’Onofrio M., 1993, MNRAS, 265, 1013
- Cardone & Del Popolo (2012) Cardone V. F., Del Popolo A., 2012, MNRAS, 427, 3176
- Casertano (1983) Casertano S., 1983, MNRAS, 203, 735
- Chemin et al. (2006) Chemin L., Carignan C., Drouin N., Freeman K. C., 2006, AJ, 132, 2527
- Corbelli et al. (2014) Corbelli E., Thilker D., Zibetti S., Giovanardi C., Salucci P., 2014, A&A, 572, A23
- Del Popolo (2009) Del Popolo A., 2009, ApJ, 698, 2093
- Del Popolo et al. (2013) Del Popolo A., Cardone V. F., Belvedere G., 2013, MNRAS, 429, 1080
- Donato et al. (2009) Donato F., et al., 2009, MNRAS, 397, 1169
- Frank et al. (2015) Frank B. S., de Blok W. J. G., Walter F., Leroy A., Carignan C., 2015, preprint, (arXiv:1512.01367)
- Freeman (1970) Freeman K. C., 1970, ApJ, 160, 811
- Fuchs (2003) Fuchs B., 2003, Ap&SS, 284, 719
- Graham (2001) Graham A. W., 2001, MNRAS, 326, 543
- Karachentsev et al. (2016) Karachentsev I. D., Chengalur J. N., Tully R. B., Makarova L. N., Sharina M. E., Begum A., Rizzi L., 2016, Astronomische Nachrichten, 337, 306
- Karukes et al. (2015) Karukes E. V., Salucci P., Gentile G., 2015, A&A, 578, A13
- Kasparova (2012) Kasparova A. V., 2012, Astronomy Letters, 38, 63
- Katz et al. (2016) Katz H., Lelli F., McGaugh S. S., Di Cintio A., Brook C. B., Schombert J. M., 2016, preprint, (arXiv:1605.05971)
- Kormendy & Freeman (2004) Kormendy J., Freeman K. C., 2004, in Ryder S., Pisano D., Walker M., Freeman K., eds, IAU Symposium Vol. 220, Dark Matter in Galaxies. p. 377 (arXiv:astro-ph/0407321)
- Kormendy & Freeman (2016) Kormendy J., Freeman K. C., 2016, ApJ, 817, 84
- Kuzio de Naray & Kaufmann (2011) Kuzio de Naray R., Kaufmann T., 2011, MNRAS, 414, 3617
- Kuzio de Naray et al. (2008) Kuzio de Naray R., McGaugh S. S., de Blok W. J. G., 2008, ApJ, 676, 920
- Leroy et al. (2008) Leroy A. K., Walter F., Brinks E., Bigiel F., de Blok W. J. G., Madore B., Thornley M. D., 2008, AJ, 136, 2782
- Macciò et al. (2012) Macciò A. V., Stinson G., Brook C. B., Wadsley J., Couchman H. M. P., Shen S., Gibson B. K., Quinn T., 2012, ApJ, 744, L9
- McGaugh & Schombert (2014) McGaugh S. S., Schombert J. M., 2014, AJ, 148, 77
- McGaugh & Schombert (2015) McGaugh S. S., Schombert J. M., 2015, ApJ, 802, 18
- Meidt et al. (2014) Meidt S. E., et al., 2014, ApJ, 788, 144
- Milgrom (2009) Milgrom M., 2009, MNRAS, 398, 1023
- Napolitano et al. (2010) Napolitano N. R., Romanowsky A. J., Tortora C., 2010, MNRAS, 405, 2351
- Napolitano et al. (2014) Napolitano N. R., Pota V., Romanowsky A. J., Forbes D. A., Brodie J. P., Foster C., 2014, MNRAS, 439, 659
- Navarro et al. (1996) Navarro J. F., Frenk C. S., White S. D. M., 1996, ApJ, 462, 563
- Noordermeer (2008) Noordermeer E., 2008, MNRAS, 385, 1359
- Oh et al. (2011a) Oh S.-H., de Blok W. J. G., Brinks E., Walter F., Kennicutt Jr. R. C., 2011a, AJ, 141, 193
- Oh et al. (2011b) Oh S.-H., Brook C., Governato F., Brinks E., Mayer L., de Blok W. J. G., Brooks A., Walter F., 2011b, AJ, 142, 24
- Oh et al. (2015) Oh S.-H., et al., 2015, AJ, 149, 180
- Querejeta et al. (2015) Querejeta M., et al., 2015, ApJS, 219, 5
- Saburova (2011) Saburova A. S., 2011, Astronomy Reports, 55, 409
- Saburova & Del Popolo (2014) Saburova A., Del Popolo A., 2014, MNRAS, 445, 3512
- Saburova et al. (2015) Saburova A., Zasov A., Uklein R., Katkov I., 2015, MNRAS, 453, 1344
- Sersic (1968) Sersic J. L., 1968, Atlas de galaxias australes
- Sheth et al. (2010) Sheth K., et al., 2010, PASP, 122, 1397
- Sofue (2015) Sofue Y., 2015, PASJ, 67, 75
- Spano et al. (2008) Spano M., Marcelin M., Amram P., Carignan C., Epinat B., Hernandez O., 2008, MNRAS, 383, 297
- Swaters et al. (2003) Swaters R. A., Madore B. F., van den Bosch F. C., Balcells M., 2003, ApJ, 583, 732
- Tody (1986) Tody D., 1986, in Crawford D. L., ed., Society of Photo-Optical Instrumentation Engineers (SPIE) Conference Series Vol. 627, Instrumentation in astronomy VI. p. 733
- Zibetti et al. (2009) Zibetti S., Charlot S., Rix H.-W., 2009, MNRAS, 400, 1181
- Zwicky (1933) Zwicky F., 1933, Helvetica Physica Acta, 6, 110
- de Blok et al. (2001) de Blok W. J. G., McGaugh S. S., Rubin V. C., 2001, AJ, 122, 2396
- de Blok et al. (2003) de Blok W. J. G., Bosma A., McGaugh S., 2003, MNRAS, 340, 657
- de Blok et al. (2008) de Blok W. J. G., Walter F., Brinks E., Trachternach C., Oh S.-H., Kennicutt Jr. R. C., 2008, AJ, 136, 2648
- van Albada & Sancisi (1986) van Albada T. S., Sancisi R., 1986, Philosophical Transactions of the Royal Society of London Series A, 320, 447
- van den Bosch et al. (2000) van den Bosch F. C., Robertson B. E., Dalcanton J. J., de Blok W. J. G., 2000, AJ, 119, 1579
| NGC | |||||||||||||
| kpc | Mpc3 | kpc | M⊙ | ML⊙ | Mpc2 | ||||||||
| Model A | |||||||||||||
| 925 | 8.16 | 17.23 | 11.20 | 2.66 | 0.20 | — | 0.71 | 1.28 | |||||
| 2403 | 8.35 | 19.13 | 7.24 | 1.33 | 0.17 | 0.60 | 0.51 | 2.41 | |||||
| 2841 | 12.89 | 30.35 | 13.67 | 11.63 | 0.91 | 534.20 | 0.24 | 2.27 | |||||
| 2903 | 4.22 | 148.06 | 26.14 | 16.78 | 0.00 | 336.87 | 0.52 | 1.16 | |||||
| 2976 | 2.14 | 152.52 | 3.80 | 0.63 | 0.16 | — | 0.88 | 1.03 | |||||
| 3031 | 5.49 | 74.35 | 7.61 | 3.55 | 0.72 | 233.74 | 2.60 | 1.92 | |||||
| 3198 | 4.40 | 95.19 | 13.38 | 6.64 | 0.09 | 2.45 | 0.45 | 1.04 | |||||
| 3521 | 2.77 | 467.90 | 9.35 | 9.09 | 0.01 | 288.27 | 0.18 | 0.98 | |||||
| 3621 | 24.43 | 3.91 | 10.44 | 1.28 | 0.70 | — | 0.80 | 4.78 | |||||
| 4736 | 1.72 | 210.55 | 5.30 | 0.89 | 0.35 | 77.17 | 1.12 | 1.83 | |||||
| 5055 | 13.10 | 12.64 | 13.89 | 5.08 | 0.33 | 402.21 | 0.53 | 1.84 | |||||
| 6946 | 3.92 | 196.07 | 11.88 | 9.66 | 0.01 | 19.35 | 0.83 | 1.13 | |||||
| 7331 | 100.00 | 2.43 | 25.49 | 13.65 | 2.61 | 767.44 | 0.43 | 2.81 | |||||
| 7793 | 2.89 | 96.80 | 5.24 | 1.02 | 0.30 | 0.00 | 2.32 | 1.23 | |||||
| Model B | |||||||||||||
| 925 | 11.63 | 10.14 | 11.20 | 2.36 | 0.54 | — | 0.87 | 1.44 | |||||
| 2403 | 9.13 | 16.36 | 7.24 | 1.23 | 0.60 | 0.60 | 0.61 | 2.61 | |||||
| 2841 | 4.33 | 364.20 | 13.67 | 25.17 | 0.45 | 33.85 | 2.59 | 1.05 | |||||
| 2903 | 83.05 | 1.83 | 26.14 | 10.48 | 0.60 | 13.56 | 1.91 | 1.86 | |||||
| 2976 | 110.00 | 29.50 | 3.80 | 0.66 | 0.45 | — | 1.64 | 0.99 | |||||
| 3031 | 3.29 | 220.01 | 7.61 | 4.72 | 0.60 | 46.85 | 2.89 | 1.44 | |||||
| 3198 | 6.14 | 41.12 | 13.38 | 5.32 | 0.45 | 5.81 | 0.77 | 1.3 | |||||
| 3521 | 6.12 | 62.31 | 9.35 | 4.83 | 0.45 | 49.42 | 0.45 | 1.85 | |||||
| 3621 | 15.49 | 6.96 | 10.44 | 1.78 | 0.60 | — | 1.55 | 3.45 | |||||
| 4736 | 2.87 | 53.67 | 5.30 | 0.57 | 0.45 | 25.09 | 1.24 | 2.88 | |||||
| 5055 | 12.92 | 12.93 | 13.89 | 5.12 | 0.33 | 88.34 | 0.53 | 1.83 | |||||
| 6946 | 8.84 | 31.20 | 11.88 | 5.91 | 0.30 | 23.26 | 0.86 | 1.85 | |||||
| 7331 | 5.15 | 90.34 | 25.49 | 15.71 | 1.62 | 546.76 | 1.15 | 2.44 | |||||
| 7793 | 5.11 | 35.45 | 5.24 | 0.80 | 0.45 | 19.55 | 10.20 | 1.58 | |||||
| NGC | |||||||||||||
| kpc | Mpc3 | kpc | M⊙ | ML⊙ | Mpc2 | ||||||||
| Model A | |||||||||||||
| 925 | 5.60 | 13.47 | 11.20 | 2.65 | 0.28 | — | 0.75 | 1.28 | |||||
| 2403 | 3.95 | 26.08 | 7.24 | 1.54 | 0.14 | 0.68 | 0.48 | 2.09 | |||||
| 2841 | 0.14 | 71044.20 | 13.67 | 22.00 | 0.59 | 46.87 | 0.22 | 1.2 | |||||
| 2903 | 0.12 | 36571.68 | 26.14 | 16.82 | 0.14 | 142.57 | 0.41 | 1.16 | |||||
| 2976 | 1.61 | 104.00 | 3.80 | 0.65 | 0.22 | — | 0.88 | 1.01 | |||||
| 3031 | 3.93 | 48.57 | 7.61 | 3.11 | 0.81 | 181.63 | 2.81 | 2.19 | |||||
| 3198 | 2.65 | 53.06 | 13.38 | 4.55 | 0.61 | 0.03 | 0.55 | 1.52 | |||||
| 3521 | 0.27 | 8307.36 | 9.35 | 7.00 | 0.28 | 0.00 | 0.42 | 1.28 | |||||
| 3621 | 16.22 | 3.32 | 10.44 | 1.28 | 0.70 | — | 0.79 | 4.79 | |||||
| 4736 | 1.03 | 130.20 | 5.30 | 0.67 | 0.42 | 42.17 | 1.37 | 2.42 | |||||
| 5055 | 0.34 | 5007.36 | 13.89 | 9.68 | 0.12 | 89.86 | 0.58 | 0.97 | |||||
| 6946 | 3.71 | 53.90 | 11.88 | 6.69 | 0.25 | 17.27 | 0.80 | 1.63 | |||||
| 7331 | 1.14 | 656.70 | 25.49 | 25.51 | 0.00 | 473.88 | 0.37 | 1.5 | |||||
| 7793 | 1.78 | 84.14 | 5.24 | 1.01 | 0.31 | 0.00 | 2.67 | 1.24 | |||||
| Model B | |||||||||||||
| 925 | 7.54 | 8.82 | 11.20 | 2.41 | 0.54 | — | 0.85 | 1.41 | |||||
| 2403 | 5.41 | 15.56 | 7.24 | 1.27 | 0.60 | 0.60 | 0.61 | 2.54 | |||||
| 2841 | 0.22 | 26556.87 | 13.67 | 21.82 | 0.59 | 25.45 | 0.22 | 1.21 | |||||
| 2903 | 45.60 | 1.70 | 26.14 | 10.68 | 0.60 | 13.56 | 1.90 | 1.83 | |||||
| 2976 | 100.00 | 29.96 | 3.80 | 0.69 | 0.45 | — | 1.63 | 0.95 | |||||
| 3031 | 1.45 | 314.56 | 7.61 | 4.66 | 0.60 | 46.85 | 3.06 | 1.46 | |||||
| 3198 | 2.88 | 45.63 | 13.38 | 4.51 | 0.60 | 5.81 | 0.88 | 1.54 | |||||
| 3521 | 2.65 | 87.46 | 9.35 | 4.56 | 0.45 | 49.42 | 0.54 | 1.96 | |||||
| 3621 | 9.23 | 6.58 | 10.44 | 1.85 | 0.60 | — | 1.53 | 3.31 | |||||
| 4736 | 1.64 | 49.99 | 5.30 | 0.54 | 0.45 | 25.09 | 1.38 | 3.01 | |||||
| 5055 | 5.96 | 17.46 | 13.89 | 5.41 | 0.31 | 89.75 | 0.69 | 1.73 | |||||
| 6946 | 5.31 | 28.99 | 11.88 | 5.93 | 0.30 | 23.26 | 0.83 | 1.84 | |||||
| 7331 | 1.78 | 190.95 | 25.49 | 17.37 | 1.62 | 545.77 | 0.69 | 2.21 | |||||
| 7793 | 3.40 | 29.95 | 5.24 | 0.81 | 0.45 | 19.55 | 10.18 | 1.55 | |||||
| NGC | |||||||||||||
| kpc | Mpc3 | kpc | M⊙ | ML⊙ | Mpc2 | ||||||||
| Model A | |||||||||||||
| 925 | 100.00 | 0.41 | 11.20 | 2.79 | 0.00 | — | 1.41 | 1.22 | |||||
| 2403 | 17.43 | 5.02 | 7.24 | 1.80 | 0.11 | 0.41 | 0.51 | 1.79 | |||||
| 2841 | 17.03 | 18.98 | 13.67 | 16.95 | 0.67 | 414.64 | 0.20 | 1.56 | |||||
| 2903 | 4.69 | 137.03 | 26.14 | 18.39 | 0.00 | 184.36 | 0.42 | 1.06 | |||||
| 2976 | 100.00 | 0.99 | 3.80 | 0.85 | 0.00 | 0.00 | 2.44 | 0.77 | |||||
| 3031 | 9.49 | 27.24 | 7.61 | 4.20 | 0.69 | 137.73 | 2.87 | 1.62 | |||||
| 3198 | 15.77 | 6.11 | 13.38 | 4.67 | 0.57 | — | 0.73 | 1.48 | |||||
| 3521 | 2.85 | 522.54 | 9.35 | 10.48 | 0.01 | 0.00 | 0.19 | 0.85 | |||||
| 3621 | 100.00 | 0.34 | 10.44 | 2.06 | 0.56 | — | 0.79 | 2.98 | |||||
| 4736 | 1.89 | 205.32 | 5.30 | 1.04 | 0.33 | 63.77 | 1.24 | 1.57 | |||||
| 5055 | 15.27 | 10.19 | 13.89 | 7.77 | 0.20 | 384.54 | 0.56 | 1.21 | |||||
| 6946 | 29.76 | 3.97 | 11.88 | 6.64 | 0.26 | 10.35 | 0.89 | 1.64 | |||||
| 7331 | 11.97 | 23.69 | 25.49 | 23.47 | 0.00 | 599.59 | 0.46 | 1.63 | |||||
| 7793 | 9.59 | 13.56 | 5.24 | 1.24 | 0.10 | 0.00 | 3.51 | 1.01 | |||||
| Model B | |||||||||||||
| 925 | 100.00 | 0.30 | 11.20 | 2.04 | 0.54 | — | 2.96 | 1.67 | |||||
| 2403 | 27.83 | 2.31 | 7.24 | 1.55 | 0.45 | 0.60 | 0.57 | 2.07 | |||||
| 2841 | 7.30 | 125.70 | 13.67 | 24.74 | 0.45 | 33.85 | 0.85 | 1.07 | |||||
| 2903 | 6.94 | 42.74 | 26.14 | 13.85 | 0.30 | 13.56 | 2.16 | 1.41 | |||||
| 2976 | 100.00 | 0.29 | 3.80 | 0.25 | 0.45 | — | 4.68 | 2.66 | |||||
| 3031 | 6.69 | 56.36 | 7.61 | 4.82 | 0.60 | 37.45 | 2.91 | 1.41 | |||||
| 3198 | 17.46 | 4.98 | 13.38 | 4.49 | 0.60 | 5.81 | 1.34 | 1.54 | |||||
| 3521 | 15.41 | 10.27 | 9.35 | 4.56 | 0.45 | 49.42 | 0.52 | 1.96 | |||||
| 3621 | 100.00 | 0.34 | 10.44 | 2.05 | 0.56 | — | 0.79 | 2.99 | |||||
| 4736 | 7.80 | 8.05 | 5.30 | 0.55 | 0.45 | 25.09 | 1.47 | 2.99 | |||||
| 5055 | 31.76 | 2.40 | 13.89 | 5.65 | 0.30 | 77.15 | 0.68 | 1.66 | |||||
| 6946 | 100.00 | 0.77 | 11.88 | 5.84 | 0.30 | 23.26 | 1.21 | 1.87 | |||||
| 7331 | 12.46 | 16.02 | 25.49 | 17.19 | 1.62 | 546.76 | 0.79 | 2.23 | |||||
| 7793 | 100.00 | 0.44 | 5.24 | 0.70 | 0.45 | 19.55 | 14.61 | 1.79 | |||||