Disorder-sensitive pump-probe measurements on films
Abstract
We find an unambiguous relationship between disorder-driven features in the temperature dependence of the resistance and the behavior, as functions of the temperature, of the parameters necessary to describe some of the relaxation processes in the photoinduced differential time-resolved reflectivity of three samples of . The latter, sharing the same content, have been fabricated and annealed ad-hoc in order to differ only for the degree of disorder, mainly related to oxygen content and location, and, consequently, for the temperature dependence of the resistance: two of them present a minimum in the resistance and behave as a superconductor and as a metal, respectively, the third behaves as an insulator. The systematic coherence between the resistance and the relaxation parameters behaviors in temperature for all three samples is absolutely remarkable and shows that pump-probe measurements can be extremely sensitive to disorder as it drives the emergence of new excitations and of the related relaxation channels as in this paradigmatic case.
I Introduction
One of the most puzzling peculiarities of superconductivity in electron-doped cuprates is its relationship to disorder and, in particular, to oxygen disorder Armitage et al. (2010); Fournier (2015). Superconductivity occurs in a narrow range of cerium doping and requires an additional oxygen reduction treatment at the end of the fabrication process Onose et al. (1999); Naito et al. (2002); Krockenberger et al. (2008); Guarino et al. (2013). The amount of oxygen removed during this ultimate annealing is very small Hirsch (1995), while the treatment has so strong influence on the electrical and magnetic properties of the samples Fournier et al. (2000); Sekitani et al. (2003); Dagan et al. (2005); Gauthier et al. (2007), which change from antiferromagnetic insulators to superconductors Richard et al. (2005); Horio et al. (2016), to suppose that also a redistribution among all possible oxygen sites could occur as well as some other structural changes Riou et al. (2004); Kang et al. (2007); Guarino et al. (2012). The true effects of this thermal treatment and its connection to superconductivity have been the object of intensive experimental studies, but they are still quite far from being understood and constitute one of the most intriguing challenges in the field Guarino et al. (2012); Krockenberger et al. (2013).
Different microscopic mechanisms have been conjectured. On one hand, if oxygen vacancies are created in the planes and/or in the charge-reservoir layers, the AF correlation length will decrease (antiferromagnetic order suppression with respect to as-grown samples fabricated in oxygen rich atmosphere) as confirmed by angle-resolved photoemission spectroscopy on differently oxygenated single crystals Song et al. (2012). On the other hand, if non-stoichiometric oxygens at the apical positions are removed, the disorder will be reduced Guarino et al. (2012): in optimally reduced crystals, electron localization and pair breaking effects are reduced with respect to as-grown and over-reduced samples Onose et al. (2004). Moreover, the evidence of a structural restructuring involving copper ion migration Kang et al. (2007) and the change of the c lattice parameter Guarino et al. (2012) have been reported among the consequences of the high-temperature oxygen-reduction treatment inducing superconductivity.
One more ingredient in the puzzle is connected to the extreme conditions in which the annealing procedure necessary to induce superconductivity has to be carried out Kim and Gaskell (1993). Accordingly, such a treatment inevitably becomes itself one of the main sources of disorder in the system. Such a disorder (mainly related to oxygen vacancies and non-stoichiometric occupations) largely affect the spectrum of the excitations in the system and is held responsible for the localization effects observed in the in-plane transport properties Barone et al. (2009, 2011). In particular, it was reported that the temperature at which the in-plane resistivity features a minimum in metallic (low-temperature reduced) and superconducting (high-temperature reduced) samples can be decreased by repeated low-temperature annealing procedures in oxygen deficient atmosphere Guarino et al. (2012). Such a behavior can be easily explained in terms of a reduction of the degree of positional disorder of the in-plane oxygen vacancies at each cycle of such a treatment with a consequent reduction of their (or of any related scattering center) de-phasing capabilities. Along this line, the high-temperature treatments (necessary to induce superconductivity) could be instead held responsible for the removal of non-stoichiometric oxygens at the apical positions and for the related change of the lattice parameter in the c direction.
Guided by the idea that defects not only affect the spectrum of excitations of the pristine system, but they can even induce/foster new excitations in the system in connection to their degree of positional disorder, we have performed time-resolved reflectivity (TRR) pump-probe experiments on three films of with substantially different in-plane transport properties induced by different fabrication procedures and/or ex-situ thermal treatments with respect to oxygen content and disorder. Our choice of the TRR technique was dictated by the well-proven capability of pump-probe techniques to reveal the presence of various kinds of excitations in a system identifying their different relaxation dynamics Liu et al. (1993); Okamoto et al. (2010); Bonavolontà et al. (2013, 2014); Cilento et al. (2014); Novelli et al. (2014); Li et al. (2015); Dal Conte et al. (2015); Madan et al. (2015); Hinton et al. (2016); Vishik et al. (2016); Giannetti et al. (2016). A new excitation manifested as additional relaxation channel proving that it is possible to turn a TRR measurement, although indirectly, into a disorder-sensitive probe. Then, comparing the features in temperature of the in-plane resistivity of the three samples to the features in temperature of the additional relaxation processes parametrization, we have managed to prove our initial hypothesis.
It is necessary to clarify how we have identified the new excitations and the related additional relaxation channels: similar TRR pump-probe experiments have already been performed on a optimally-reduced single crystal of the same material with a value of cerium doping equal to Hinton et al. (2013). In such measurements, at temperatures above the superconducting critical one, a single relaxation channel has been identified and assigned to those excitations responsible for the so-called pseudogap phenomenology. Our measurements reproduce faithfully such results, but also evidence the existence of a second relaxation channel whose parametrization unequivocally shows features in temperature that can be strictly related to those reported by the in-plane resistivity of our samples.
Given the main objective to identify new excitations and additional relaxation channels to be strictly and unambiguously connected to oxygen disorder, we have chosen the system to study and the conditions under which performing this study so to have a well defined reference and, consequently, to be in the best possible conditions to appreciate similarities and differences. This is the obvious reason why we have not only chosen a system where TRR pump-probe experiments have already been performed Hinton et al. (2013), without showing any additional channel with respect to the canonical ones (pseudogap and superconductivity), but we also used the same central wavelength () and working pump fluence (). This allowed us first to benchmark our results by reproducing those already obtained in Ref. Hinton et al., 2013 as regards both the pseudogap and the superconducting channels (the presence of the latter is a trademark of quality in itself for such systems). Second, in these conditions, if any different behavior among our films and the single-crystal sample used in Ref. Hinton et al., 2013 would come out from our measurements, it can only be assigned to the main difference between them: the disorder caused by the different oxygen content and location induced in the fabrication process.
II Theoretical background
If a system sustains a collective excitation of any kind, the Raman interaction describes the coupling of an applied electric field (e.g., the one carried by the laser pump pulse) to such a collective mode Merlin (1997): , where is the mean value of the related ladder operator , is the displacement operator, is the mean value before the application of the field and is the dielectric tensor of the system. In principle, the dielectric tensor depends on all collective excitations of the system and when one of them gets excited (i.e., when ) also gets modified: . Then, the reflectivity measured by a second time-delayed pulse (e.g., the laser probe pulse) is different from the reflectivity measured at equilibrium (i.e., before the application of the pump pulse) : , where and are the incident and reflected directions. This mechanism is known as impulsive stimulated Raman scattering (ISRS) Yan et al. (1985) and turns very efficiently TRR measurements into an invaluable tool to discover collective excitations: . Unfortunately, it is not possible to identify unambiguously the nature of the mode (spin, charge, orbital, …) in this way, but it is possible to study the properties of the excitations by analyzing the features of the corresponding relaxation processes (lifetime of the mode, type and strength of its damping, …). In fact, within the linear response regime (i.e., when where ) and for pulses much shorter than the characteristic response time of the mode (i.e., when ), the change in reflectivity is proportional to the time-dependent impulsive response function of the excited mode: . Accordingly, in presence of one or more critically damped modes (i.e., when ), the differential transient reflectivity has the expression:
| (1) |
Such a behavior, at temperatures above the superconducting critical one, is exactly what has been found in Ref. Hinton et al., 2013 for a single mode that they assigned to the excitations responsible for the pseudogap phenomenology ( and ). Here, we search for a second mode of this very same kind whose and present features that can be related to those of the in-plane resistivity of our three samples.
III Resistance measurements
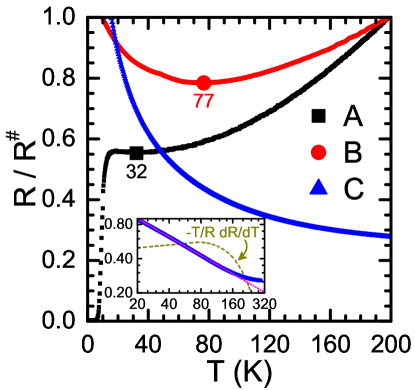
DC sputtering technique was optimized to grow films on (100) (STO) substrates by using a single stoichiometric target as a sputtering source in an on-axis configuration with the substrate Guarino et al. (2013). The films were grown in pure argon () (sample B) or in a mixed atmosphere of and Oxygen (), with ratio , at a total pressure of 1.7 mbar (sample C) and heater temperature of about 850°C. Part of the sample B was ex-situ thermally treated in flowing Argon at a temperature of 900°C to obtain the sample A, that shows a superconducting transition at temperature (at 50% ) with . The morphology, phase composition, and purity of the grown samples were inspected by high-resolution x-ray diffraction and scanning electron microscopy combined with wavelength dispersive spectroscopy Guarino et al. (2012, 2013): well oriented films were obtained without spurious phases and a Cerium content of . The electrical transport properties were investigated by using the standard four probe technique in a Cryogenic variable-temperature system. The only difference among the three films, which have been fabricated ad hoc, is then the oxygen content and location that lead to completely different temperature dependences of the in-plane resistivity [see Fig. 1]: sample A (fabrication in oxygen-deficient atmosphere, high-temperature oxygen-reduction treatment) is a superconductor (), sample B (fabrication in oxygen-deficient atmosphere, no ex-situ thermal treatment) is a metal, and sample C (fabrication in oxygen-rich atmosphere, no ex-situ thermal treatment) is an insulator. Samples A and B feature a minimum in the resistivity at temperatures and , respectively. The presence of defects in the system is widely recognized as responsible for the minimum although the effective type of defects and the scattering mechanism are still very much debated Fournier et al. (2000); Sekitani et al. (2003); Dagan et al. (2005); Barone et al. (2009).
IV Pump-probe measurements
The pump-probe experimental setup is based on a mode-locked Ti:sapphire (Ti:Sa) laser, delivering pulses at a central wavelength of (photon energy of ), at repetition rate. The laser beam is split into a p-polarized pump beam, chopped at , and a s-polarized probe beam Bonavolontà et al. (2013). The pump fluence on the sample ranges from to , while the probe fluence is fixed at . The sample is located into an optical cryostat, equipped with a cold finger and using a temperature controlled liquid helium continuous flow. The measurements were performed in a temperature range between and . For each temperature, the pump-probe signal is averaged over several fast-scan sweeps.
 |
 |
 |
 |
 |
 |
 |
 |
 |
 |
 |
 |
IV.1 Thermo-modulation
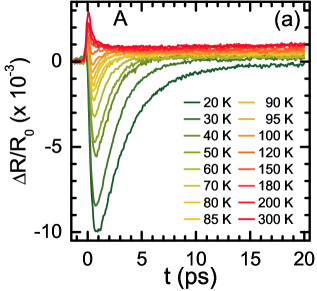
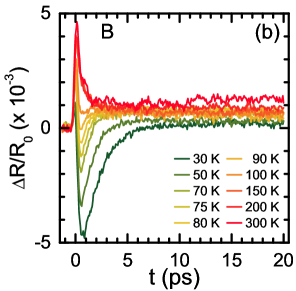
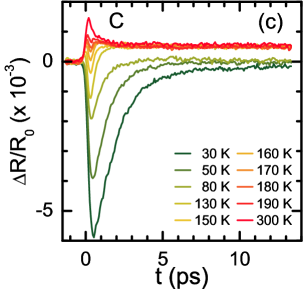
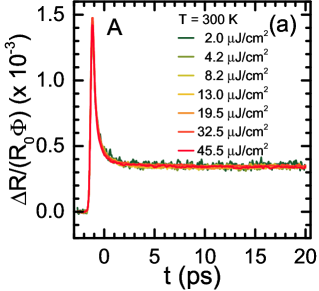
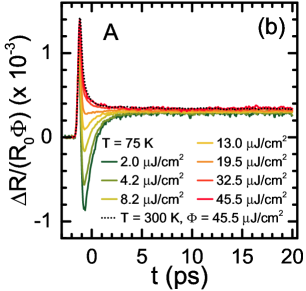
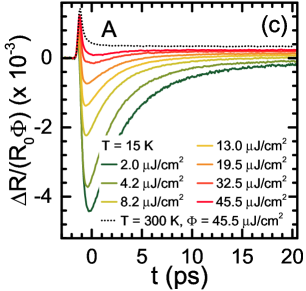
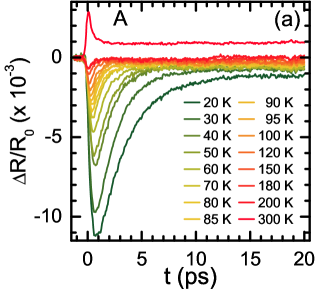
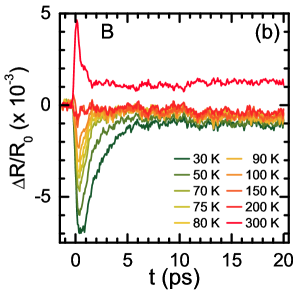
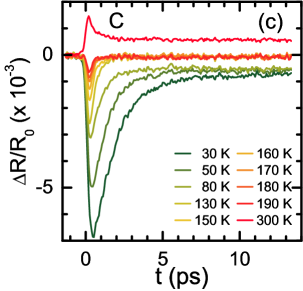
The normalized photoinduced transient reflectivity of the three samples has been measured for various experimental conditions and is reported in Fig. 2. For all three samples, the most evident feature is the presence of at least two components in the signal with opposite signs and different temperature dependences leading to an overall change of the amplitude from positive to negative on decreasing the temperature. It is worth noting that the positive component survives also at the lowest temperatures as it can be clearly seen at the shortest times for all three samples. At the highest measured temperature , the signal is perfectly proportional to the probe fluence [see Fig. 3 (a)] as one expects if only the thermo-modulation Brorson et al. (1990) component of the signal would be present. We have exploited this occurrence to extract the other components of the signal and focus our analysis on them. In particular, we have subtracted the signal measured at the temperature from the signals measured at all other temperatures, assuming that the amplitude of the thermo-modulation component is independent of temperature. This is definitely true at almost all temperatures in the measured range as clearly shown by the almost perfect coincidence between the signals in Fig. 3 (b) at and for the maximum value of the fluence, , but it will introduce a systematic error in our analysis at the lowest temperatures [see Fig. 3 (c)]. In fact, it is evident that when the temperature gets smaller and smaller and closer to the range where the superconductivity manifests, the assumption that the thermo-modulation component of the signal is independent of temperature is less and less robust and that higher values of fluence would be necessary to eliminate the other contributions. In Fig. 4, the curves resulting from the subtraction of the one at the temperature are reported to show the absence of any further component forcing a change of sign and concavity at the shortest times.
IV.2 Scaling analysis
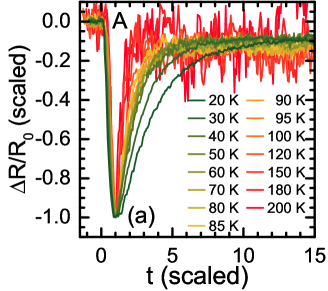
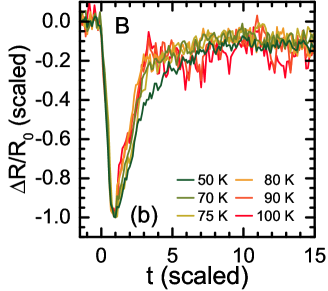
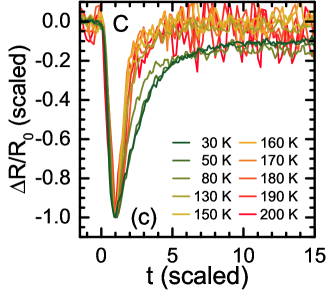
Now, a scaling analysis of the data is necessary in order to verify the assumption that the differential transient reflectivity can be fitted and analyzed using expression (1). Such an expression implies that the curves at all temperatures collapse one on top of the others if the data are scaled, temperature by temperature, by the coordinates of the related minimum. Actually, the scaling holds for both the linear decrease (at the shortest times) and the exponential increase (at longer times) only if just one relaxation channel is present, as in Ref. Hinton et al., 2013, while the presence of more than one relaxation channel of the same type implied by (1) is signaled by a deviation from the scaling in the exponential increase. The actual robustness of the scaling at the shortest times [see Fig. 5] clearly signals that all relaxation channels are related to critically damped modes and that Eq. (1) holds. On the other hand, the spreading of the curves at longer times clearly signals that more than one relaxation channel is present in the system, very much differently from what found in Ref. Hinton et al., 2013. This can be easily understood in terms of the significative difference in the relevance of the oxygen disorder between the two sets of samples.
 |
 |
 |
 |
IV.3 Relaxation channels analysis
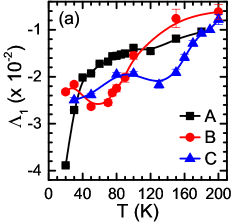
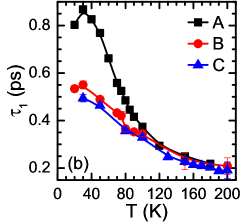
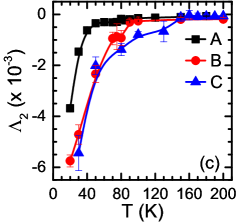
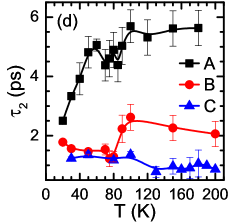
Given the positive outcome of the scaling analysis for all three samples (see Fig. 5), we can confidently use Eq. (1) to analyze the data and determine the minimal number of relaxation channels necessary to fit them. This preliminary analysis shows that just two channels are active in all three samples and that only four parameters ( and ) are necessary to fit the data at all analyzed temperatures. In Fig. 6, the temperature dependence of these four parameters is reported and compared among the three different samples. The behavior of and resemble the one found in Ref. Hinton et al., 2013. In particular, we have , which suggests that the excitations responsible for this relaxation channel are related to a hidden order establishing only at . This also suggests that these excitations are the same quasi-particles lacking global coherence often invoked to explain the opening of a pseudogap in the electronic density of states, reported in many different experiments, through a dynamic exchange with ordinary electrons. The first and most remarkable difference with respect to what found in Hinton et al. (2013) is the change of behavior, on decreasing temperature, in both and around the temperature , where the resistance features a minimum [see Fig. 1 (a)]: changes suddenly its slope and starts decreasing. The presence of such a minimum in the resistance is due to disorder and it is evident that these pump-probe measurements are somehow sensitive to this latter. In particular, decreasing the temperature, starting right at , the amplitude of the second contribution becomes significant [see Fig. 6 (c)], marking the occurence of a second overdamped mode and, correspondingly, of a second relaxation channel presumably directly connected to disorder. In order to prove the hypothesis that this second relaxation channel is strictly connected to disorder, we analyze the behavior of the four fitting parameters in the other two samples with completely different transport properties.
In sample B, in a region of temperature close to , changes its slope, although less suddenly than at , and changes functional dependence on temperature: for temperatures above and for temperatures below . What is even more worth noticing is that both becomes significant and jumps from one to another almost constant value right at . Such a jump is present in too and, at the lowest temperatures, assumes almost the same value in both samples. In sample C, the insulating behavior dominates the resistive response and no evident minimum is present. Again, becomes significant only below a certain temperature, , and then shows a behavior remarkably similar to the one reported for . does not show any noticeable change at that temperature, except for a very small jump in the opposite direction with respect to those observed in the other two samples, and assumes almost the same value reported for the other two samples at low enough temperatures, signaling a kind of universality in the dynamics of this second excitation. As a matter of fact, it is just the coincidence in the behavior and range of values of and in the values at low temperatures reported for across all three samples, although these latter are so different in the resistive response, to be very remarkable and suggestive of a common behavior for the slowest relaxation channel.
If we analyze the behavior of and , we can recognize a change in slope in around , but the overall behavior of exactly resembles the one found for although shifted quite higher in temperature. Instead, the behavior and the values reported for follows very closely those reported for . The qualitative and quantitative coincidence in and across all three samples can be considered as a strong indication that there exists a strict relationship between the (antiferromagnetic) order leading to the insulating behavior in sample C and both the pseudogap phenomenon and the fastest relaxation channel in all three samples.
Once the behavior of and of showed the existence of a kind of critical temperature, , also for sample C, we have searched signatures of it also in the behavior of the resistance as a function of the temperature. Plotting the resistance of sample C on a log-log scale [see inset in Fig. 1(a)] and the slope of the log-log tangent to the curve, , in proximity of the temperature found analyzing the optical data, there appears a change of slope in the resistivity from an almost constant at low temperatures to temperature dependent smaller negative values at higher temperatures. It is worth reminding that is what is predicted for an interacting disordered 3D semiconductor by weak localization Lee and Ramakrishnan (1985). This is the most remarkable confirmation we could seek of the capability of pump-probe measurements to identify excitations relevant to transport and of the extreme sensitivity of such measurements.
Starting from a picture where the perfect antiferromagnetic in-plane long-range spin order in the - planes is weakened (down to become just short-range) by oxygen vacancies, it is possible to conceive a unified scenario for both types of excitations revealed by the pump-probe TRR measurements. The first kind of excitations (those described by and ) could be assigned to the in-plane magnetic fluctuations reminiscent of the antiferromagnetic order in the - planes and usually related to the pseudogap phenomenon. Instead, the second kind of excitations (those described by and ) could be assigned to magnetic fluctuations of the out-of-plane components of the spins induced by the vacancies in the plane. In fact, the absence of an breaks the exchange link between the two spins residing on the two nearest-neighbor ions. This allows them to acquire out-of-plane components with a specific relative order between them and with respect to all other couples of out-of-plane spin components generated by vacancies. This happens within a distance dictated by the residual correlation length of the underlying in-plane antiferromagnetic order. The temperature signals the predominance of disorder over all other source of scattering. The fact that can be decreased by repeated annealing procedures in deficient atmosphere can be then explained as such annealing procedures allow the vacancies to maximize their distances minimizing their pairwise Coulomb potential. Then, the vacancies somehow order (or, at least, decrease their degree of positional disorder) with an overall reduction of their de-phasing capability and, therefore, relevance as scattering sources. According to this, the signals measured for samples obtained following different procedures of fabrication and annealing with respect to the content and positional disorder is different, but coherent as we found.
V Summary
In summary, by carefully analyzing the resistance and the TRR of three ad hoc fabricated films of differing only for the degree of disorder (mainly related to oxygen vacancies and non-stoichiometric occupations), we have established the existence of an excitation and of the related critically damped relaxation channel. The parametrization of this latter presents features in temperature connected one to one to the transport properties of the three samples, which are dictated by the presence of defects. This clearly demonstrates that TRR measurements can be extremely sensitive to disorder when this latter foster the emergence of new excitations in the system. A possible scenario for the assignment of the excitations revealed by the TRR measurements has been proposed that connects the antiferromagnetic in-plane spin order, its canonical fluctuations inducing a pseudogap, its weakening through the insertion of vacancies and the effect of the positional disorder of these latter (controlled through well-defined annealing procedures) on the appearence and position of a minimum in the resistance as a function of temperature and the excitations of out-of-plane magnetic fluctuations. We are quite confident that the collected data and the unambiguous experimental evidence of a connection between the two kind of measurements (optical spectroscopy and transport), but also the given possible scenario, will foster further experiments and investigations.
Acknowledgements.
A.A. thanks D. Fausti and C. Giannetti for many insightful discussions. A.G. and A.L. acknowledge financial support from PON Ricerca e Competitività 2007-2013 under grant agreement PON NAFASSY, PONa3_00007.References
- Armitage et al. (2010) N. P. Armitage, P. Fournier, and R. L. Greene, Rev. Mod. Phys. 82, 2421 (2010).
- Fournier (2015) P. Fournier, Physica C 514, 314 (2015).
- Onose et al. (1999) Y. Onose, Y. Taguchi, T. Ishikawa, S. Shinomori, K. Ishizaka, and Y. Tokura, Phys. Rev. Lett. 82, 5120 (1999).
- Naito et al. (2002) M. Naito, A. Tsukada, T. Greibe, and H. Sato, “Phase control in la-214 epitaxial thin films,” (2002).
- Krockenberger et al. (2008) Y. Krockenberger, J. Kurian, A. Winkler, A. Tsukada, M. Naito, and L. Alff, Phys. Rev. B 77, 060505 (2008).
- Guarino et al. (2013) A. Guarino, G. Patimo, A. Vecchione, T. Di Luccio, and A. Nigro, Physica C 495, 146 (2013).
- Hirsch (1995) J. Hirsch, Physica C 243, 319 (1995).
- Fournier et al. (2000) P. Fournier, J. Higgins, H. Balci, E. Maiser, C. J. Lobb, and R. L. Greene, Phys. Rev. B 62, R11993 (2000).
- Sekitani et al. (2003) T. Sekitani, M. Naito, and N. Miura, Phys. Rev. B 67, 174503 (2003).
- Dagan et al. (2005) Y. Dagan, M. C. Barr, W. M. Fisher, R. Beck, T. Dhakal, A. Biswas, and R. L. Greene, Phys. Rev. Lett. 94, 057005 (2005).
- Gauthier et al. (2007) J. Gauthier, S. Gagné, J. Renaud, M.-E. Gosselin, P. Fournier, and P. Richard, Phys. Rev. B 75, 024424 (2007).
- Richard et al. (2005) P. Richard, M. Poirier, S. Jandl, and P. Fournier, Phys. Rev. B 72, 184514 (2005).
- Horio et al. (2016) M. Horio, T. Adachi, Y. Mori, A. Takahashi, T. Yoshida, H. Suzuki, L. C. C. Ambolode II, K. Okazaki, K. Ono, H. Kumigashira, H. Anzai, M. Arita, H. Namatame, M. Taniguchi, D. Ootsuki, K. Sawada, M. Takahashi, T. Mizokawa, Y. Koike, and A. Fujimori, Nat Commun 7 (2016).
- Riou et al. (2004) G. Riou, P. Richard, S. Jandl, M. Poirier, P. Fournier, V. Nekvasil, S. N. Barilo, and L. A. Kurnevich, Phys. Rev. B 69, 024511 (2004).
- Kang et al. (2007) H. J. Kang, P. Dai, B. J. Campbell, P. J. Chupas, S. Rosenkranz, P. L. Lee, Q. Huang, S. Li, S. Komiya, and Y. Ando, Nat. Mater. 6, 224 (2007).
- Guarino et al. (2012) A. Guarino, R. Fittipaldi, A. Romano, A. Vecchione, and A. Nigro, Thin Solid Films 524, 282 (2012).
- Krockenberger et al. (2013) Y. Krockenberger, H. Irie, O. Matsumoto, K. Yamagami, M. Mitsuhashi, A. Tsukada, M. Naito, and H. Yamamoto, Scientific Reports 3, 2235 (2013).
- Song et al. (2012) D. Song, S. R. Park, C. Kim, Y. Kim, C. Leem, S. Choi, W. Jung, Y. Koh, G. Han, Y. Yoshida, H. Eisaki, D. H. Lu, Z.-X. Shen, and C. Kim, Phys. Rev. B 86, 144520 (2012).
- Onose et al. (2004) Y. Onose, Y. Taguchi, K. Ishizaka, and Y. Tokura, Phys. Rev. B 69, 024504 (2004).
- Kim and Gaskell (1993) J. Kim and D. Gaskell, Physica C: Superconductivity 209, 381 (1993).
- Barone et al. (2009) C. Barone, A. Guarino, A. Nigro, A. Romano, and S. Pagano, Phys. Rev. B 80, 224405 (2009).
- Barone et al. (2011) C. Barone, S. Pagano, A. Guarino, A. Nigro, and A. Vecchione, Superconductor Science and Technology 24, 085003 (2011).
- Liu et al. (1993) Y. Liu, J. F. Whitaker, C. Uher, J. Peng, Z. Y. Li, and R. L. Greene, Applied Physics Letters 63, 979 (1993).
- Okamoto et al. (2010) H. Okamoto, T. Miyagoe, K. Kobayashi, H. Uemura, H. Nishioka, H. Matsuzaki, A. Sawa, and Y. Tokura, Phys. Rev. B 82, 060513 (2010).
- Bonavolontà et al. (2013) C. Bonavolontà, L. Parlato, G. P. Pepe, C. de Lisio, M. Valentino, E. Bellingeri, I. Pallecchi, M. Putti, and C. Ferdeghini, Superconductor Science and Technology 26, 075018 (2013).
- Bonavolontà et al. (2014) C. Bonavolontà, C. de Lisio, M. Valentino, L. Parlato, G. Pepe, F. Kurth, and K. Iida, Physica C 503, 132 (2014).
- Cilento et al. (2014) F. Cilento, S. Dal Conte, G. Coslovich, S. Peli, N. Nembrini, S. Mor, F. Banfi, G. Ferrini, H. Eisaki, M. K. Chan, C. J. Dorow, M. J. Veit, M. Greven, D. van der Marel, R. Comin, A. Damascelli, L. Rettig, U. Bovensiepen, M. Capone, C. Giannetti, and F. Parmigiani, Nat. Commun. 5, 4353 (2014).
- Novelli et al. (2014) F. Novelli, G. De Filippis, V. Cataudella, M. Esposito, I. Vergara, F. Cilento, E. Sindici, A. Amaricci, C. Giannetti, D. Prabhakaran, S. Wall, A. Perucchi, S. Dal Conte, G. Cerullo, M. Capone, A. Mishchenko, M. Grüninger, N. Nagaosa, F. Parmigiani, and D. Fausti, Nat. Commun. 5, 5112 (2014).
- Li et al. (2015) W. Li, C. Zhang, X. Wang, J. Chakhalian, and M. Xiao, Journal of Magnetism and Magnetic Materials 376, 29 (2015).
- Dal Conte et al. (2015) S. Dal Conte, L. Vidmar, D. Golez, M. Mierzejewski, G. Soavi, S. Peli, F. Banfi, G. Ferrini, R. Comin, B. M. Ludbrook, L. Chauviere, N. D. Zhigadlo, H. Eisaki, M. Greven, S. Lupi, A. Damascelli, D. Brida, M. Capone, J. Bonca, G. Cerullo, and C. Giannetti, Nat. Phys. 11, 421 (2015).
- Madan et al. (2015) I. Madan, T. Kurosawa, Y. Toda, M. Oda, T. Mertelj, and D. Mihailovic, Nat Commun 6 (2015).
- Hinton et al. (2016) J. Hinton, E. Thewalt, Z. Alpichshev, F. Mahmood, J. Koralek, M. Chan, M. Veit, C. Dorow, N. Barisic, A. Kemper, D. Bonn, W. Hardy, R. Liang, N. Gedik, M. Greven, A. Lanzara, and J. Orenstein, “The rate of quasiparticle recombination probes the onset of coherence in cuprate superconductors,” (2016), arXiv:1601.05224.
- Vishik et al. (2016) I. M. Vishik, F. Mahmood, Z. Alpichshev, J. Higgins, R. L. Greene, and N. Gedik, “Dynamics of quasiparticles and antiferromagnetic correlations in electron-doped cuprate la2-xcexcuo,” (2016), arXiv:1601.06694.
- Giannetti et al. (2016) C. Giannetti, M. Capone, D. Fausti, M. Fabrizio, F. Parmigiani, and D. Mihailovic, “Ultrafast optical spectroscopy of strongly correlated materials and high-temperature superconductors: a non-equilibrium approach,” (2016), arXiv:1601.07204.
- Hinton et al. (2013) J. P. Hinton, J. D. Koralek, G. Yu, E. M. Motoyama, Y. M. Lu, A. Vishwanath, M. Greven, and J. Orenstein, Phys. Rev. Lett. 110, 217002 (2013).
- Merlin (1997) R. Merlin, Solid State Communications 102, 207 (1997).
- Yan et al. (1985) Y. Yan, E. B. Gamble, and K. A. Nelson, The Journal of Chemical Physics 83, 5391 (1985).
- Brorson et al. (1990) S. D. Brorson, A. Kazeroonian, J. S. Moodera, D. W. Face, T. K. Cheng, E. P. Ippen, M. S. Dresselhaus, and G. Dresselhaus, Phys. Rev. Lett. 64, 2172 (1990).
- Lee and Ramakrishnan (1985) P. A. Lee and T. V. Ramakrishnan, Rev. Mod. Phys. 57, 287 (1985).