AG Pegasi – now a classical symbiotic star in outburst?††thanks: Based on observations obtained in Rozhen Observatory, European Southern Observatory program 074.D-0114 and Asiago Observatory
Abstract
Optical spectroscopy study of the recent AG Peg outburst observed during the second half of 2015 is presented. Considerable variations of the intensity and the shape of the spectral features as well as the changes of the hot component parameters, caused by the outburst, are discussed and certain similarities between the outburst of AG Peg and the outburst of a classical symbiotic stars are shown. It seems that after the end of the symbiotic nova phase, AG Peg became a member of the classical symbiotic stars group.
keywords:
stars: binaries: symbiotic – stars: individual: AG Pegasi.1 Introduction
AG Peg is the oldest symbiotic nova which attracted astronomers attention with the first spectral observations performed by Fleming (1894). Lundmark (1921) showed that in the mid of 19th century, when a brightness increase started, the star’s visual magnitude was . The maximum at about was reached around the year 1870. The subsequent, gradual decrease of the star brightness, reaching the level observed before the outburst, lasted for about 130 years.
During this time AG Peg demonstrated a unique evolution, passing through various phases: from a Be star around the maximum, through a P Cyg-type object, to a symbiotic star revealing the spectra of a hot Wolf-Rayet component and cool M3 giant. All these changes were studied in great detail by Merrill (1916, 1929a, 1929b, 1942, 1951b, 1951a, 1959), Swings & Struve (1940, 1942), Boyarchuk (1967a, b), Hutchings & Redman (1972), Cowley & Stencel (1973), Hutchings et al. (1975), Gallagher et al. (1979).
Merrill has found an 800 days long period of variation of intensities of emission lines and radial velocities. UBV photometric observations by Belyakina (1968, 1970, 1985) had confirmed this periodicity. Observations of AG Peg in X-ray, UV, IR and radio ranges allowed a more precise evaluation of basic parameters of the system components to be made. Emergence and gradual attenuation of high-speed, massive and dense wind from the system’s hot component as well as signs of its interaction with the wind from the red giant were found. Also the existence of a complex structure of a circumbinary nebula was revealed (Kenny et al., 1991; Kenny & Taylor, 2007; Kenyon et al., 1993; Kenyon et al., 2001; Vogel & Nussbaumer, 1994; Murset & Nussbaumer, 1994; Nussbaumer et al., 1995; Muerset et al., 1995, and references therein). Fekel et al. (2000) used precise infrared radial velocities to determine the single-lined spectroscopic orbit for AG Peg. Recent observations show that the gradual brightness decline ceased and the present brightness shows only orbitally related wave-like variations around the mean brightness (Skopal et al., 2012).
As pointed out by Kenyon et al. (1993), most authors suggest a nearly constant rate of the slow AG Peg brightness decline. However, in the literature there are several reports of abrupt changes of the star brightness, such as a minimum of 1907-1908 about deep and a “flare” in 1946 with an amplitude about (see Arkhipova & Dokuchaeva, 1963; Belyakina, 1968). According to Kenyon et al. (1993), there is nothing unusual in these brightness variations and they note that the ephemeris by Fernie (1985) predicts both – the minimum and the maximum. Another episode of AG Peg UBVRI minimum brightness during 1985, together with remarkable emission lines variations, is reported and shortly discussed by Boiarchuk et al. (1987).
In this paper, we report on the AG Peg outburst with two maxima, which occurred in the second half of 2015. These brightness maxima, in comparison with the reported before, are clearly different and in many respects are very similar to the multi-maxima outbursts, typical for the classical symbiotic stars like AG Dra and Z And.
2 Observations and data reduction
2.1 Photometry
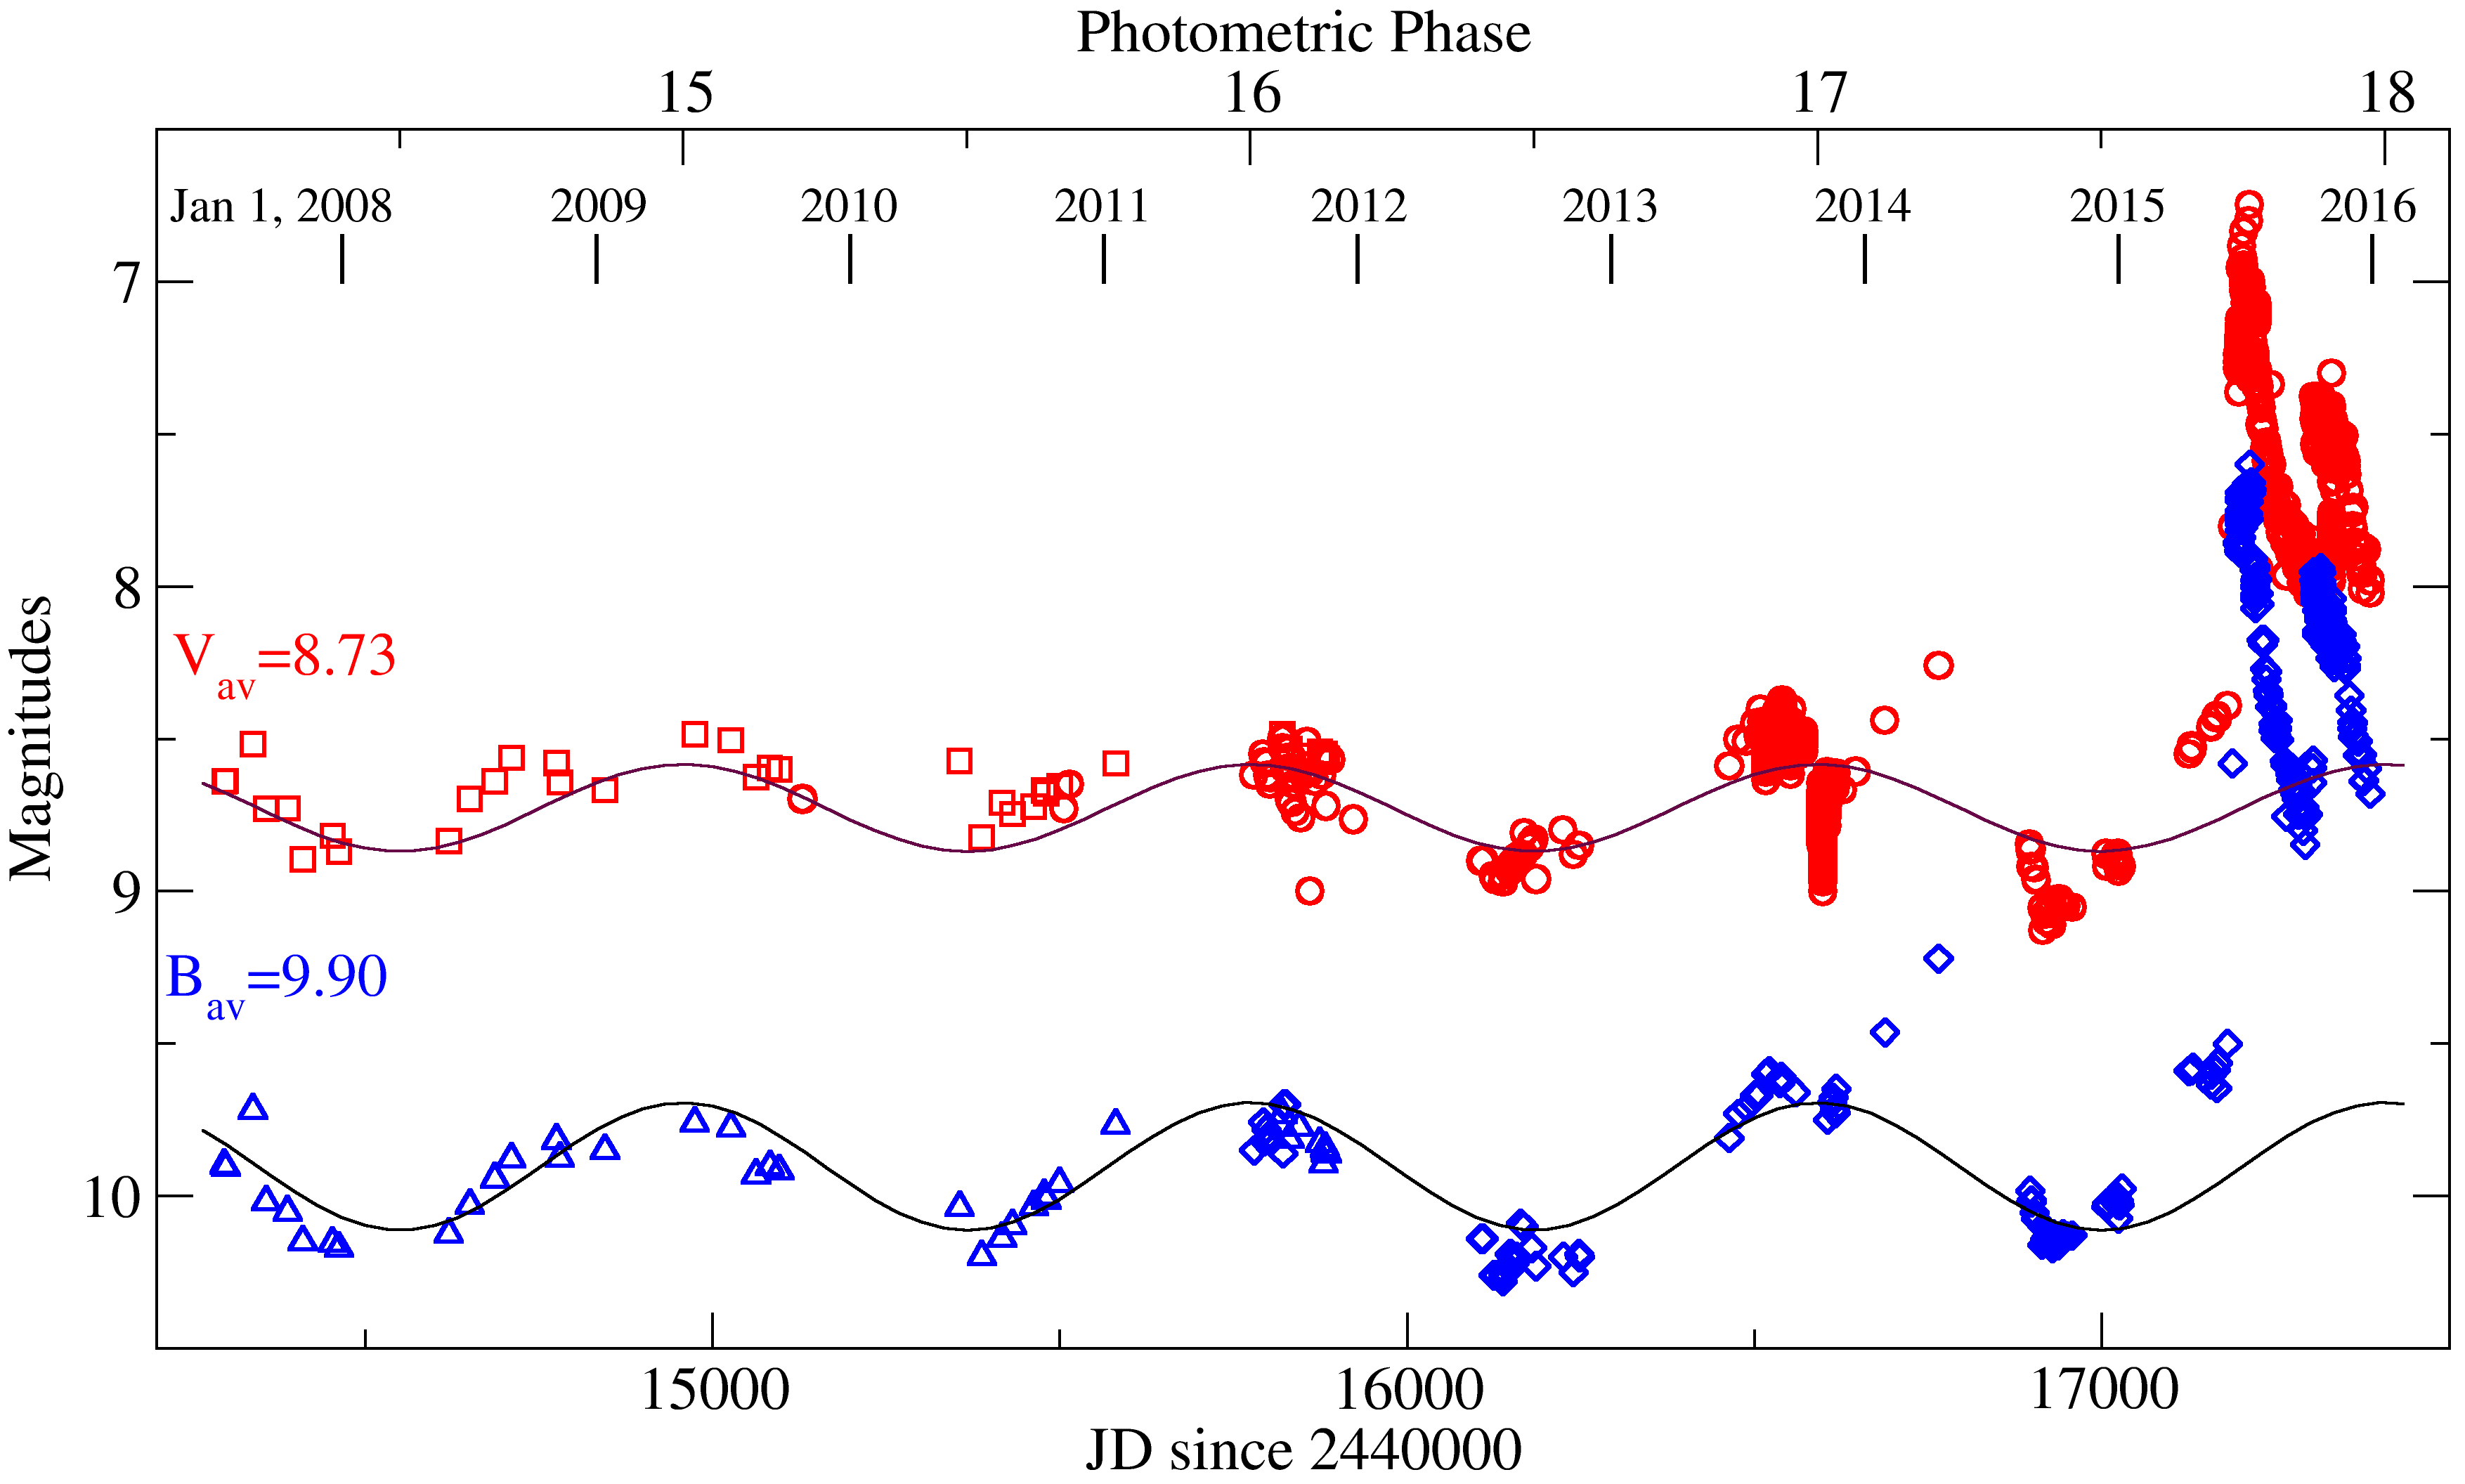
The AG Peg light curves in V and B bands, from the period of the mid of 2007 to the end of 2015, based on data published by Skopal et al. (2012) and the AAVSO database (Kafka, 2016), are shown in Fig. 1. Following Kenyon et al. (1993); Kenyon et al. (2001) we used the Fernie (1985) ephemeris for maximum visual light
| (1) |
to calculate the photometric phase and to fit the brightness variations. Apparently, the AG Peg brightness changes are consistent with this ephemeris around mean values of 990 and 873 for B and V respectively. Munari et al. (2013) announced increased star activity around photometric phases 16.8-16.9. As it can be seen in Fig. 1, the total brightness change of reported in filter B do not emerge over the scatter affecting AAVSO data. However, the observations presented in Fig. 1 and in the top panel of Fig. 2 show beyond any doubt that an outburst of AG Peg occurred in the second half of 2015. During the first event the star brightness increased by and during the second, when compared to the mean values for B and V bands respectively. If compared to the first event, the maximum of the second event was fainter by in B filter and in V filter.
2.2 Spectroscopy
High-resolution () spectra of AG Peg, covering the spectral range from 4 000 to 9 000 Å, were obtained during 12 nights of the second half of 2015. We used the ESPERO echelle spectrograph (Bonev et al., in preparation) at the 2 m RCC telescope of the Rozhen Observatory, Bulgaria. For all spectra S/N ratio is at 6 000 Å. The spectra were reduced and calibrated using standard IRAF111iraf is distributed by the National Optical Astronomy Observatories, which are operated by the Association of Universities for Research in Astronomy, Inc., under cooperative agreement with the National Science Foundation. procedures, including bias, dark, flat-field corrections and spectra extraction with background subtraction.
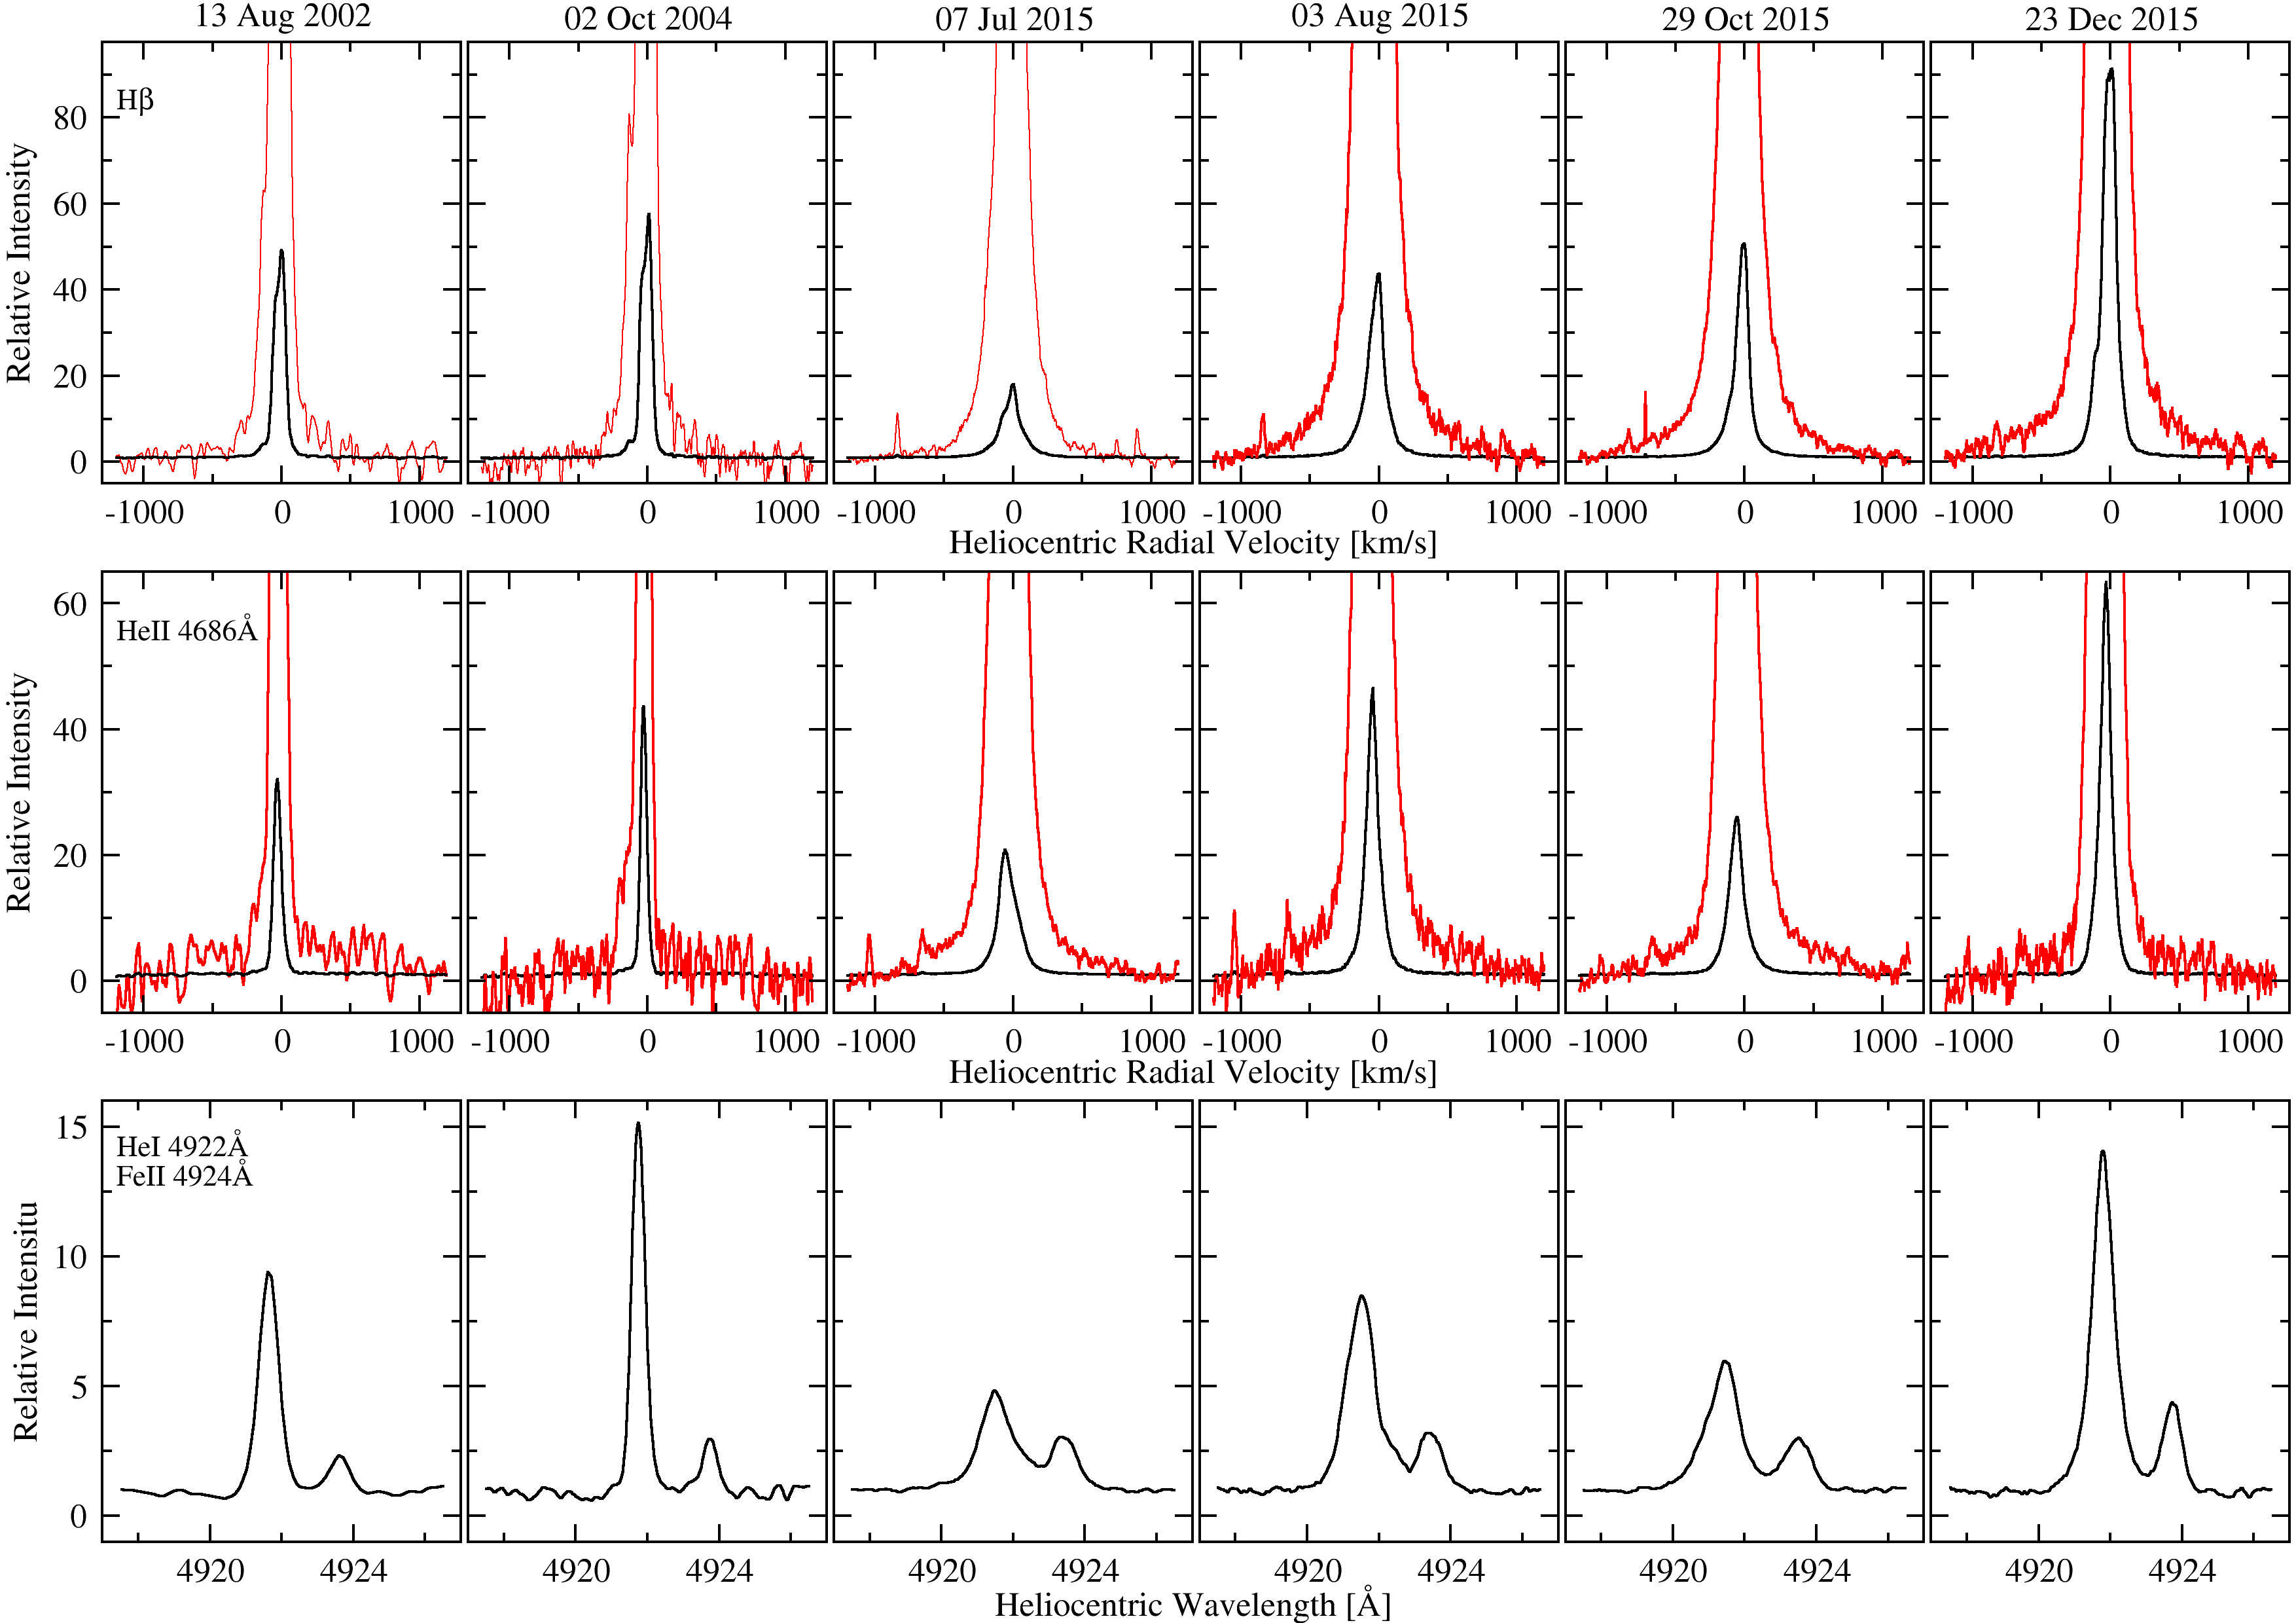
Additionally, we used two spectra obtained with the ESO FEROS echelle spectrograph on October 2nd, 2004 and two spectra secured with the Asiago echelle spectrograph on August 13th and 14th, 2002. The FEROS spectral coverage extends from 3 600 Å to 9 200 Å with resolving power of . The Asiago spectra of AG Peg are absolutely flux calibrated with and cover the spectral region 3 390-5 985 Å. More details on FEROS and Asiago spectra can be found in Zamanov et al. (2005) and Eriksson et al. (2005) respectively. A journal of our spectral observations is presented in Table 1.
| Date | UT | Exp. time | Observat. |
|---|---|---|---|
| [sec] | |||
| 2002 Aug 13 | 01:07 | 5670 | Asiago |
| 2002 Aug 14 | 00:53 | 1440 | Asiago |
| 2004 Oct 02 | 01:53 | 600 | ESO |
| 2004 Oct 02 | 01:42 | 600 | ESO |
| 2015 Jul 07 | 01:23 | 2820 | Rozhen |
| 2015 Jul 08 | 01:17 | 1320 | Rozhen |
| 2015 Aug 03 | 23:18 | 300 | Rozhen |
| 2015 Aug 04 | 22:19 | 300 | Rozhen |
| 2015 Oct 28 | 18:28 | 1800 | Rozhen |
| 2015 Oct 29 | 16:40 | 1800 | Rozhen |
| 2015 Nov 01 | 16:32 | 1800 | Rozhen |
| 2015 Dec 23 | 16:27 | 580 | Rozhen |
| 2015 Dec 24 | 16:09 | 160 | Rozhen |
| 2015 Dec 25 | 16:02 | 160 | Rozhen |
| 2015 Dec 26 | 16:22 | 160 | Rozhen |
| 2015 Dec 27 | 15:48 | 160 | Rozhen |
We measured the equivalent widths (EW) of several emission lines integrating the area under the whole profile. Repeated test measurements have shown that the measurement error does not exceed 5% for the strong and 10% for the weak lines and it mainly depends on the local continuum level fitting. Then we calibrated the EWs of H, He ii 4686 Å and the Raman scattered line O vi 6825 Å, measured in FEROS and ESPERO spectra, to fluxes. To do this, we used the AAVSO and Skopal et al. (2007) BV photometry. To correct for the effect of emission lines, we reduced the flux in B by 30% and in V by 10%, adopting the values estimated by Skopal (2007). The fluxes were de-reddened with =01 adopted from Kenyon et al. (1993); Kenyon et al. (2001) and using the standard ISM extinction curve of Fitzpatrick (1999). Considering the errors in the EWs and those added by the calibration, we estimate that the uncertainties in the fluxes can reach up to 20% for the strong and up to 30% for the weak emission lines.
3 Results and discussion
3.1 Changes in the spectrum during the outburst
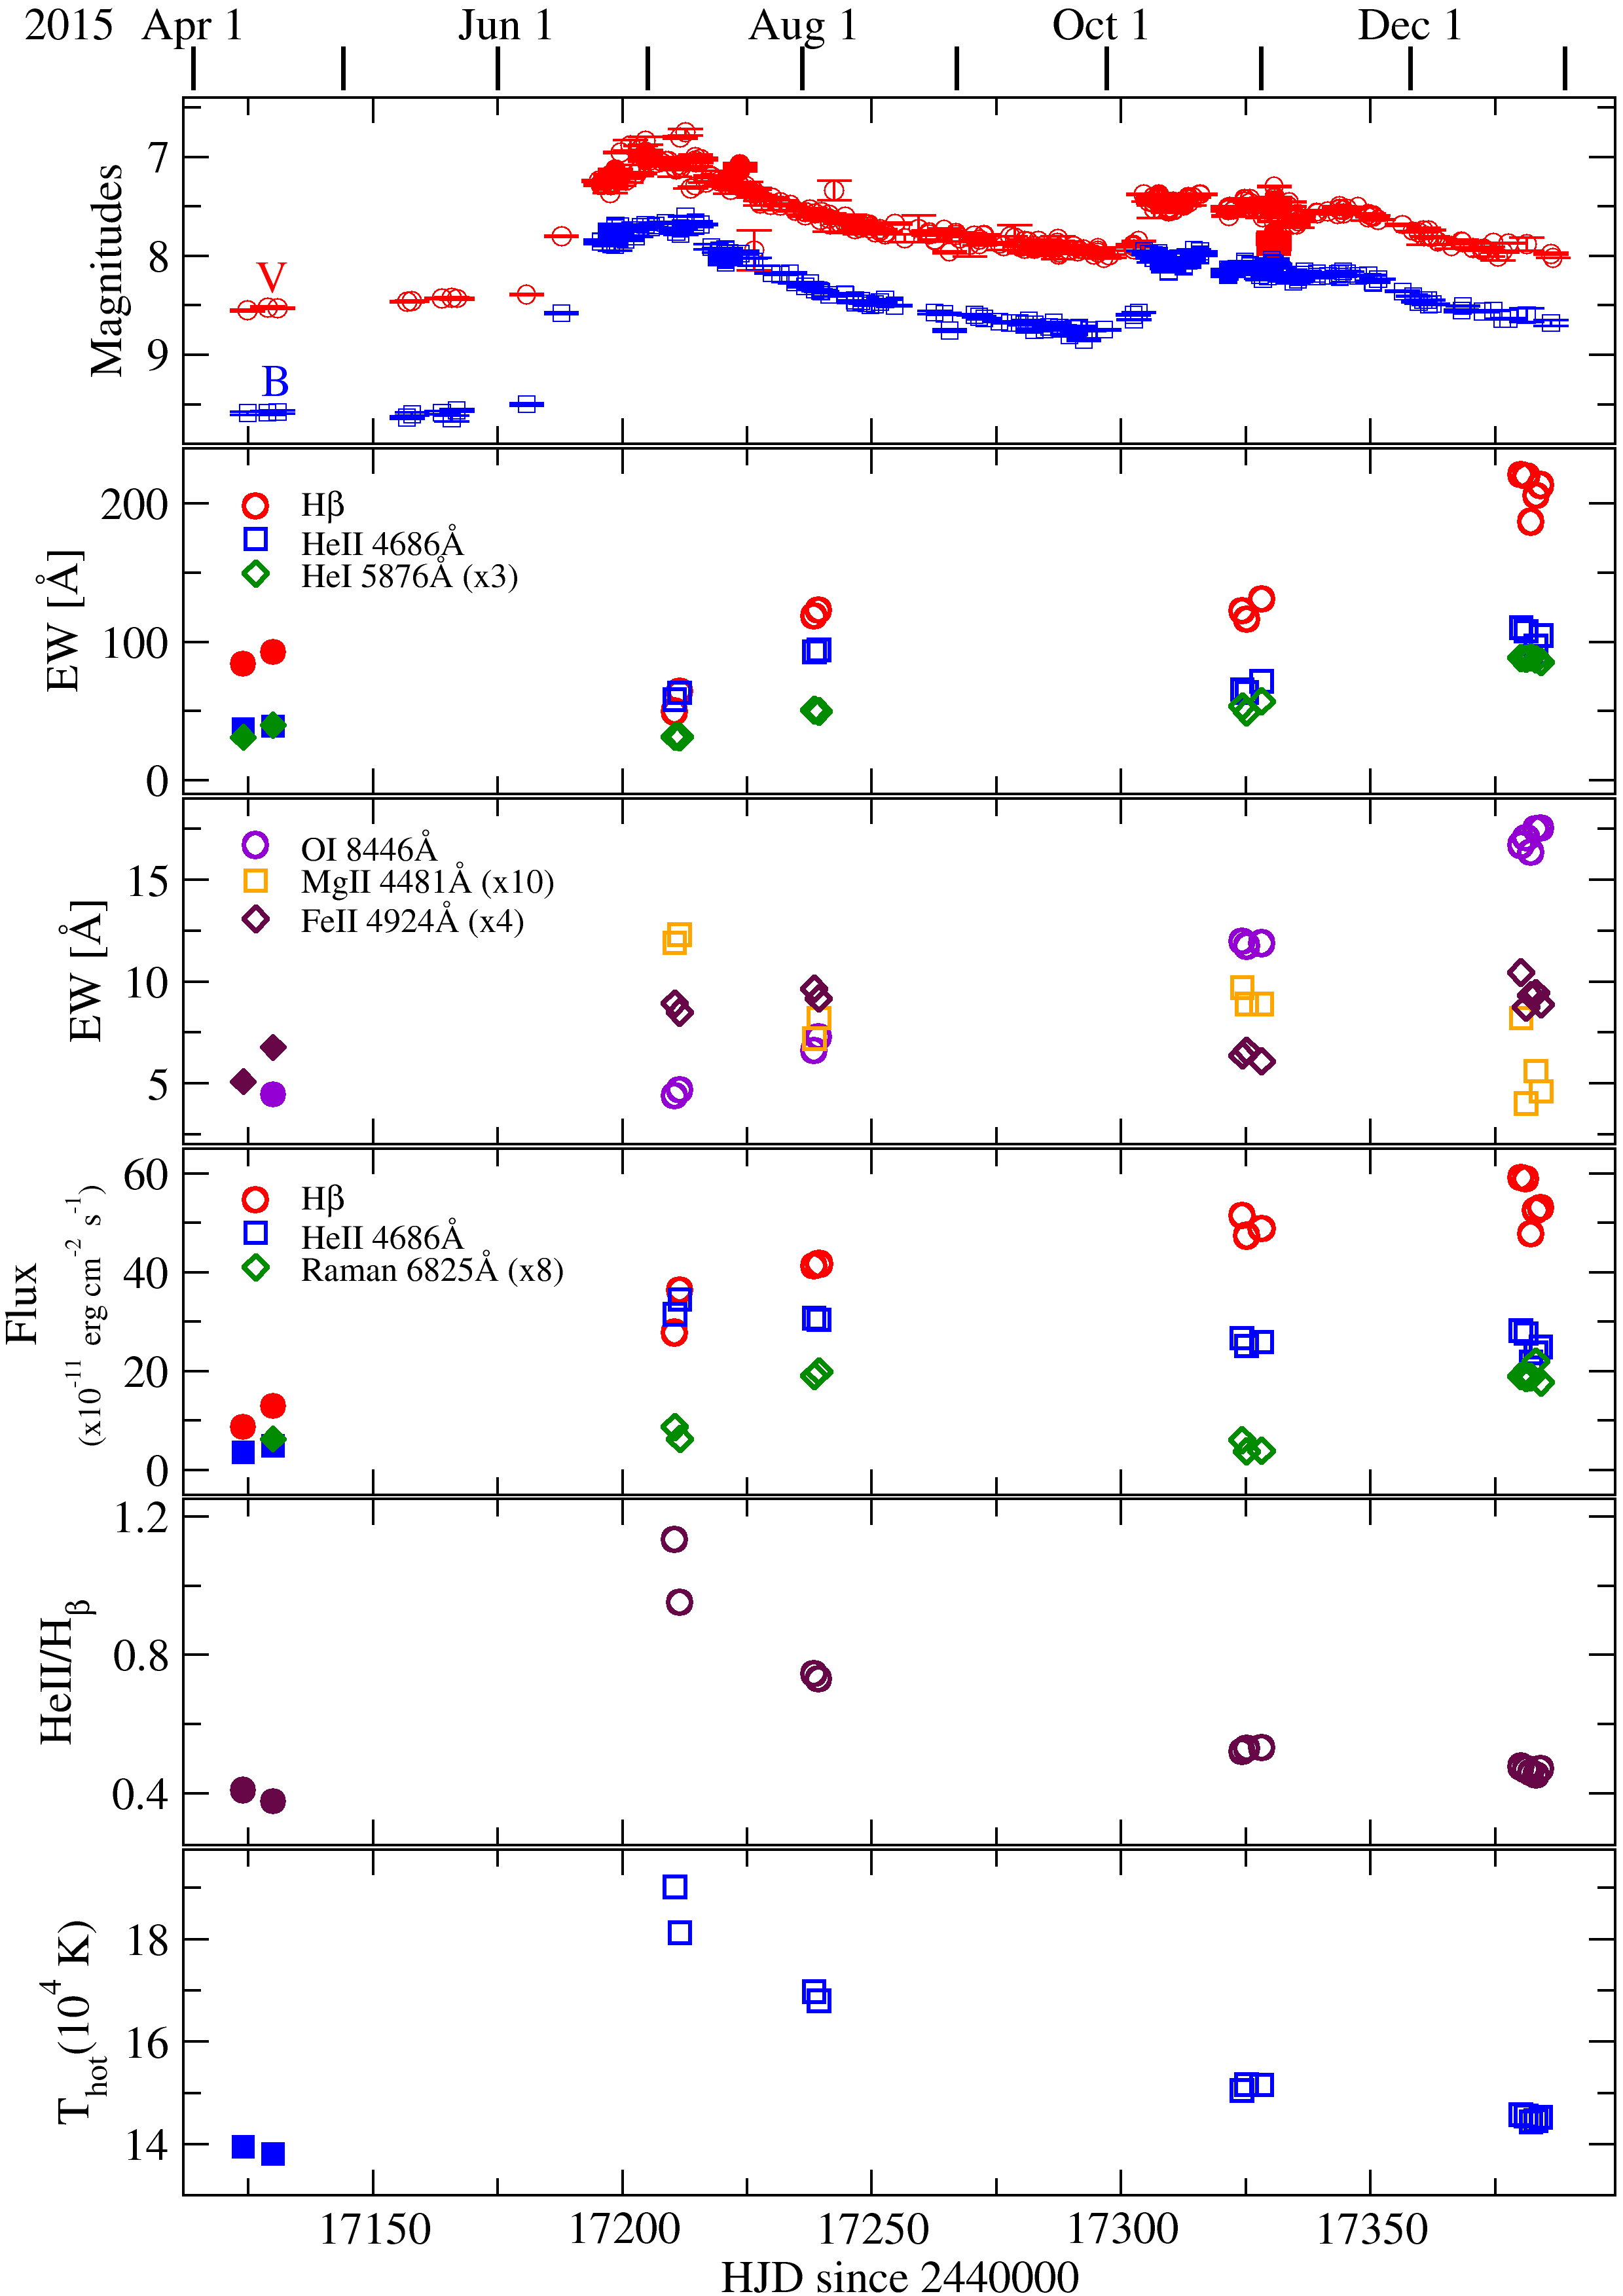
The abrupt rise of AG Peg optical brightness with 2 mag in 2015 is the first such event since its symbiotic nova outburst in the mid-19th century. The first maximum occurred between July 2nd and 14th. The second took place around October 8th, followed by a plateau in the light curve until around November 24th. After that the star brightness decrease accelerated (Figs. 1 and 2). The stages of the outburst, during which our spectra were obtained, are evident in Fig. 2. As Table 2 clearly shows, the October-December 2015 spectra and the spectra from Asiago and ESO, cover almost the same photometric phase.
3.1.1 EWs and flux variations of different spectral lines
The increased brightness was accompanied by remarkable changes in the outburst spectrum of AG Peg, when compared to the quiescence spectra in 2002 and 2004. A hot continuum considerably fills the cool star’s absorption features, as it can be seen in the wide wings of He ii 4686 Å and H in Fig. 3. But, the A/F supergiant absorption spectrum, typical for symbiotic stars in outburst, is missing. Also, there were no signas of P Cyg absorption components, indicating the existence of an expanding pseudo-photosphere, shell or massive, dense wind from the hot component. The most remarkable changes are in the intensity and the width of the emission lines as illustrated in Fig. 3.
The FWHM of the He ii 4686 Å emission was 68 km s-1 (2002) and 55 km s-1 (2004) but in our spectra varied between 107 km s-1 and 169 km s-1. Similarly, the H FWHM from the range of 93 km s-1 and 97 km s-1 increased, reaching the values of 120 km s-1 and 183 km s-1. The profiles of the Balmer lines, the He ii 4686 Å and 5412 Å and the most intensive He i emissions are very complex and highly variable. In the outburst spectra of AG Peg, shallow broad wings appeared in some of the strongest emission lines. The wings are typical in the case of classical symbiotics outburst. Their origin is still discussed, although different explanations, like for example, Raman scattering, electron scattering, optically thin wind from the hot component, etc. were suggested (Nussbaumer et al., 1989; Lee, 2000; Skopal, 2006; Sekeráš & Skopal, 2012, and references therein).
The EWs of some strong emissions (Fig. 2) show growing trend, but with different gradients. H EW increased by a factor of 4 while for He i 5876 Å and He ii 4686 Å the increase is of about 3 and 2 times respectively. The Fe ii 4924 Å EW shows significant variations around the value Å. The emission Mg ii 4481 Å, not presented in the 2002 and 2004 spectra, was visible in all spectra obtained during the outburst, however, with an opposite trend of decreasing EW. The changes in the EWs, measured in our spectra from different epochs, are partly caused by the hot continuum variation. The O i 8446 Å EW grows almost linearly because the line is located relatively far to the red and is not affected by the hot continuum. The O i 7772 Å triplet is seen in absorption in the AG Peg spectrum in 2004. It is visible in emission, 10 to 25 times fainter in comparison to the O i 8446 Å line, during the July-December 2015 period. Such large intensity of the emission O i 8446 Å with respect to the O i 7772 Å triplet suggests fluorescence from Ly photons (Bowen, 1947).
We also show in Fig. 2 the calculated fluxes of H, He ii 4686 Å and the Raman scattered O vi line 6825 Å. It is clear that the H flux almost doubled between July and December 2015. During the same time, the He ii 4686 Å flux decreased by more than 20%.
As Kenyon et al. (2001) demonstrated, the considerable variations of the optical emission lines are correlated with the photometric phase. They show that the H i and the He i are more intensive roughly by a factor 2-3 at photometric maxima in comparison to the minima. In the same time, the He ii 4686 Å intensity changes less than 50%. The fluxes of H and He ii 4686 Å, around the maximum of photometric phase 18 (October-December 2015), exceed more than 5-6 times the measured at the maximum of photometric phase 12, during the quiescence in 2002 and 2004. That is far above the accuracy () of our measurements. This is evidence that the large increase of the intensities of the optical emission lines in 2015 spectra of AG Peg is caused mainly by the outburst of this symbiotic system.
| Date | HJD | Photom. | Flux ergs cm-2 s-1 | |||||
|---|---|---|---|---|---|---|---|---|
| since 2440000 | phase | He ii 4686 Å | H | Raman 6825 Å | [103 K] | [] | [] | |
| 2002 Aug 13 | 12499.55 | 11.99 | 3.64 | 8.90 | 140 | 240 | 0.027 | |
| 2002 Aug 14 | 12500.54 | 11.99 | 3.49 | 8.52 | 139 | 230 | 0.027 | |
| 2004 Oct 02 | 13280.07 | 12.95 | 4.89 | 12.9 | 0.85 | 138 | 340 | 0.033 |
| 2004 Oct 02 | 13280.08 | 12.95 | 4.85 | 13.0 | 0.71 | 138 | 340 | 0.033 |
| 2015 Jul 07 | 17210.53 | 17.76 | 31.5 | 27.8 | 1.09 | 190 | 1170 | 0.032 |
| 2015 Jul 08 | 17211.55 | 17.76 | 34.5 | 36.3 | 0.78 | 181 | 1395 | 0.038 |
| 2015 Aug 03 | 17238.47 | 17.79 | 30.7 | 41.2 | 2.38 | 170 | 1400 | 0.044 |
| 2015 Aug 04 | 17239.43 | 17.79 | 30.4 | 41.7 | 2.49 | 168 | 1410 | 0.045 |
| 2015 Oct 28 | 17324.26 | 17.90 | 26.7 | 51.4 | 0.76 | 150 | 1525 | 0.058 |
| 2015 Oct 29 | 17325.19 | 17.90 | 25.1 | 47.4 | 0.47 | 152 | 1420 | 0.055 |
| 2015 Nov 01 | 17328.18 | 17.90 | 25.9 | 48.8 | 0.49 | 152 | 1460 | 0.056 |
| 2015 Dec 23 | 17380.18 | 17.97 | 28.2 | 59.1 | 2.37 | 146 | 1715 | 0.066 |
| 2015 Dec 24 | 17381.17 | 17.97 | 27.6 | 58.8 | 2.33 | 145 | 1690 | 0.066 |
| 2015 Dec 25 | 17382.16 | 17.97 | 21.9 | 47.7 | 2.35 | 144 | 1355 | 0.059 |
| 2015 Dec 26 | 17383.18 | 17.97 | 23.7 | 52.5 | 2.74 | 145 | 1480 | 0.062 |
| 2015 Dec 27 | 17384.15 | 17.97 | 24.9 | 53.0 | 2.21 | 145 | 1520 | 0.062 |
3.1.2 Raman scattered O vi line 6825 Å
Schmid et al. (1999) subtracted the spectrum of a M3 III giant to demonstrate the presence of the Raman scattered O vi line 6825 Å (see Schmid, 1989) in the spectrum of AG Peg obtained in 1997. This line is directly visible in all our spectra obtained in 2004 and 2015 (Fig. 4). Partly because it is weaker and partly because of the molecular bands located around this wavelength, we were not able to identify the second Raman scattered O vi line at 7082 Å in our spectra. The flux variations of the 6825 Å emission are shown in Fig. 2. The changes are undoubtedly real because they exceed the accuracy of the measurements.
In most symbiotic stars the Raman scattered O vi lines exhibit a multi-peaked structure (see Schmid et al., 1999). The O vi 6825 Å emission profile in our spectra of AG Peg has two components with similar peak intensities (Fig. 4).
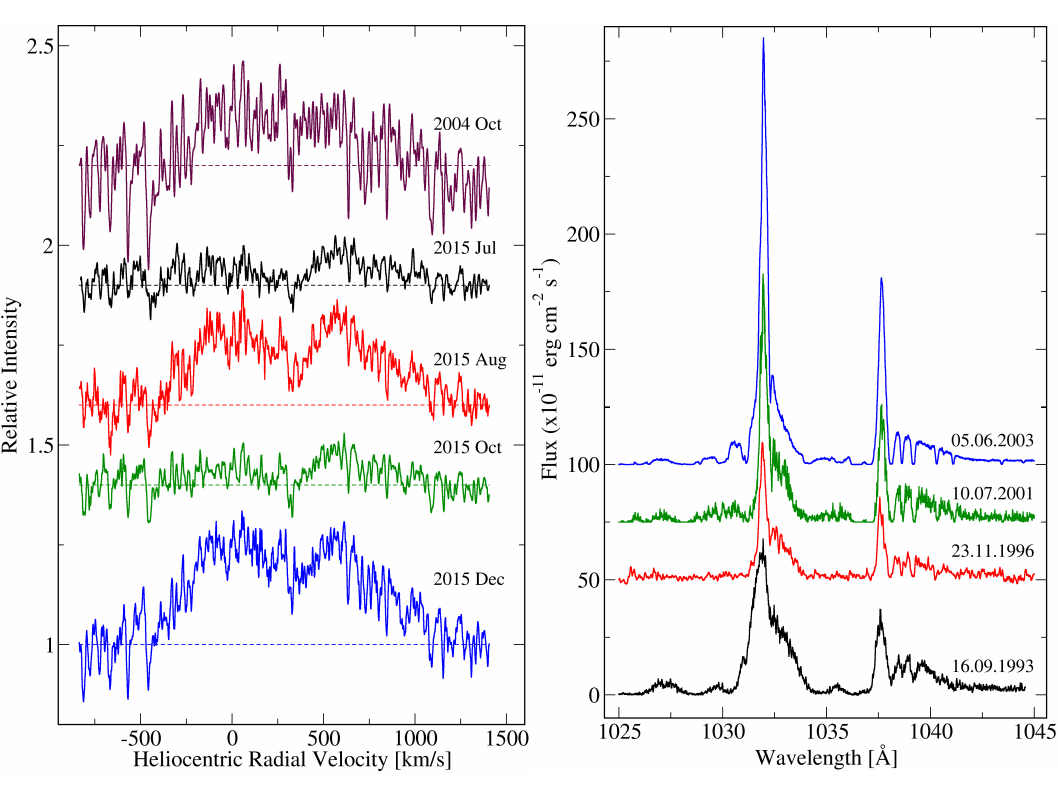
The minimal flux of the 6825 Å line measured by us (Table 2) is more than three times greater than the reported by Schmid et al. (1999) ergs cm-2 s-1. This indicates that the 2015 UV emission O vi 1032 Å should be stronger than that of the time of observations discussed by Schmid et al. (1999). In Fig. 4, we show all observations of the resonance doublet O vi in the spectrum of AG Peg existing in the MAST database. The data includes ORFEUS (1993 and 1996) and FUSE (2001 and 2003) observations (for more details see Schmid et al. (1999) and Eriksson et al. (2006)). A gradual increase of the intensity of the sharp component and a gradual decrease of the intensity of the broad wind component in the O vi UV resonance lines are clearly apparent in Fig. 4.
In Fig. 5, we compare the mean Raman 6825 Å profile (from our December 2015 spectra) and the O vi line 1032 Å obtained by ORFEUS in 1996 and the most recent one obtained by FUSE in 2003). The 6825 Å line profile is converted to the systematic radial velocity space of the original O vi line 1032 Å emission using the coefficient . The comparison shows that the O vi line 1032 Å narrow profiles, as before (see Schmid et al., 1999), well coincide with the blue component of the Raman scattered line at 6825 Å. Moreover, as visible in Fig. 5, there are no signs of the broad wind wings in the 6825 Å emission profile.
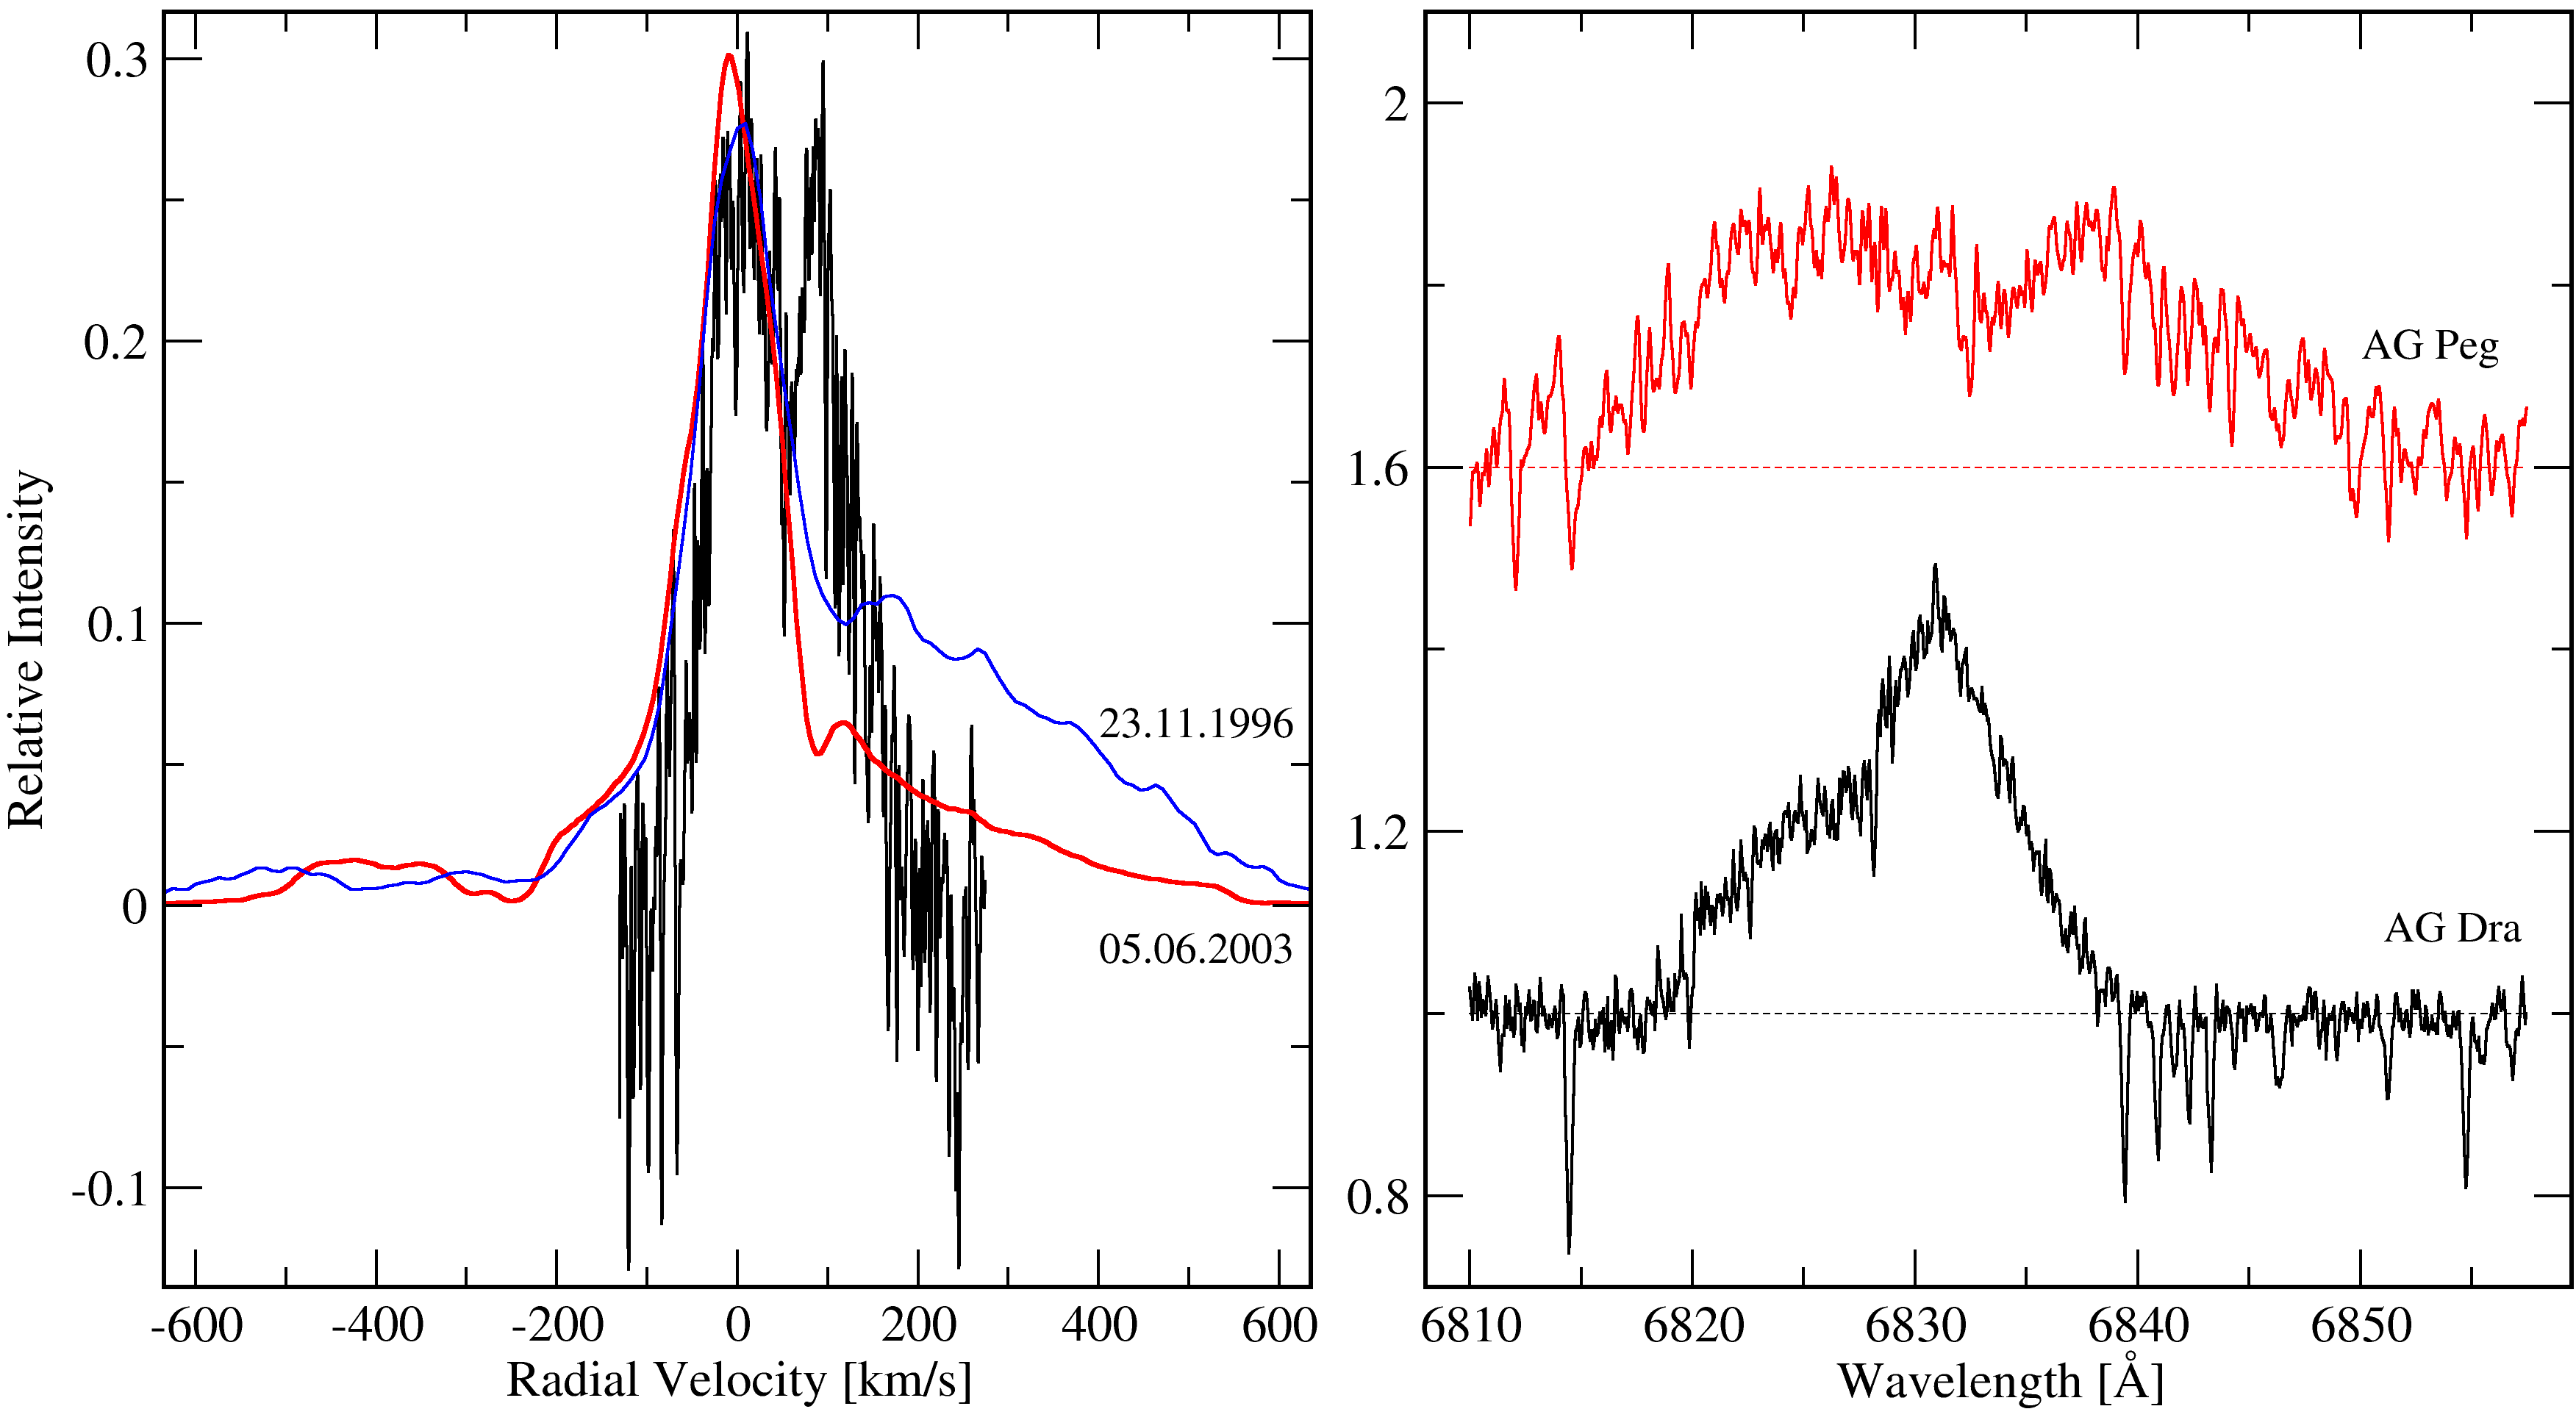
Also in Fig. 5, the mean Raman 6825 Å profile from our December 2015 spectra is compared with a typical 6825 Å scattered profile in the quiescence spectrum of AG Dra (Shore et al., 2010, and references therein) obtained with the same ESPERO spectrograph on July 5th, 2015. The most conspicuous are the remarkable broader profile in the AG Peg spectrum and the difference in the blue and red components intensity ratio for both stars. Fitting two Gaussians to the AG Peg Raman profile, we estimated the FWHM of the blue and red components to km s-1 and km s-1 respectively. For the total FWHM of the line we obtained the value of km s-1which is slightly more than about km s-1reported by Schmid et al. (1999) for the single component 6825 Å. The calculated separation of the peaks is km s-1 which converted to the systematic velocity scale of the O vi 1032 Å line gives km s-1. Schmid et al. (1999) and Shore et al. (2010) considered two different contributors to explain the double peaked Raman profiles in the spectrum of AG Dra. The first one being the WD wind (and possibly accretion disk) and the second one - an ionized region surrounding it within the M star wind. From the separation of the peaks of the line, Shore et al. (2010) estimated the scattering wind velocity to about 50 km s-1 relative to the WD. If we treat the same way the Raman scattered 6825 Å line in the spectrum of AG Peg than the wind velocity of km s-1 relative to the WD is twice as that for AG Dra.
Schmid et al. (1999) interpreted the observed by them single peak AG Peg Raman scattered 6825 Å profile as a strong support for the colliding wind model of Muerset et al. (1995). Results from several published observational studies (Kenyon et al. (1993, and references therein); Kenyon et al. (2001, and references therein); Vogel & Nussbaumer (1994, and references therein); Eriksson et al. (2006, and references therein)) provide evidence that the high velocity ( km s-1), dense AG Peg hot component wind was gradually decreasing during the last decades. The X-ray observations during the outburst in 2015 also do not confirm the presence of the dense and fast wind nor any noticeable signs of colliding stellar winds (Zhekov & Tomov, 2016).
Lee & Park (1999); Lee & Kang (2007); Heo & Lee (2015) explain the two component profile of the Raman scattered lines observed in some symbiotics, proposing the existence of an accretion disk. In their model, the region emitting in UV O vi resonance doublet is identified with the accretion flow around the WD and is divided into the blue and the red emission regions. In the framework of this model it is difficult to explain, why in the spectrum of AG Peg first a single Raman scattered 6825 Å emission was detected and only years later a second, red shifted component appeared.
3.2 Hot component temperature and luminosity
To estimate the AG Peg hot component temperature, the Iijima (1981) method was used, based on the emission line fluxes of He ii 4686 Å, H and He i 4471 Å, applicable to nebulae excited by a hot star and also optically thick to the hydrogen ionizing radiation. It is valid for effective temperatures of between 70 000 and 200 000 K. A disadvantage of this method is that the lower members of the H i Balmer series may be optically thick, which leads to an overestimate of the hot star effective temperature. Also, to some extent, it is sensitive to interstellar reddening (Kenyon, 1986; Stasińska & Tylenda, 1986). To avoid the introduction of additional calibration errors, we used the equivalent widths instead of the line fluxes. The use of EWs for He ii and H is based on their wavelength proximity, which nulls the effect of reddening and slope of the underlying stellar continuum. Because in our case the EW of He i 4471 Å is always less than 10% of both the He ii 4686 Å and the H EWs, we neglected it using the EW4686/EWHβ ratio. Since the EWs of emissions as strong as these of He ii 4686 Å and H are measured with an error of the order of 5%, the error of the calculated effective temperature should not exceed 15%. The resultant effective temperature of the hot component is presented in Table 2 and its changes with the time are shown in Fig. 2.
We used de-reddened fluxes of He ii 4686 Å and H to calculate the luminosity of the hot component in the same way as Mikolajewska et al. (1997, their equations 6 and 7), adopting a distance of 800 pc to AG Peg (Kenyon et al., 1993; Kenyon et al., 2001). To calculate the number of H0 and He+ ionizing photons, we used the number of ionizing photons tabulated by Nussbaumer & Vogel (1987). In all cases, the differences between the luminosity calculated based on the He ii 4686 Å and H do not exceed 20%. For the hot component luminosity, presented in Table 2, we adopted the average of the values obtained from both equations. We estimate the accuracy of the obtained luminosity to 20%–30%. But, considering the uncertainties in the reddening and the distance, the error in the luminosity could reach 50%.
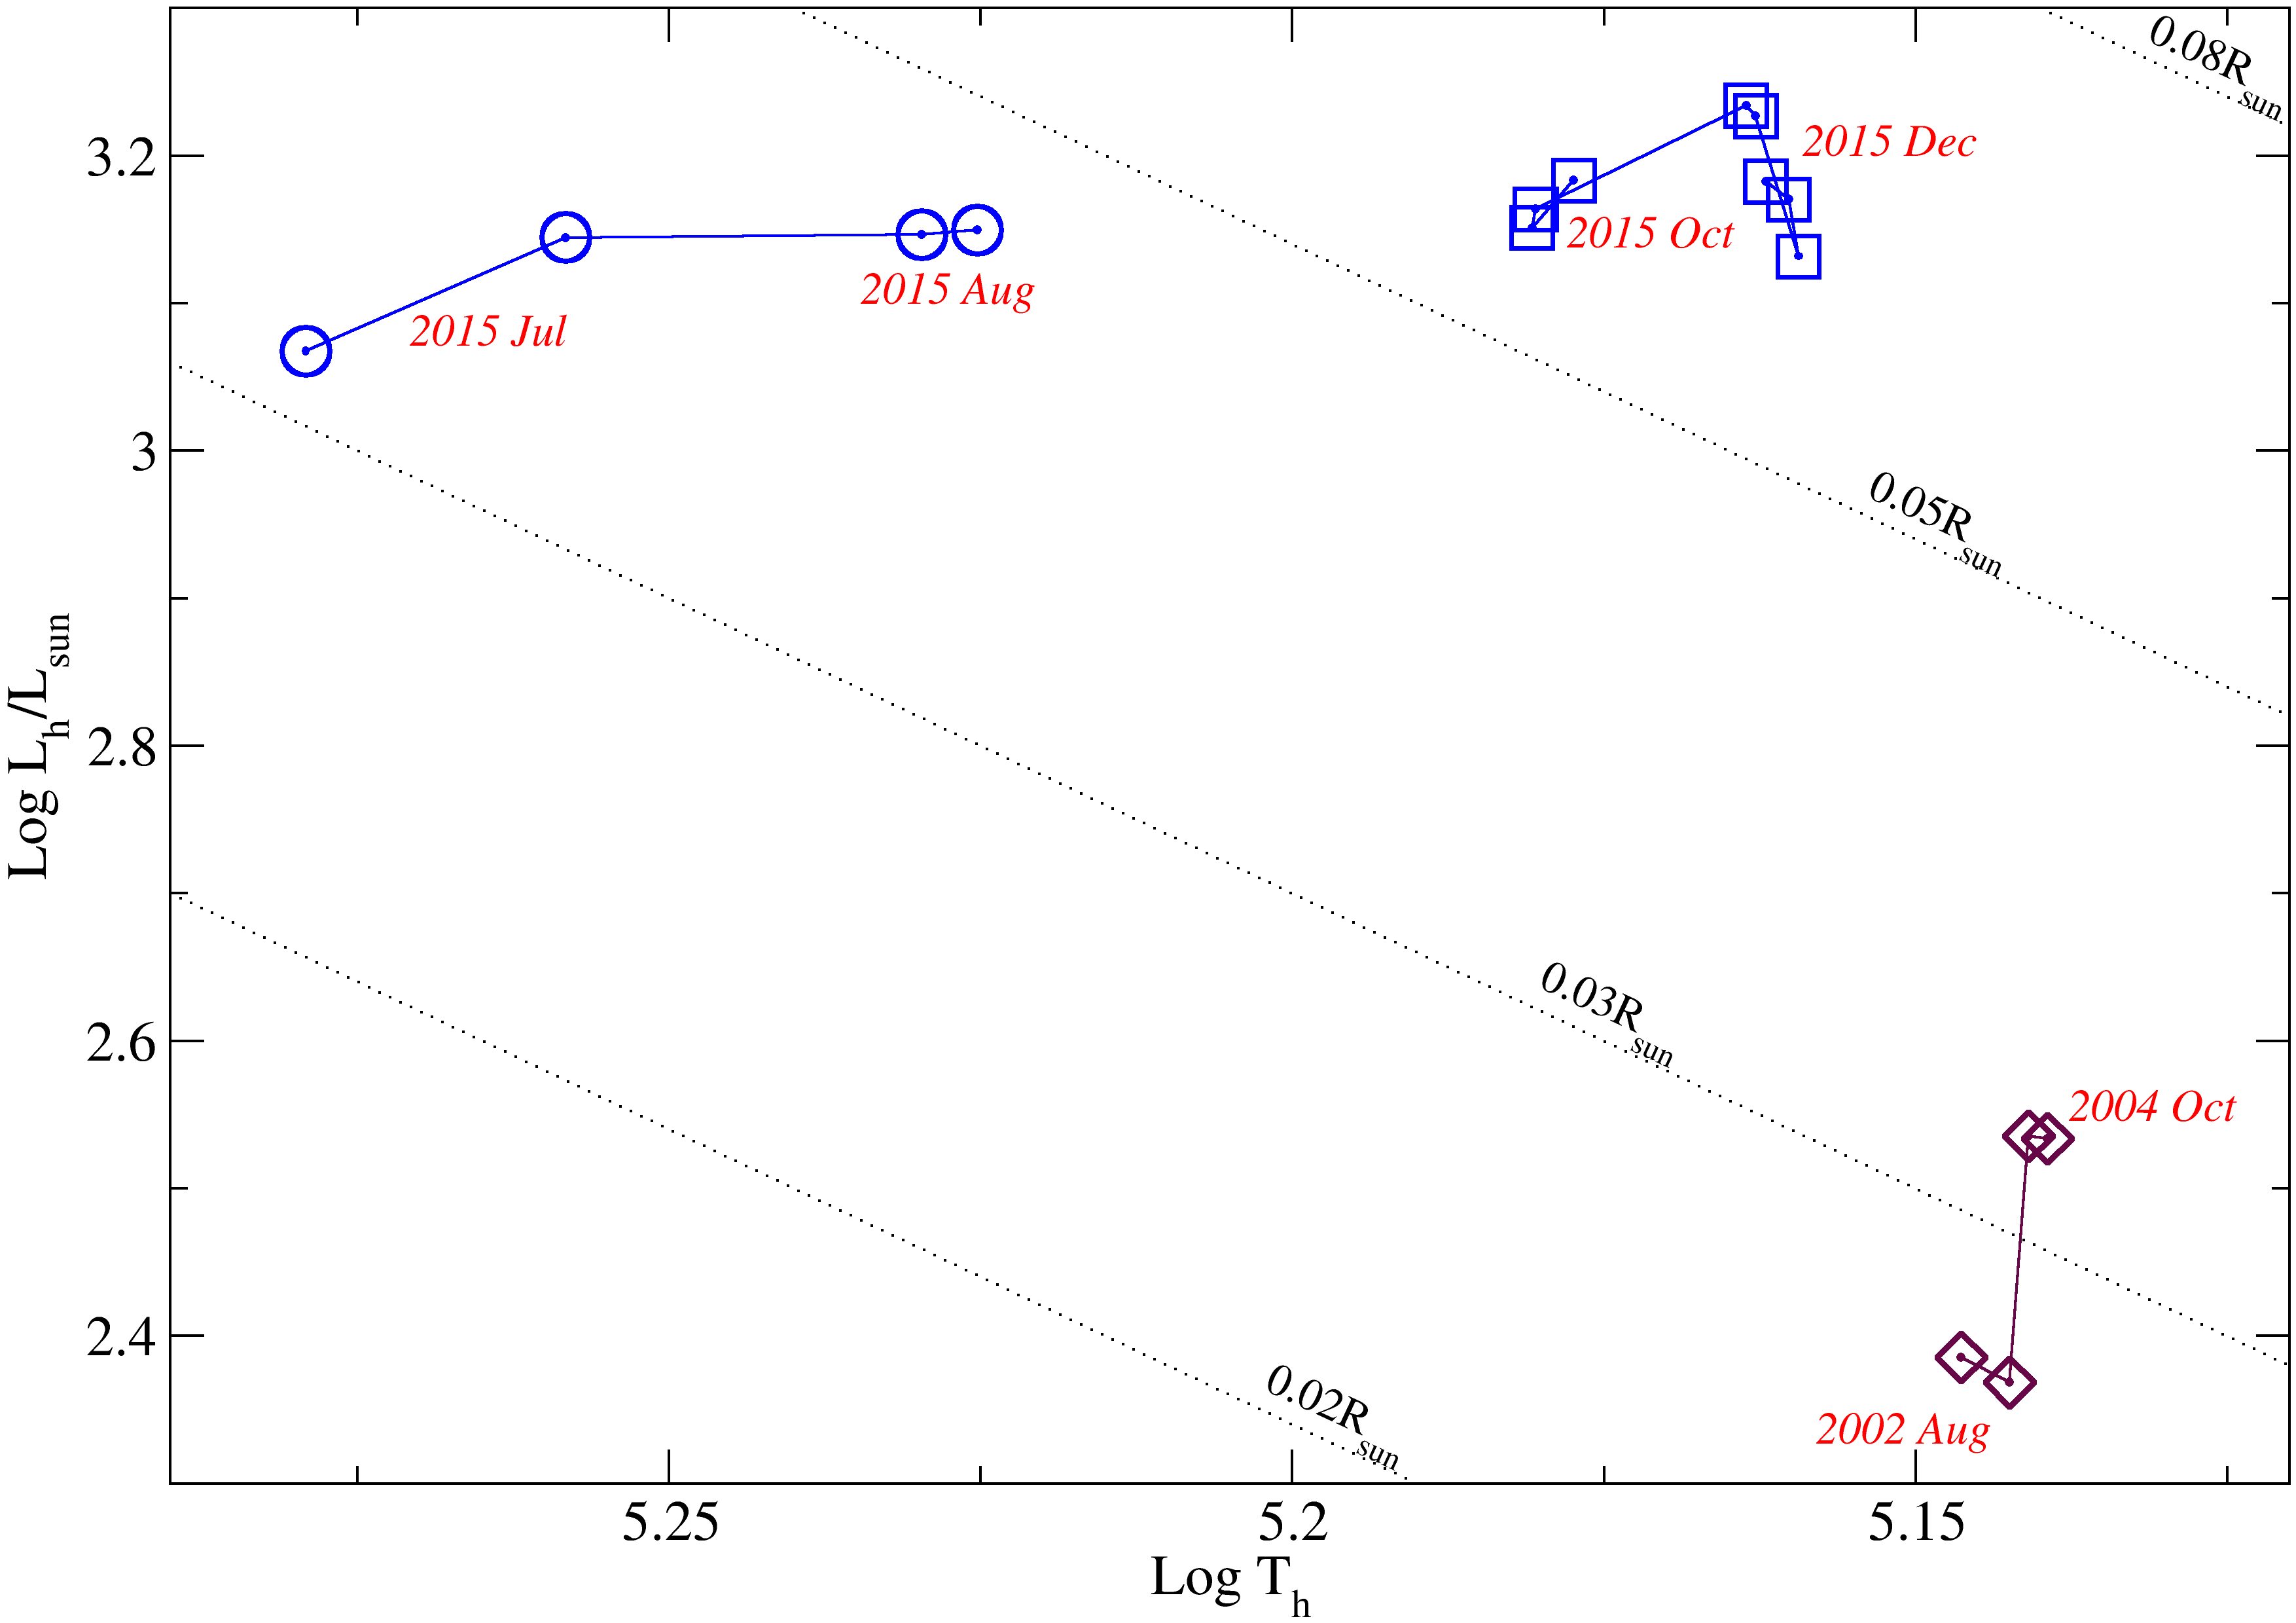
The temperature and the luminosity of the AG Peg hot component varied remarkably since its nova outburst. At the end of the 19th and the beginning of the 20th centuries, was of the order of 8 000–10 000 K and of the order of 1 000 L☉. In the mid-20th century, the values changed to 40 000–50 000 K and 3 000–3 500 L☉ respectively. Between 1970 and 1995, the temperature increased to K and luminosity dropped from L☉ to about 400 L☉ (see Muerset et al., 1991; Kenyon et al., 1993; Kenyon et al., 2001; Murset & Nussbaumer, 1994; Altamore & Cassatella, 1997, and references therein).
Zamanov & Tomov (1995) predict that the colliding winds stage will end, and accretion from the stellar wind will recommence, about the year 2001 and that the accretion will probably begin, when L☉. During the quiescence, we estimated a temperature of the hot component about 140 000 K and luminosity L☉ and L☉ for 2002 and 2004 respectively (Table 2 and Fig. 2). Surprisingly, the 2002 luminosity is practically identical to the value predicted by Zamanov & Tomov (1995).
Knowing the temperature and the luminosity of the hot component and supposing black body radiation, its radius can be estimated. The obtained values of are listed in Table 2. We estimated their accuracy to be of the order of 20%–30%. The radius of the AG Peg hot component in 2002–2004 is about 0.03 , which is in good agreement with the radii of the WDs of other symbiotic stars in quiescence (see for example Gutiérrez-Moreno et al., 1999).
3.3 The outburst
To explain the classical symbiotic outbursts, different models were proposed: (i) WD photosphere expansion at constant bolometric luminosity, caused by an accretion rate exceeding that of steady burning (Tutukov & Yungel’Son, 1976; Iben, 1982); (ii) thermal pulse or shell flash (Kenyon & Truran, 1983); (iii) dwarf nova-like accretion disk instability (Duschl, 1986a, b; Mikolajewska et al., 2002); (iv) "combination nova" model combining disk instabilities and enhanced thermonuclear shell burning (Sokoloski et al., 2006).
As we mention before, a gradual decrease of the dense, high velocity wind of the AG Peg hot component was observed during the last decades. We also have not found signs of such a wind in our optical spectra obtained in 2002 and 2004. Perhaps, Zamanov & Tomov (1995) were right and accretion from the red giant wind became possible around the year 2000. The hot component was accreting matter for about 15 years before the AG Peg outburst took place in 2015. The recurrence time of a classical symbiotic outburst, with optical amplitudes of several magnitudes, is roughly a decade (Kenyon, 1986). The major outbursts of AG Dra, for instance, occur on a time-scale 12–15 yr (Leedjärv et al., 2016).
Both AG Peg brightness increases show steeper rise and slower decline. The second event started before the first one has ended. Similar in shape, overlapping maxima are observed during some of the high activity stages of AG Dra and Z And (González-Riestra et al., 1999; Sokoloski et al., 2006; González-Riestra et al., 2008; Leedjärv et al., 2016; Skopal et al., 2009).
The evolution of the AG Peg hot component in the HR diagram during the outburst is shown in Fig. 6. The beginning of the outburst is marked by an increase of while the hot component radius remained unchanged. In the month after the first brightness maximum, the hot component luminosity varied between 1170 L☉ and 1410 L☉, without exceeding the estimated error. During the decline from the second maximum, between the end of October and the end of December, it was slightly higher in average, changing between 1355 L☉ and 1715 L☉ (again without exceeding the error). The temperature of the hot component decreased by 25-30% from July to December and the decline was steeper in the July-August period in comparison with the October-December period. The twofold increase of in December in comparison with the first maximum in July is decisive for the observed high during the decline from the second maximum. The strong increase of the hot component radius is, most probably, caused by a large expansion of the WD photosphere. Similar changes in the hot component temperature and radius are typical for some of the outbursts of Z And and AG Dra (Sokoloski et al., 2006; González-Riestra et al., 2008).
The changes of the Raman scattered O vi 6825 Å line in the spectrum of AG Peg discussed in Section 3.1.2 also resemble the behaviour of this line during the strong Z And and AG Dra outbursts. Numerous observations show that the Raman O vi emission is weak or completely disappears around the maxima of these type of outbursts. (Sokoloski et al., 2006; Skopal et al., 2009; Munari et al., 2009; Shore et al., 2010; Leedjärv et al., 2016).
The results presented here, show that in some respects, the recent outburst of AG Peg is similar to the strong outbursts of classical symbiotics like AG Dra and Z And. It is hard to say what caused it: accretion on the WD surface, disk instability or thermonuclear shell burning on the WD surface triggered by disk instability.
4 Conclusions
Inspiration for this work was the behaviour of AG Peg during the second half of 2015. We focus our studies on the outburst evolution using our own spectral observations, spectra obtained earlier in ESO and Asiago as well as archive data form AAVSO and MAST archives. Our main results and conclusions can be summarized as follows:
-
i)
The symbiotic nova outburst, affecting AG Peg for more than a century, had ceased before the recent, different in nature, outburst took over in 2015.
-
ii)
The earlier reported dense and massive high velocity wind from the hot component is not present anymore and accretion from the cool giant wind might have began around the year 2000.
-
iii)
Analysis of the evolution with time of the light curve, the EWs and the fluxes of different spectral features shows that in some respects the AG Peg outburst resembles those observed in the classical symbiotic stars like Z And and AG Dra.
-
iv)
A strong argument in favour of the similarity of the AG Peg outburst to the classical symbiotic outbursts is the observed behaviour of the Raman scattered O vi emission line at 6825 Å.
In conclusion, it could be said that the recent photometric and spectral variations of AG Peg place it among the classical Z And type symbiotic binary systems.
Acknowledgements
We acknowledge with thanks the variable star observations from the AAVSO International Database contributed by observers worldwide and used in this research. This research has made use of the NASA’s Astrophysics Data System, and the SIMBAD astronomical data base, operated by CDS at Strasbourg, France. Some of the data presented in this paper were obtained from the Mikulski Archive for Space Telescopes (MAST). STScI is operated by the Association of Universities for Research in Astronomy, Inc., under NASA contract NAS5-26555. Support for MAST for non-HST data is provided by the NASA Office of Space Science via grant NNX09AF08G and by other grants and contracts. We are thankful to U. Munari who made available the Asiago spectra of AG Peg obtained in 2002. We are grateful to the anonymous referee for valuable comments and suggestions. TT is very grateful to Svet Zhekov for the many useful discussions and Sz. Zywica for some help with English.
References
- Altamore & Cassatella (1997) Altamore A., Cassatella A., 1997, A&A, 317, 712
- Arkhipova & Dokuchaeva (1963) Arkhipova V. P., Dokuchaeva O. D., 1963, Soviet Ast., 6, 483
- Belyakina (1968) Belyakina T. S., 1968, Soviet Ast., 12, 110
- Belyakina (1970) Belyakina T. S., 1970, Astrophysics, 6, 22
- Belyakina (1985) Belyakina T. S., 1985, Information Bulletin on Variable Stars, 2697
- Boiarchuk et al. (1987) Boiarchuk A. A., Beliakina T. S., Tarasov A. E., Glagolevskii I. V., 1987, Ap&SS, 131, 775
- Bowen (1947) Bowen I. S., 1947, PASP, 59, 196
- Boyarchuk (1967a) Boyarchuk A. A., 1967a, Soviet Ast., 10, 783
- Boyarchuk (1967b) Boyarchuk A. A., 1967b, Soviet Ast., 11, 8
- Cowley & Stencel (1973) Cowley A., Stencel R., 1973, ApJ, 184, 687
- Duschl (1986a) Duschl W. J., 1986a, A&A, 163, 56
- Duschl (1986b) Duschl W. J., 1986b, A&A, 163, 61
- Eriksson et al. (2005) Eriksson M., Johansson S., Wahlgren G. M., Veenhuizen H., Munari U., Siviero A., 2005, A&A, 434, 397
- Eriksson et al. (2006) Eriksson M., Johansson S., Wahlgren G. M., 2006, A&A, 451, 157
- Fekel et al. (2000) Fekel F. C., Joyce R. R., Hinkle K. H., Skrutskie M. F., 2000, AJ, 119, 1375
- Fernie (1985) Fernie J. D., 1985, PASP, 97, 653
- Fitzpatrick (1999) Fitzpatrick E. L., 1999, PASP, 111, 63
- Fleming (1894) Fleming W. P., 1894, Astronomy and Astro-Physics (formerly The Sidereal Messenger), 13
- Gallagher et al. (1979) Gallagher J. S., Webbink R. F., Holm A. V., Anderson C. M., 1979, ApJ, 229, 994
- González-Riestra et al. (1999) González-Riestra R., Viotti R., Iijima T., Greiner J., 1999, A&A, 347, 478
- González-Riestra et al. (2008) González-Riestra R., Viotti R. F., Iijima T., Rossi C., Montagni F., Bernabei S., Frasca A., Skopal A., 2008, A&A, 481, 725
- Gutiérrez-Moreno et al. (1999) Gutiérrez-Moreno A., Moreno H., Costa E., 1999, PASP, 111, 571
- Heo & Lee (2015) Heo J.-E., Lee H.-W., 2015, Journal of Korean Astronomical Society, 48, 105
- Hutchings & Redman (1972) Hutchings J. B., Redman R. O., 1972, PASP, 84, 240
- Hutchings et al. (1975) Hutchings J. B., Cowley A. P., Redman R. O., 1975, ApJ, 201, 404
- Iben (1982) Iben Jr. I., 1982, ApJ, 259, 244
- Iijima (1981) Iijima T., 1981, in Carling E. B., Kopal Z., eds, Photometric and Spectroscopic Binary Systems. p. 517
- Kafka (2016) Kafka S., 2016, Observations from the AAVSO International Database, http://www.aavso.org
- Kenny & Taylor (2007) Kenny H. T., Taylor A. R., 2007, ApJ, 662, 1231
- Kenny et al. (1991) Kenny H. T., Taylor A. R., Seaquist E. R., 1991, ApJ, 366, 549
- Kenyon (1986) Kenyon S. J., 1986, The symbiotic stars
- Kenyon & Truran (1983) Kenyon S. J., Truran J. W., 1983, ApJ, 273, 280
- Kenyon et al. (1993) Kenyon S. J., Mikolajewska J., Mikolajewski M., Polidan R. S., Slovak M. H., 1993, AJ, 106, 1573
- Kenyon et al. (2001) Kenyon S. J., Proga D., Keyes C. D., 2001, AJ, 122, 349
- Lee (2000) Lee H.-W., 2000, ApJ, 541, L25
- Lee & Kang (2007) Lee H.-W., Kang S., 2007, ApJ, 669, 1156
- Lee & Park (1999) Lee H.-W., Park M.-G., 1999, ApJ, 515, L89
- Leedjärv et al. (2016) Leedjärv L., Gális R., Hric L., Merc J., Burmeister M., 2016, MNRAS, 456, 2558
- Lundmark (1921) Lundmark K., 1921, Astronomische Nachrichten, 213, 93
- Merrill (1916) Merrill P. W., 1916, Publications of Michigan Observatory, 2
- Merrill (1929a) Merrill P. W., 1929a, ApJ, 69
- Merrill (1929b) Merrill P. W., 1929b, Contributions from the Mount Wilson Observatory / Carnegie Institution of Washington, 381, 1
- Merrill (1942) Merrill P. W., 1942, ApJ, 95, 386
- Merrill (1951a) Merrill P. W., 1951a, ApJ, 113, 605
- Merrill (1951b) Merrill P. W., 1951b, ApJ, 114, 338
- Merrill (1959) Merrill P. W., 1959, ApJ, 129, 44
- Mikolajewska et al. (1997) Mikolajewska J., Acker A., Stenholm B., 1997, A&A, 327, 191
- Mikolajewska et al. (2002) Mikolajewska J., Kolotilov E. A., Shenavrin V. I., Yudin B. F., 2002, in Gänsicke B. T., Beuermann K., Reinsch K., eds, Astronomical Society of the Pacific Conference Series Vol. 261, The Physics of Cataclysmic Variables and Related Objects. p. 645
- Muerset et al. (1991) Muerset U., Nussbaumer H., Schmid H. M., Vogel M., 1991, A&A, 248, 458
- Muerset et al. (1995) Muerset U., Jordan S., Walder R., 1995, A&A, 297, L87
- Munari et al. (2009) Munari U., et al., 2009, PASP, 121, 1070
- Munari et al. (2013) Munari U., Valisa P., Dallaporta S., Cherini G., Righetti G. L., Castellani F., 2013, The Astronomer’s Telegram, 5258
- Murset & Nussbaumer (1994) Murset U., Nussbaumer H., 1994, A&A, 282, 586
- Nussbaumer & Vogel (1987) Nussbaumer H., Vogel M., 1987, A&A, 182, 51
- Nussbaumer et al. (1989) Nussbaumer H., Schmid H. M., Vogel M., 1989, A&A, 211, L27
- Nussbaumer et al. (1995) Nussbaumer H., Schmutz W., Vogel M., 1995, A&A, 293, L13
- Schmid (1989) Schmid H. M., 1989, A&A, 211, L31
- Schmid et al. (1999) Schmid H. M., et al., 1999, A&A, 348, 950
- Sekeráš & Skopal (2012) Sekeráš M., Skopal A., 2012, Baltic Astronomy, 21, 196
- Shore et al. (2010) Shore S. N., et al., 2010, A&A, 510, A70
- Skopal (2006) Skopal A., 2006, A&A, 457, 1003
- Skopal (2007) Skopal A., 2007, New Astron., 12, 597
- Skopal et al. (2007) Skopal A., Vaňko M., Pribulla T., Chochol D., Semkov E., Wolf M., Jones A., 2007, Astronomische Nachrichten, 328, 909
- Skopal et al. (2009) Skopal A., et al., 2009, ApJ, 690, 1222
- Skopal et al. (2012) Skopal A., Shugarov S., Vaňko M., Dubovský P., Peneva S. P., Semkov E., Wolf M., 2012, Astronomische Nachrichten, 333, 242
- Sokoloski et al. (2006) Sokoloski J. L., et al., 2006, ApJ, 636, 1002
- Stasińska & Tylenda (1986) Stasińska G., Tylenda R., 1986, A&A, 155, 137
- Swings & Struve (1940) Swings P., Struve O., 1940, ApJ, 91, 546
- Swings & Struve (1942) Swings P., Struve O., 1942, ApJ, 95, 152
- Tutukov & Yungel’Son (1976) Tutukov A. V., Yungel’Son L. R., 1976, Astrophysics, 12, 342
- Vogel & Nussbaumer (1994) Vogel M., Nussbaumer H., 1994, A&A, 284, 145
- Zamanov & Tomov (1995) Zamanov R. K., Tomov N. A., 1995, The Observatory, 115, 185
- Zamanov et al. (2005) Zamanov R. K., Bode M. F., Tomov N. A., Porter J. M., 2005, MNRAS, 363, L26
- Zhekov & Tomov (2016) Zhekov S. A., Tomov T., 2016, MNRAS, 461, 286