The deepest X-ray view of high-redshift galaxies: constraints on low-rate black-hole accretion
Abstract
We exploit the 7 Ms Chandra observations in the Chandra Deep Field-South (CDF-S), the deepest X-ray survey to date, coupled with CANDELS/GOODS-S data, to measure the total X-ray emission arising from 2076 galaxies at . This aim is achieved by stacking the Chandra data at the positions of optically selected galaxies, reaching effective exposure times of . We detect significant () X-ray emission from massive galaxies at . We also report the detection of massive galaxies at at a confidence level (), the highest significance ever obtained for X-ray emission from galaxies at such high redshifts. No significant signal is detected from galaxies at even higher redshifts. The stacking results place constraints on the BHAD associated with the known high-redshift galaxy samples, as well as on the SFRD at high redshift, assuming a range of prescriptions for X-ray emission due to X- ray binaries. We find that the X-ray emission from our sample is likely dominated by processes related to star formation. Our results show that low-rate mass accretion onto SMBHs in individually X-ray-undetected galaxies is negligible, compared with the BHAD measured for samples of X-ray detected AGN, for cosmic SMBH mass assembly at high redshift. We also place, for the first time, constraints on the faint-end of the AGN X-ray luminosity function () at , with evidence for fairly flat slopes. The implications of all of these findings are discussed in the context of the evolution of the AGN population at high redshift.
keywords:
methods: data analysis – surveys – galaxies: active – galaxies: evolution – galaxies: high-redshift – X-rays: galaxies1 Introduction
Several empirical relations exist between the masses of Super-Massive Black Holes (SMBHs), which are thought to reside in the centres of nearly all galaxies, and the properties of the host galaxies themselves, such as mass, luminosity and velocity dispersion of the bulge (e.g. Magorrian et al. 1998; Ferrarese & Merritt 2000, Gebhardt et al. 2000; Marconi & Hunt 2003, Gültekin et al. 2009). Such relations may be the results of an evolutionary path that SMBHs and host galaxies share, despite their very different physical scales. This so-called “BH-galaxy co-evolution” is also suggested by the similar redshift evolution of the cosmic Star Formation Rate Density (SFRD) and BH Accretion Rate Density (BHAD): both quantities peak at and decrease toward lower and higher redshift (e.g. Boyle & Terlevich 1998; Marconi et al. 2004; Hopkins & Beacom 2006; Aird et al. 2010, 2015; Delvecchio et al. 2014). Moreover, both galaxies and Active Galactic Nuclei (AGN, which trace the nuclear accretion and hence the SMBH mass growth) are characterized by a “downsizing” evolution, in the sense that the build-up of massive galaxies and the peak of the space density of luminous AGN occurred at earlier cosmic times () than those of less massive galaxies and less luminous AGN (e.g. Cowie et al. 1996; Barger et al. 2005; Hasinger et al. 2005; La Franca et al. 2005; Thomas et al. 2005; Damen et al. 2009; Ebrero et al. 2009, Yencho et al. 2009, Aird et al. 2010; Delvecchio et al. 2014; Ueda et al. 2014). This interplay between SMBH and galaxy (see Brandt & Alexander 2015, and references therein) is expected to be crucial during the phases of galaxy formation in the Early Universe. However, while SFRD evolution has been studied up to (e.g. Bouwens et al., 2015), our knowledge of AGN evolution is largely limited to later cosmic times. In fact, despite the discovery of an increasing number of luminous () quasars in the last 15 years (e.g. Willott et al., 2003, 2009; Fan et al., 2006a, b; Jiang et al., 2008, 2009; Mortlock et al., 2011; Venemans et al., 2013, 2015b, 2015a; Bañados et al., 2014; Wu et al., 2015), the bulk of the AGN population at high redshift (i.e. low-to-moderate luminosity and possibly obscured AGN) is still largely unknown.
Besides the issue of galaxy formation and evolution, shedding light on the population of low-to-moderate luminosity () AGN at is also mandatory to unveil SMBH assembly processes in the early Universe. The two most promising classes of models are usually referred to as “light seeds” models, whereby the primordial black holes have masses of and are the remnants of Pop III stars, and “heavy seeds” models, which ascribe the formation of black holes with masses to the direct collapse of massive clouds of pristine gas (see Volonteri 2010 and Haiman 2013 and references therein). The AGN luminosity functions predicted by different seeding models are indistinguishable at low redshift (where the BH occupation fraction has been recently used to test seeding models, with inconclusive results; e.g. Miller et al. 2015; Trump et al. 2015) but start to diverge at , particularly with regard to the evolution of the faint end of the AGN luminosity function.
While wide-field optical/IR surveys (e.g. SDSS, UKIDSS) coupled with dedicated spectroscopic campaigns (e.g. Mortlock et al., 2011; Venemans et al., 2013, 2015b), have been successfully used to select high-redshift luminous () QSOs, AGN with luminosities below the break of the luminosity function can currently be detected only by deep X-ray surveys. In fact, X-rays are much less affected by galaxy dilution and obscuration than the optical/near-IR bands (e.g. Brandt & Alexander, 2015). This is particularly important when searching for low-to-moderate luminosity () AGN at high redshift as emission from the host galaxy can outshine the faint nuclear radiation in the optical band. Moreover, many models of SMBH growth predict that most of the mass assembly in the early Universe occurs during phases of strong obscuration, when nuclear emission is completely hidden in the optical/IR bands (e.g. Hopkins et al., 2008). Hence it is not surprising that many authors in recent years focused on the range and tried to assess the evolution of high-redshift AGN exploiting data from X-ray surveys like the XMM-Newton (Brusa et al., 2009) and Chandra (Civano et al., 2011, Marchesi et al. submitted) observations in the COSMOS field, the 4 Ms Chandra Deep Field South (CDF-S; Vito et al., 2013), the Subaru-XMM Deep Survey (SXDS; Hiroi et al., 2012) or from a combination of surveys (Kalfountzou et al., 2014; Vito et al., 2014; Georgakakis et al., 2015). All of these works found that the space density of luminous () AGN declines exponentially by a factor of from to 5. However, even the works exploiting the very deep 4 Ms CDF-S data (Xue et al., 2011) could not collect enough low-luminosity AGN to assess the evolution of the faint end of the luminosity function at . In particular, Vito et al. (2014) and Georgakakis et al. (2015) found that a Pure Density Evolution (PDE) model is the best representation of the AGN luminosity function at , although the data in these works were insufficient to disentangle such a model from a more complex Luminosity-Dependent Density Evolution (LDDE) model, which is often invoked for the low-redshift AGN population (e.g. Miyaji et al. 2000, 2015; Ueda et al. 2003; Ueda et al. 2014; Hasinger et al. 2005; La Franca et al. 2005; Silverman et al. 2008; Ebrero et al. 2009; Yencho et al. 2009; Fotopoulou et al. 2016; but see also Aird et al. 2010, 2015; Buchner et al. 2015; Ranalli et al. 2015). Moreover, the lack of a significant number of X-ray detected AGN at (Vignali et al., 2002; Steffen et al., 2004; Barger et al., 2005; Civano et al., 2012; Weigel et al., 2015), poses a high-redshift limit to those works.
Stacking the X-ray images at the positions of known galaxies can be used to efficiently increase the sensitivity by large factors and thereby to investigate the average properties of the population of low-luminosity AGN, that are individually undetected even in the deepest surveys. In previous works, Cowie et al. (2012), Basu-Zych et al. (2013a) and Treister et al. (2013) did not detect significant X-ray signal at by applying their stacking procedures to the deep 4 Ms CDF-S data. Cowie et al. (2012), in particular, concluded that the X-ray emission they retrieved from high-redshift galaxies was consistent with pure stellar processes. The increasing contribution from star-forming galaxies to the total X-ray emission at the lowest fluxes probed by deep surveys (Lehmer et al., 2012) poses a challenge to the studies of low-luminosity AGN: high- and low-mass X-ray binaries in galaxies can produce a luminosity up to (e.g. Ranalli et al., 2003, 2005). On the one hand this contribution is treated as contaminating emission by the works aimed at studying AGN, but on the other hand it could be used to derive relations between the X-ray luminosity and the Star Formation Rate (SFR) of a galaxy (e.g. Bauer et al. 2002, Ranalli et al. 2003, Basu-Zych et al. 2013b, Symeonidis et al. 2014, Lehmer et al., accepted), and hence place important constraints on galaxy evolution at high redshift.
Stacking procedures with deep X-ray data rely on accurate knowledge of the positions and redshifts for a large number of objects of interest: this typically requires a combination of deep X-ray and optical/near-IR observations. The 7 Ms CDF-S (Luo et al., in prep.) is the deepest X-ray survey to date, reaching a flux limit of , and is one of the fields with the most-complete and deepest multiwavelength coverage in the sky, e.g. it is part of the Great Observatories Origins Deep Survey (GOODS-S; Dickinson et al., 2003). In particular, it was observed with the near-infrared WFC3 on board the Hubble Space Telescope (HST) in the Cosmic Assembly Near-Infrared Deep Extragalactic Legacy Survey (CANDELS; Grogin et al., 2011; Koekemoer et al., 2011) plus the Hubble Ultra-Deep Field (UDF; Beckwith et al., 2006), reaching a depth of in the H-band (Guo et al., 2013). Thanks to the unprecedented multiwavelength coverage of CANDELS/ GOODS-S at faint magnitudes and to the superb Hubble spatial resolution, the CANDELS team compiled a high-quality spectroscopic and photometric redshift catalog (Dahlen et al., 2013; Santini et al., 2015).
In this work we exploit the data from the 7 Ms CDF-S and perform a stacking analysis of samples of CANDELS-selected galaxies at . Our purpose is to place constraints on the BHAD and on the faint end of the AGN luminosity function at high redshift. Moreover we will use the stacked X-ray signal to derive information on the star-formation properties of high-redshift galaxies. Throughout this paper we will use a , , and cosmology. Errors and upper limits are quoted at the confidence level, unless otherwise noted. One Chandra pixel is .
2 The stacking procedure
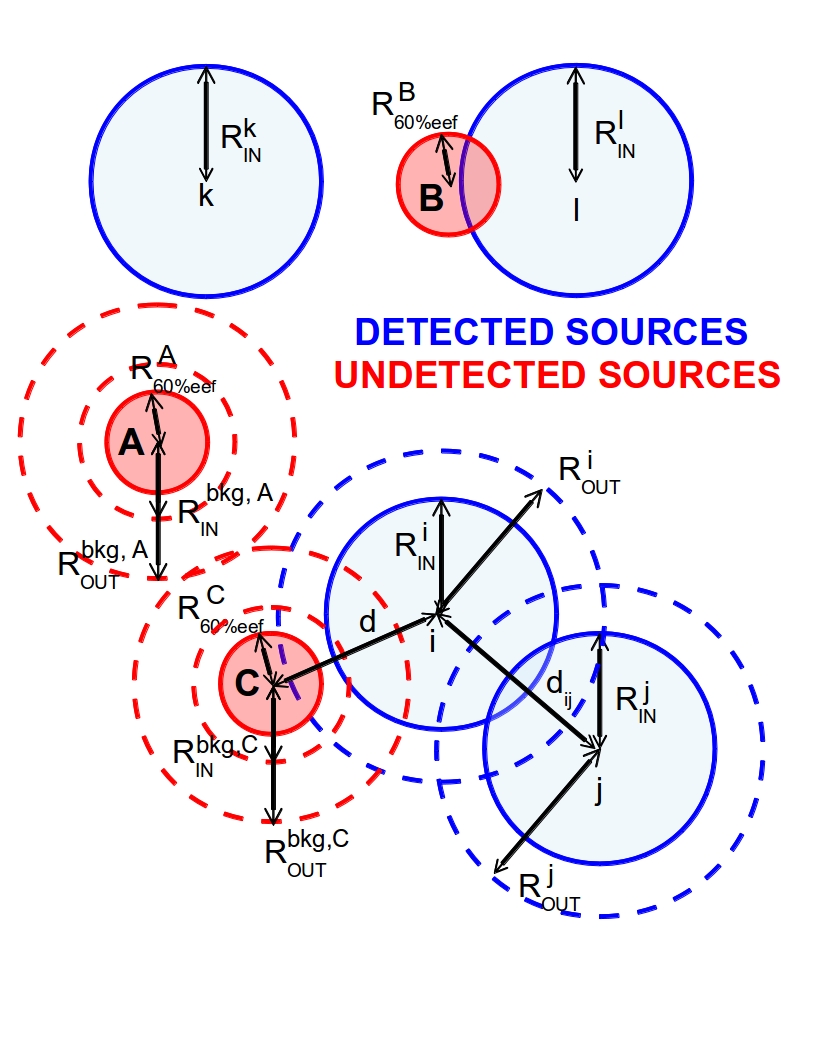
Here we briefly describe the main steps of the aperture photometry procedure used to estimate the net count rate at given positions on the X-ray image (see Fig. 1 for a visual representation):
-
1.
Through detailed simulations of the Chandra observations in the CDF-S, we derived a parametrization of the Chandra Point Spread Function (PSF) as a function of the off-axis angle (see Appendix A).
-
2.
we compute the radius corresponding to the 90% Encircled Energy Fraction (EEF; at 1.5 keV) at the position of each source to be stacked ( ), , and each detected X-ray source ( ), .
-
3.
For each , we define an annulus region in which the background of the photometry is evaluated centred at the position to be stacked with inner radius and outer radius .111Different choices of the inner radius factor (1.0-1.2) and annulus width (10-30 pixels) do not affect significantly the final results. Although the background is sampled better at large as the annulus widths are fixed (to 20 pixels), the number of photons detected at positions close to the aim point is sufficient to estimate the background well. While, on average, there is no offset between the optical and X-ray positions in the 7 Ms CDF-S (see § 3.2), the individual offsets are spread around zero. Therefore, stacking the X-ray emission at the optical positions would return a lower EEF than the expected one at a given . To account for this effect statistically, in Appendix A we include the spread of the X-ray-optical position offsets in the simulations of the Chandra PSF in the CDF-S. When masking the detected X-ray sources we use the nominal PSFs, while when stacking the optical positions we used the PSFs corrected for the statistical offset of the positions.
-
4.
For each , we define a background annulus with inner radius , where , 1.75, and 2 for with , , and net counts, respectively, and outer radius .
-
5.
We masked all of the . For every , the masked region has a radius of . This radius is large enough to mask all the emission of even the brightest X-ray sources. The background used to refill the masked region is evaluated from the background annulus of the detected source (defined in the previous point). For any to be masked, the procedure checks that every other is located at a distance , otherwise is also masked to prevent contamination in the annulus region where the background to refill the masked area is evaluated.
-
6.
For each , we defined the radius of the circular region used to compute the source photometry as the radius corresponding to the 80%, 75%, 60%, and 40% EEF for , , , and , respectively. We motivate this choice through simulations described in § 2.1 below.
-
7.
For each , we compute the distance to every . If , would fall in a masked region and it is therefore excluded from the stacking analysis. The fraction of CANDELS area lost because of the presence of an X-ray detected source (and therefore excluded by the stacking procedure) is .
-
8.
The net photometry of each is computed by rescaling the background count rate by the ratio of the source and background region areas and subtracting it from the count rate measured in the source region. The net count rate of each is divided by an aperture-correction factor 0.80, 0.75, 0.60, and 0.40 for sources at , , , and , respectively, in order to obtain the net count rate corresponding to the 100% EEF.
-
9.
The total (i.e. summed over all ) count rate and errors are computed through a bootstrapping procedure: given a list of N positions to be stacked and the relative net count rates, we constructed 1000 new lists by randomly picking up a number N of net count rates from the original list, allowing for repetition. We therefore derive a distribution of 1000 total count rates. Its mean and scatter is defined to be the final total net count rate and uncertainty.
2.1 Validation of the procedure through simulations
To check the stacking procedure, we applied it to a simulated image of the CDF-S. In order to keep the required computation time reasonably low, the checking is based on only the first 54 Chandra observations, for a total of (Xue et al., 2011). While the Chandra PSF is known to vary along both the radial and azimuthal directions, the similar aim points and different roll angles of the Chandra observations in the CDF-S smear out the azimuthal variations of the PSF in different pointings. In practice, the final PSF at a given point on the field is fairly well determined by only its angular separation from the average CDF-S aim point, which does not change significantly with the inclusion of the most recent Chandra pointings.
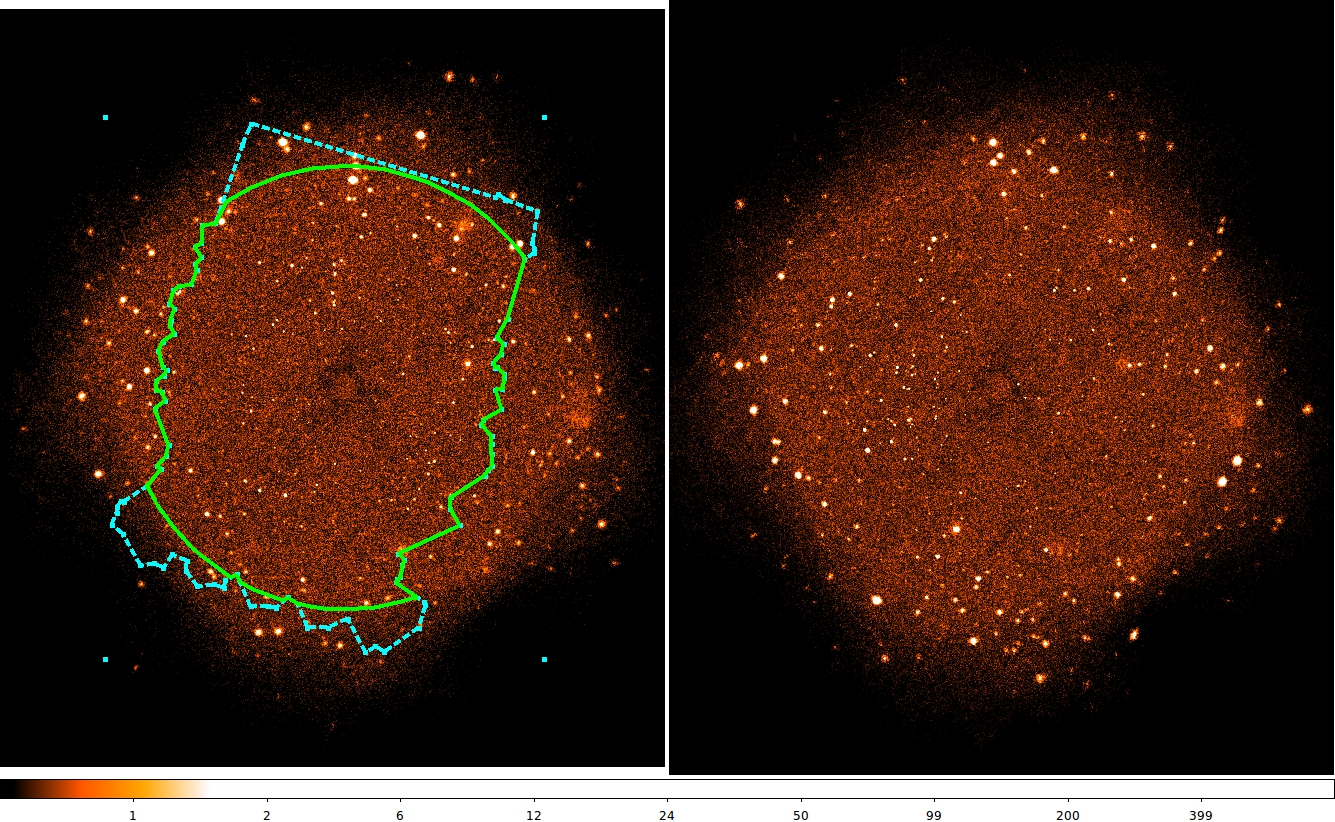
We simulated a mock catalog of AGN whose soft-band flux distribution follows the logN-logS relation from Gilli et al. (2007) and a clustering recipe was utilized to produce the mock positions. Technical details on the simulations are given in Appendix A. To reproduce the real case, we merged the final image of simulated sources with the soft-band background map, derived by masking all the X-ray detected sources (Xue et al., 2011) in the real merged soft-band 4 Ms CDF-S image following the procedure described in § 2. The output is a 4 Ms-like soft-band image of mock sources with real background (see Fig. 2 for a comparison with the real image). We run wavdetect with a threshold of to create a mock catalog of detected sources and we derived the net counts for each undetected source following the above-described procedure and using the fitted radii corresponding to different EEF, including the statistical effect of X-ray-optical offsets (see Appendix A), for the aperture photometry. We restricted the field of investigation to the area within from the 4 Ms CDF-S average aim point because at larger off-axis angles, where the Chandra sensitivity drops and a smaller number of pointings overlap, the sharp gradients in the exposure caused issues during the evaluation of the background.222 In presence of strong exposure gradients, the background counts in a circular region is not always well described by simply rescaling the background counts in a surrounding annulus region. We apply the same off-axis angle cut to the real data in § 3.1.
The simulation software records the number of detected X-ray photons for all the simulated sources, including those undetected by wavdetect. We checked the accuracy of the stacking code by applying the aperture photometry procedure to each undetected simulated source and comparing the number of retrieved photons with that recorded by the simulation software for that very source, applying the proper EEF correction. We found an overall agreement within uncertainty.
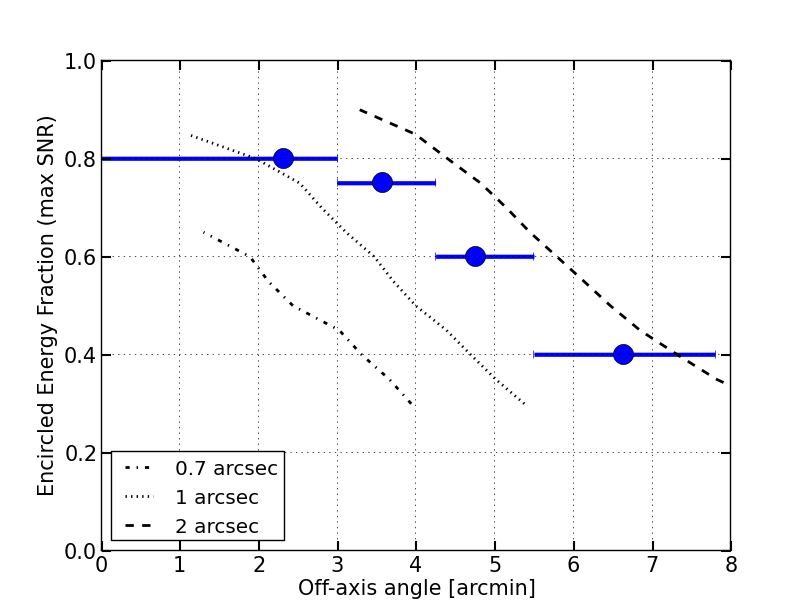
We have also used the photometry of the simulated image to check which EEF returns the highest output signal-to-noise ratio (SNR), computed as the total count rate divided by its dispersion as derived from the bootstrap procedure (see end of § 2), as a function of . We considered four bins, chosen to include similar numbers of real CANDELS galaxies. Fig. 3 shows the EEF returning the maximum SNR in each bin. We therefore chose to use the radii corresponding to these EEF at different to perform aperture photometry of real sources. For reference, Fig. 3 also reports three curves corresponding to constant radii of , and . We note that, while the EEF corresponding to the maximum SNR decreases at increasing off-axis angles, the angular dimension of the extraction radii increases from at to at . This behaviour was already pointed out in previous works (e.g., Cowie et al., 2012), and it is due to the non-trivial radial variations of the Chandra PSF, effective area and background.
3 Stacking CANDELS galaxies at
3.1 The samples
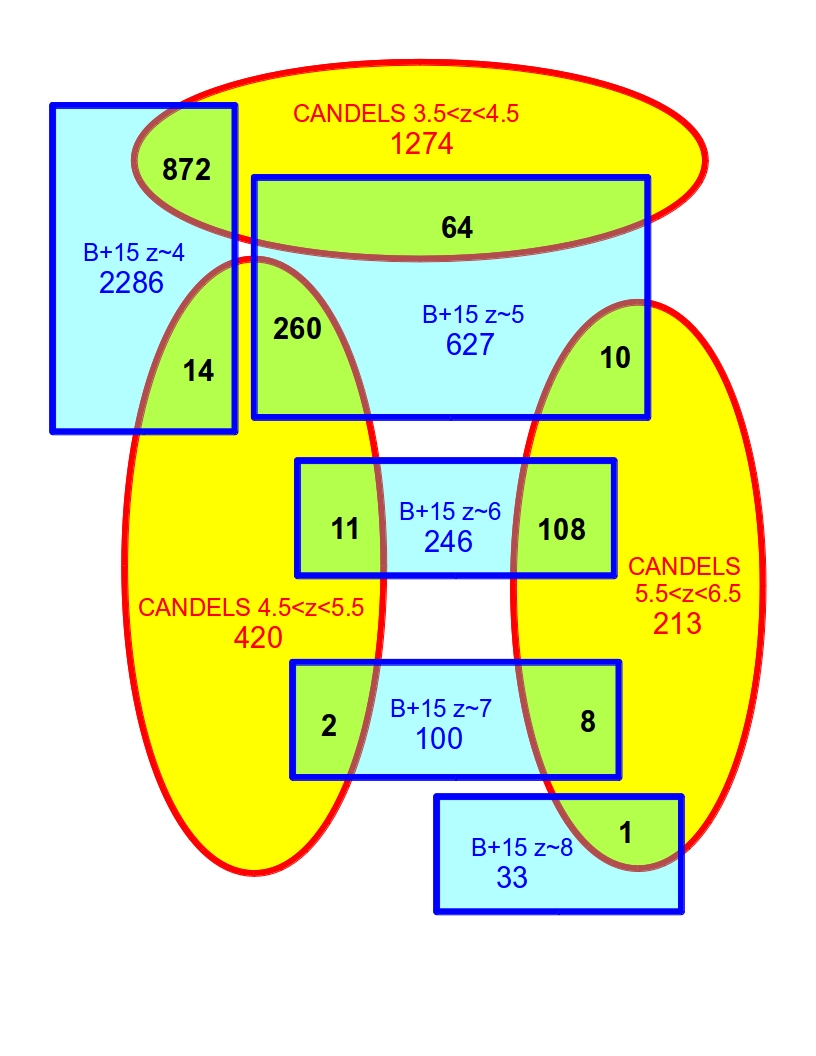
We selected three samples of galaxies with from the 7 Ms CDF-S average aim point from the GOODS-S/CANDELS catalog (Guo et al., 2013; Santini et al., 2015) in different redshift bins at using both spectroscopic (available for only of the galaxies in the final samples) and photometric redshifts as provided by Santini et al. (2015). Photometric redshifts at high redshift are generally fairly accurate, as the Lyman-break, one of the most prominent spectral features in galaxies, is redshifted into the optical bands and is recognizable in the observed galaxy Spectral Energy Distribution (SED). Moreover, the CANDELS photometric dataset is the deepest available and photometric redshifts based on that are expected to be very accurate (Santini et al., 2015). Nonetheless, in Appendix B we investigate photometric-redshift accuracies as a function of redshift, and in Appendix C we assess the impact of redshift uncertainties on the stacking results.
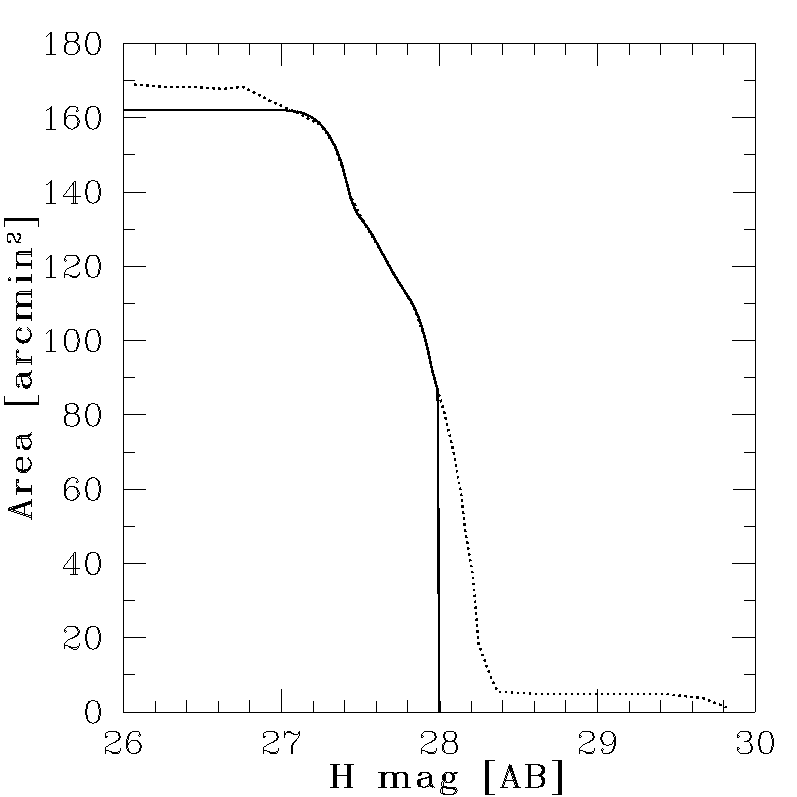
Santini et al. (2015) provide estimates of and SFR for every CANDELS galaxy. In particular, multiple estimates of SFR were computed for each object under different physical assumptions (e.g. initial mass functions, star formation histories, etc.) and using different fitting methods and codes. In this work, we used the estimates flagged as SFR_2a_tau in Santini et al. (2015), which were derived assuming a Chabrier IMF and an exponentially decreasing SFH. The mean SFR and and relative uncertainties for each sample were derived applying a bootstrap procedure. The distributions of redshift, magnitude, stellar mass, specific Star Formation Rate () and net X-ray count rate (from the stacking procedure) for all the individual galaxies are shown in Fig. 5, 6 and 7 for samples at , and , respectively. Tab. 1 reports the main characteristics of the considered samples. For each redshift interval, we stacked both all the galaxies and only the most massive ones. The mass cut we applied in the latter case corresponds to the median mass in each redshift interval as reported in Tab. 1. The CANDELS sky-coverage as a function of H magnitude is reported in Guo et al. (2013). Rejecting the area at resulted in an area loss of . The CANDELS field used in this work (green region) is compared to the original one (blue region) in Fig. 2. Using the resulting sky-coverage and the H magnitudes provided by Guo et al. (2013), we assigned each galaxy a weight factor , to properly account for the incompleteness due to the smaller sensitive CANDELS area at faint magnitudes, where 162 arcmin2 is the maximum (i.e. for bright magnitudes) field covered by CANDELS in the CDF-S (see Fig. 4). We applied a cut in magnitude to the sample, excluding from the stacking analysis galaxies with , as these few galaxies would dominate the results due to their large weighting factors . The final CANDELS sky-coverage (rescaled and cut at ) is shown in Fig. 4. No further cuts apart from those in magnitude and were applied to the samples of CANDELS galaxies. The magnitude threshold we used, , corresponds at to a stellar mass of a few (see Fig. 5), a factor of lower than the Large Magellanic Cloud mass (e.g. van der Marel et al., 2002). While a large number of galaxies are expected to have magnitudes fainter than that, unless most of the BH growth occurred in galaxies, there is no reason to believe that their exclusion from the stacking analysis would significantly affect the results of this work. In particular, in § 3.3 we will show that most of the detectable signal comes from the most-massive galaxies, with magnitudes well brighter than the CANDELS limiting magnitude.
| bin | N (Nw) | Exp. | |||||||
| (1) | (2) | (3) | (4) | (5) | (6) | (7) | (8) | (9) | (10) |
| all | 1393 (1441) | 3.90 | 2.02 | 2.36 | |||||
| 662 (667) | 3.91 | 3.74 | |||||||
| all | 453 (472) | 4.90 | 0.87 | 0.98 | |||||
| 217 (222) | 4.92 | 2.04 | 2.71 | ||||||
| all | 230 (241) | 5.93 | |||||||
| 111 (113) | 5.93 | 0.25 | 0.25 |
(1) redshift bin; (2) mass selection: for every redshift bin we first stacked all the galaxies and then the most massive ones, defined as those with larger than the median in that bin; (3) number of CANDELS stacked galaxies and, in parentheses, corresponding weighted number of galaxies (Eq. 1). Note that the stacked number of galaxies in the “massive” samples is close but not equal to half the number of galaxies when no mass cut is applied. The reason is that the mass cut is the median mass of galaxies in the redshift bin, including the galaxies which are not stacked due to their proximity to (or identification with) an X-ray detected source. (4) median weighted redshift (Eq. 2); (5) total exposure time; (6) total (i.e. corrected for the aperture of the extraction radii) weighted net count-rate in the soft band, (7) corresponding total flux, (8) signal-to-noise ratio (SNR) derived from the bootstrap procedure, (9) fraction of runs of the random-position stacking returning a net count rate larger than that found for the sample of real galaxies, based on 10000 runs, and (10) corresponding confidence level. ∗For this sample we used 50000 runs.
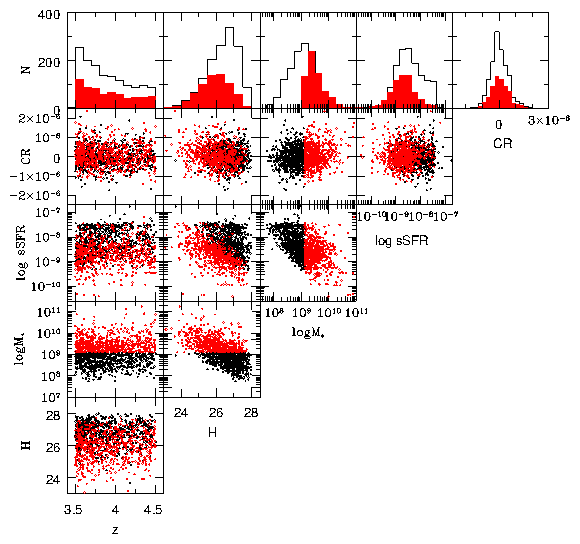
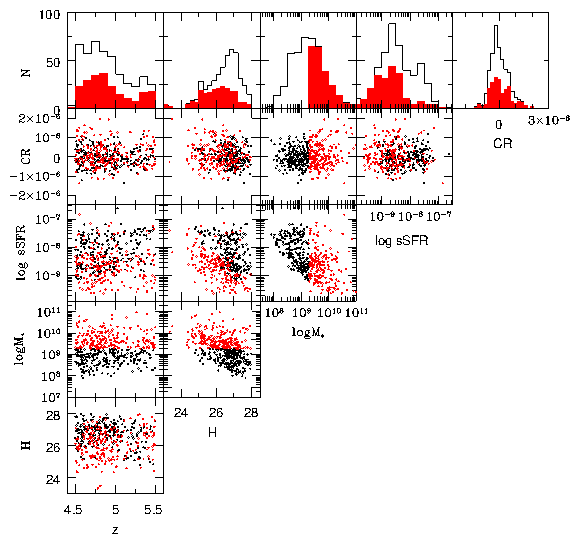
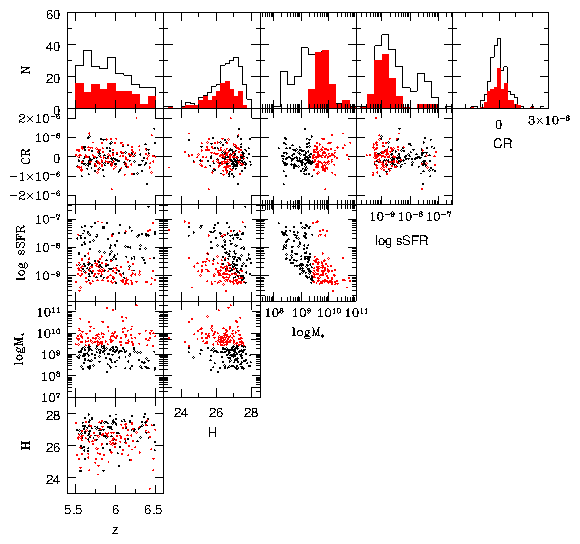
3.2 Stacking results
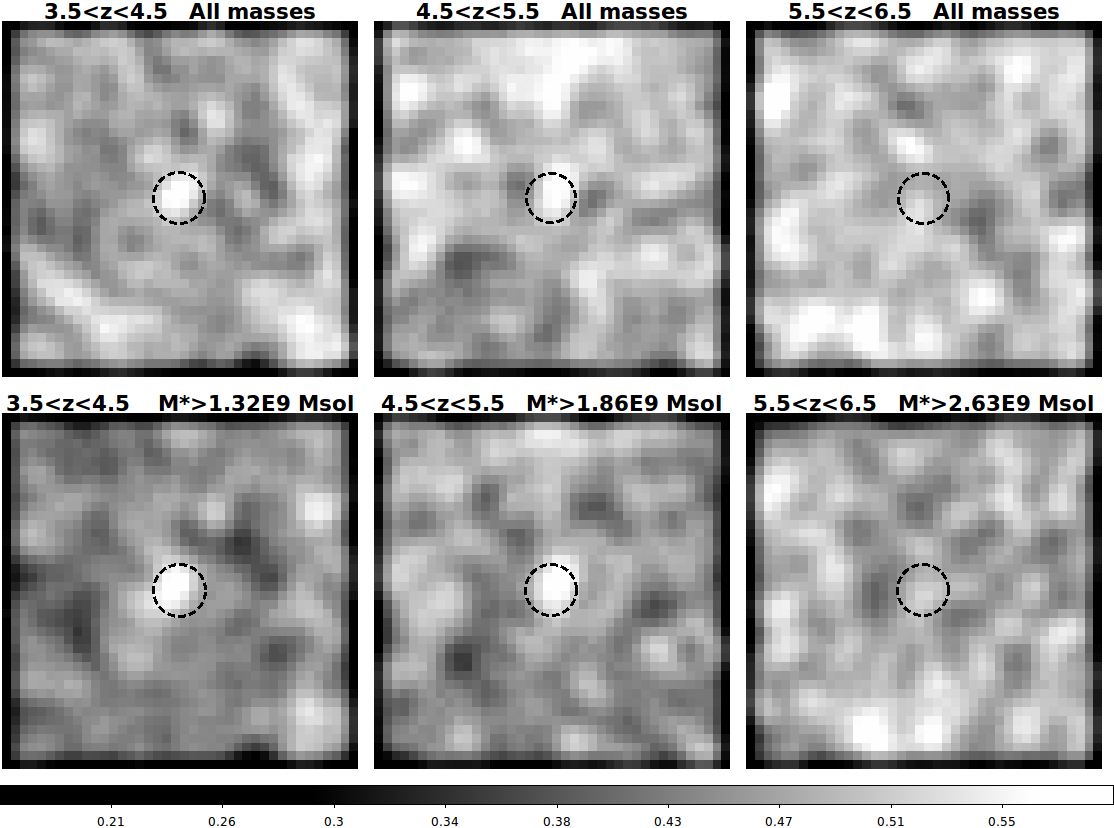
We applied the stacking procedure described in § 2 to the 7 Ms CDF-S soft-band ( keV) image for the CANDELS galaxy samples, using the X-ray catalogue of Luo et al. (in prep) to locate the X-ray detected sources. The stacked X-ray images in the soft band are shown in Fig. 8.
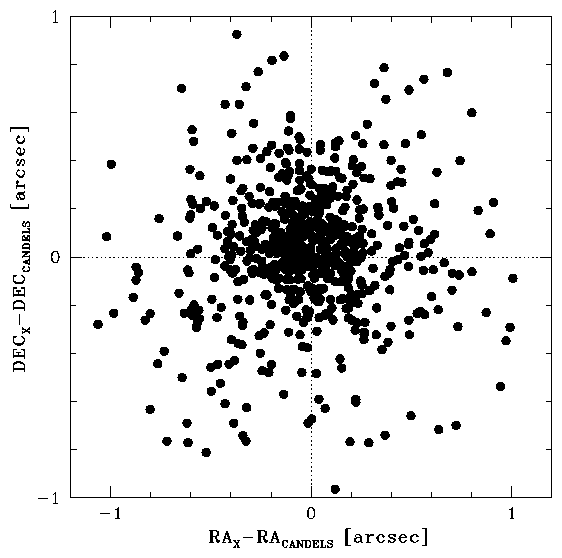
We checked for a possible systematic positional offset between the 7 Ms CDF-S and CANDELS surveys by cross-matching the positions of the sources in the two catalogs within a matching radius and computing the offset in RA and DEC between the X-ray and optical images for each matched source (Fig. 9). We quantified the median offset in each direction and its uncertainty through a bootstrap procedure, finding and . All of these values are significantly smaller than both the radii used for the aperture photometry and the Chandra positional uncertainty. However, while on average there is no offset between the X-ray and optical positions, the offset distribution is scattered around zero, with a dispersion spanning from on axis to at . As, especially on-axis, the dispersion is comparable to the size of the region used to perform the aperture photometry, in Appendix A we statistically took into account this effect in order not to underestimate the EEF.
Tab. 1 reports for each stacked sample the total number of individual (N) and weighted () sources, where
| (1) |
the average weighted redshift
| (2) |
the total equivalent exposure time and the total (i.e. summed) weighted net count rate
| (3) |
where is the aperture correction and takes values 0.80, 0.75, 0.60 , 0.40 at , , , , respectively. The values and their errors were derived by using a bootstrap procedure, as stated at the end of § 2 and were then converted into total weighted fluxes.333 As we used radii corresponding to EEF=0.6, this correction is . The conversion factor from count rate to flux was derived with PIMMS444http://heasarc.nasa.gov/docs/software/tools/pimms.html assuming a power-law with (a reasonable value for X-ray emission related to both star-formation and AGN in the rest-frame band, up to high values of column density in the redshift ranges of interest; e.g. Tozzi et al. 2006; Mineo et al. 2012) and Galactic . We took into account the different Chandra Cycles during which the observations were taken by weighting the conversion factor of each pointing using the relative exposure time. Different assumptions for do not alter significantly the conversion factor and would result in fluxes well within the errors we consider. These flux values are reported in column 7 of Tab. 1.
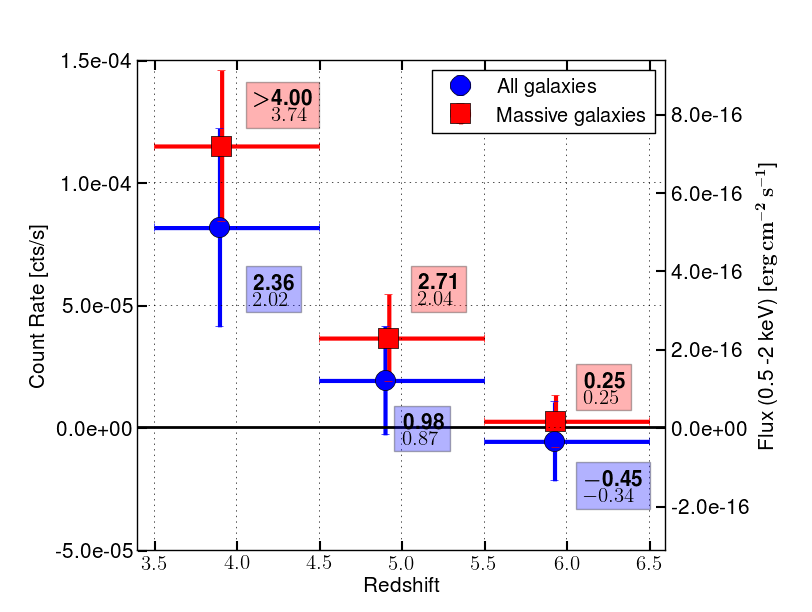
Fig. 10 shows the net count rates for the different samples as derived with the stacking analysis and the corresponding signal-to-noise ratios (SNR). The significance of the putative detection can be approximated by the ratio of the total net count rate and its error (column 6 in Tab. 1). According to this, we detected X-ray emission with high significance () only in the half of most-massive galaxies at . We also report detections with lower significance () for the whole sample of galaxies and for the half of most-massive galaxies at .
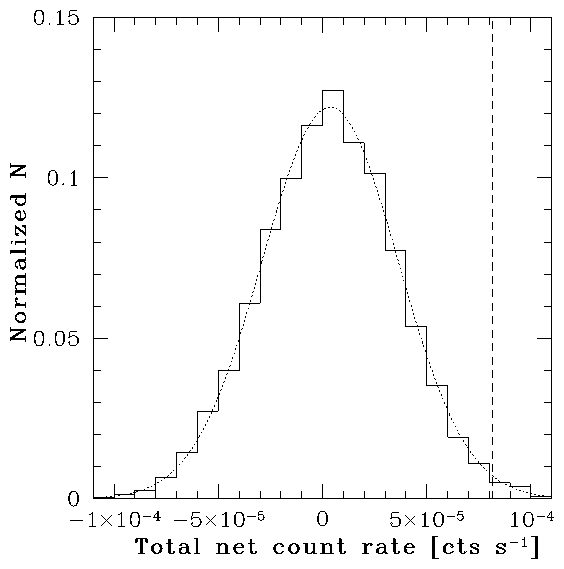
A more accurate measurement of the significance level of the (non) detections, following the definition itself of “significance level”, can be obtained by repeatedly stacking random positions in the field, with equal to the number of sources in a sample, and counting how many times the derived count rate is larger than the one obtained for the real sources (e.g. Brandt et al., 2001). Therefore, for each sample we ran the stacking procedure 10000 times, perturbing the coordinates of the galaxies by a random value up to in each direction. Doing this we efficiently create a list of random positions to be stacked which, at the same time, statistically maintain the spatial distribution of the real sources. For every run we computed the total net count rate in the same way as for the real sources (i.e. through the bootstrap procedure). We report in Fig. 11 the distribution of the 10000 total net count rates obtained for the sample as an example. The distribution is centred very close to zero, which is evidence that the procedure is not affected by any apparent bias (see Cowie et al. 2012, Treister et al. 2013). The number of runs which gives a total net count rate smaller than the ones derived for the samples of real galaxies is an independent estimate of the significance of a detection. We report these numbers for each sample in the columns 8 and 10 of Tab. 1 and in Fig. 10. According to this procedure, the significance of the detection of massive galaxies at increases to . The detection significance for the whole sample increases as well (). We also report the detection with the highest significance (, corresponding to a confidence level) of stacked X-ray emission from massive () galaxies at . This is indeed the detection with the highest significance of X-ray emission from galaxies at such a high redshift. Previously, Cowie et al. (2012) reported a tentative () detection of X-ray emission from stacked galaxies at in the CDF-N, although the significance decreased once they included the 4 Ms CDF-S data. We attribute this result to the increased exposure of the Chandra observations coupled with the new deep optical data available in this field. In Appendices C and D we investigate the impact of the photometric-redshift uncertainties and the particular selection approach we used on our results, finding that they appear robust against these two issues. In particular, in Appendix D we will apply our stacking analysis to a sample of Lyman-Break Galaxies (LBG) at . Considering the sample sizes and the use of the deepest X-ray data available, those are the best constraints to date on the stacked X-ray emission from galaxies at such redshifts.
3.3 The dominant undetected X-ray population
In the previous sections we found that most, if not all, of the signal from galaxies at and comes from the most massive half of the samples. However, the chosen mass threshold (i.e. the median mass of the sample) could be not the one that would return the highest SNR. Moreover, we cannot be sure that mass is the primary physical parameter driving the X-ray emission. To address these issues, in Fig. 12 we plotted the normalized cumulative distribution of the number of stacked sources and the stacked signal as a function of H-band magnitude, stellar mass and sSFR for the sample. The sSFR was preferred over the SFR since it is a quantity defined per unit stellar mass. We could derive the distribution in count rate as we know the contribution of the individual stacked galaxies (which can also be negative) to the total signal from our aperture photometry procedure. For instance, the left panel of Fig. 12 shows that of the stacked galaxies at have , but their cumulative contribution to the final net signal is null. In principle, if every galaxy contributed to the stacked signal in the same way, with no dependence on magnitude, mass or sSFR, the blue and red curves would overlap, aside from the statistical noise on the measured count rate. The different behaviour of the two curves in two out of the three cases tells us that the stacked X-ray emission is actually dominated by luminous and massive galaxies (and is not affected by preferential sSFR values).
The difference between the cumulative distribution of the number of galaxies and the relative count rate includes information about how much the stacked emission depends on magnitude, mass, and sSFR. These difference values are plotted in the upper inserts of Fig. 12. In particular, the location of the maximum difference (dotted lines in Fig. 12) is a good estimate of the cut in magnitude, mass, or sSFR to be applied in order to get the maximum signal from the minimum number of galaxies. For instance, in the second panel, the maximum difference () occurs at , corresponding to of the stacked galaxies and a cumulative negative flux, which means that stacking galaxies with , of the sample, would return a stronger signal than stacking the whole sample (), as less-massive galaxies preferentially returned negative count rates. The maximum difference is lower when investigated as a function of sSFR than for the magnitude and mass cases. This means that the sSFR is not the main driver of the X-ray emission. The maximum difference is very similar for the H-band magnitude and mass cases; this is not unexpected as the stellar mass from SED fitting is typically determined from the optical/near-IR part of the spectrum.
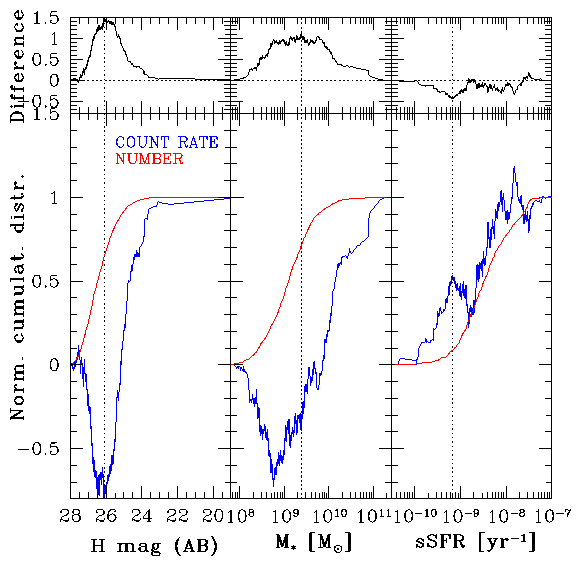
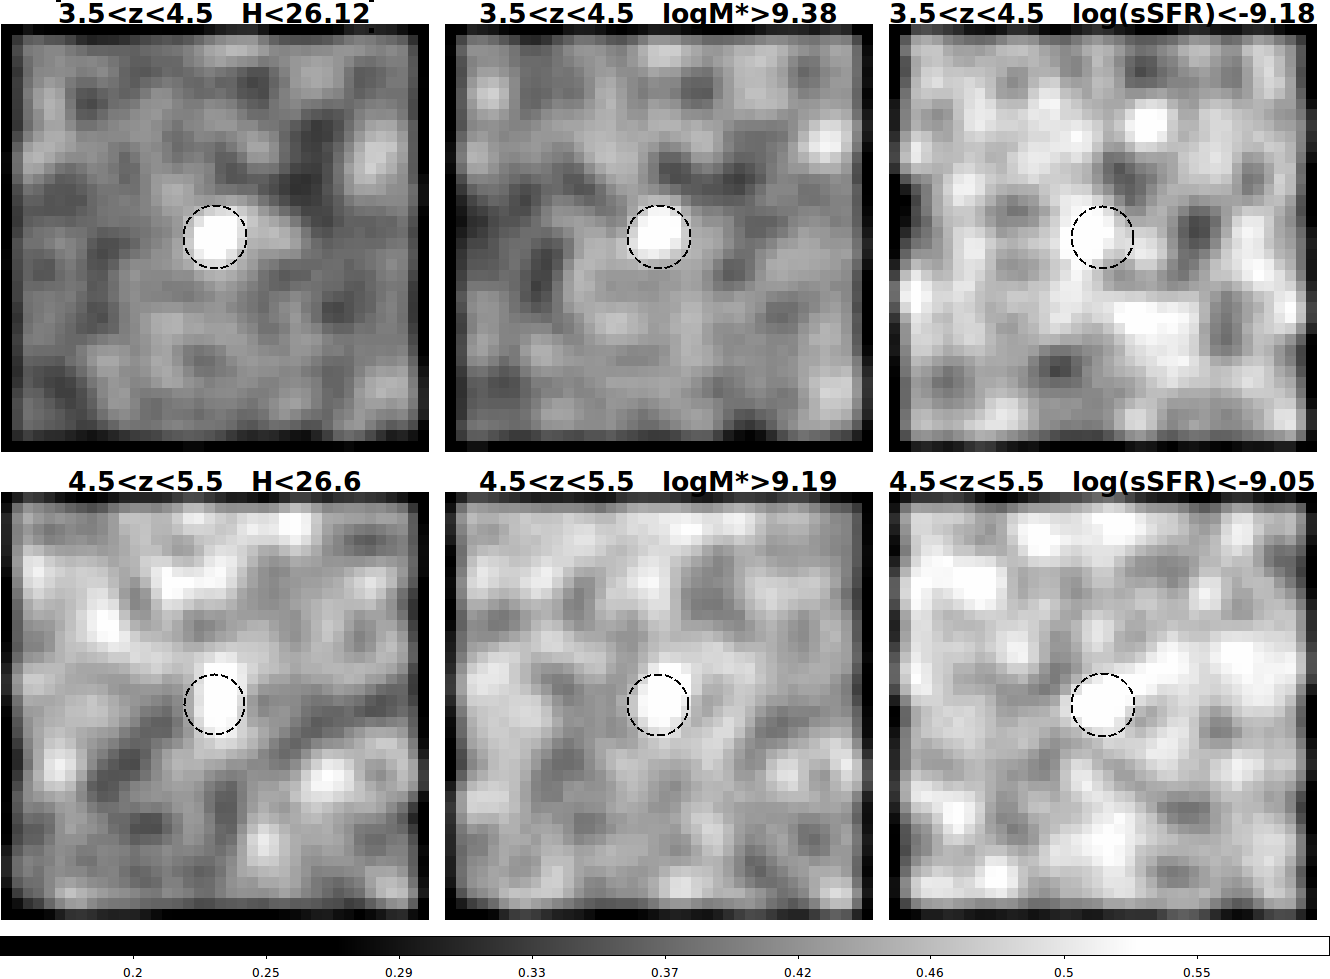
We used the magnitude, mass, and sSFR values corresponding to the maximum difference between the number of galaxies and the net count rate distributions as cuts to identify the galaxies in our and samples that contribute most to the stacked signal. We then repeated the stacking procedure for these subsamples. We note that the maximum difference for the sSFR case is negative, which means that galaxies with low sSFR contribute slightly more than those with high sSFR to the total signal. In this case, we therefore stacked galaxies with sSFR lower than that corresponding to the maximum difference. Fig. 13 shows the stacked images in the soft-band of the subsamples. Tab. 2 reports the cuts in magnitude, stellar mass and sSFR used for galaxies at and applied to derive the maximum SNR, the fraction of stacked galaxies with respect the parent sample, the relative net-count rate and the SNR computed by the bootstrap procedure. For the bin, we also computed the SNR by stacking random positions, with equal to the number of stacked sources in each subsamples, and counting the number of stacking run which returned a lower signal than the measured one, as we did in § 3.2. These values are reported in Tab. 2. In particular, applying the selection method described in this section, the significance of the signal from bright () and/or massive () galaxies at increases to .
However, these detection significances may be biased upwards because the subsamples were constructed to maximize SNR using prior information on count rates. To independently estimate the significance, we used a set of 1000 4-fold cross-validation tests (Efron & Tibshirani, 1993), in a similar way as Xue et al. (2012): first we randomly split the full sample into 4 approximately equal-sized subsamples; we then excluded one subsample and repeated the procedure above jointly on the 3 remaining subsamples in order to derive the magnitude (or mass or SFR) cut, which was then applied to the excluded subsample to select of galaxies to be stacked, i.e. the threshold in the parameter of interest was evaluated using of the sample and then applied to the remaining subsample. The same was repeated for the other 3 subsamples, and the final sample (selected using different thresholds in the parameter of interest) was stacked and a SNR was derived. The procedure was repeated 1000 times, allowing us to derive a distribution of SNR, whose median is the actual SNR of the detection. As noted by Xue et al. (2012), these SNRs are likely underestimated, as we only used of the sample to determine each selection. The real SNR therefore lies in the ranges defined by the SNR computed through the bootstrap procedure and the 4-foldcross-validation tests. The resulting SNR are reported in Tab. 2. These numbers indicate that the X-ray signal is mainly driven by the mass/magnitude of the galaxies.
The average stacked X-ray fluxes we obtained for the whole samples in § 3.2 (obtained by dividing column 7 by column 3 of Tab. 1) are , similar to the fluxes of sources expected to be individually detected by X-Ray Surveyor (see § 6), which will have an expected flux limit for a 4 Ms exposure of (see sec. 6 of Weisskopf et al., 2015). However, in this section we have shown that the detected signal is due to a small fraction of optically-bright, massive galaxies. For instance, as described in the first paragraph of this section, the detected signal at is entirely due to the of most massive galaxies, while the remaining of the sample has a null cumulative stacked emission. Therefore, we are effectively sampling a population of galaxies with an average X-ray flux a factor of larger than the X-Ray Surveyor flux limit for individually detected sources, thus already placing useful constraints on the scientific outcomes expected by X-Ray Surveyor.
| 26.12 | 26.60 | |
| Fraction | 0.36 | 0.51 |
| CR () | ||
| SNR | 4.92–5.27 | 2.36–2.38 (3.24) |
| log | 9.38 | 9.19 |
| Fraction | 0.29 | 0.55 |
| CR () | ||
| SNR | 3.86–4.55 | 2.10–2.23 (3.16) |
| log(sSFR) | ||
| Fraction | 0.09 | 0.18 |
| CR () | ||
| SNR | 1.85–2.99 | 0.93–2.03 (2.13) |
4 Nuclear accretion and star formation properties of high-redshift galaxies
In this section we use the stacking results from individually X-ray-undetected galaxies to infer information about the BHAD, SFRD and faint end of the XLF at , under different assumptions about the relative contributions of the nuclear and stellar X-ray emission. We also include separately results from a sample of X-ray detected, high-redshift AGN.
4.1 relations
X-ray emission from galaxies is due to a combination of nuclear accretion and stellar processes, primarly in the form of X-ray binaries (XRBs). In particular, emission from high-mass XRB (HMXB) and low-mass XRB (LMXB) is related to the SFR and of the host galaxy, respectively (e.g. Lehmer et al., 2010; Mineo et al., 2012; Zhang et al., 2012). At the lowest fluxes probed by the 4 Ms CDF-S, Lehmer et al. (2012) found that about half of the X-ray detected sources are star-forming galaxies, whose relative number is expected to increase further at even lower fluxes (such as those probed by this work), overtaking the number of AGN. It is therefore necessary to consider the XRB contribution in our investigation of the X-ray emission from galaxies. However, the relation between SFR and X-ray emission is not observationally constrained in the redshift range probed by this work.
We therefore use two different relations: a simple local-universe calibration (Ranalli et al., 2003) with no evolution, and models dependent on galaxy properties with redshift evolution (Fragos et al., 2013). The Fragos et al. (2013) models are constructed by applying the Startrack XRB-population synthesis code (Belczynski et al., 2002; Belczynski et al., 2008) to the Millenium II cosmological simulation (Guo et al., 2011), and predict the and relations as a function of redshift up to , calibrated in such a way to match the observed relations in the local universe. We will use the Fragos et al. (2013) theoretical relation corresponding to their model 269, which has been found by Lehmer et al. (accepted) to be the one that best agrees with observational data up to and the slight redshift evolution observed by Basu-Zych et al. (2013b), at the same time providing a physically motivated extrapolation to . For instance, at high redshift the typical time-scale needed to form LMXB after a burst of star formation is comparable to the age of the Universe. Moreover, the number of HMXB and their mass distribution depend on metallicity, which evolves with redshift. These considerations imply a flattening of the relation at , followed by a decline at , and a mild positive evolution of the relation with increasing redshift. While these behaviours are predicted by the Fragos et al. (2013) theoretical modelling (see their fig. 5), the and relations have not been constrained observationally at (e.g. Lehmer et al. accepted). We corrected the Ranalli et al. (2003) and Fragos et al. (2013) relations in order to match the IMF assumed by Santini et al. (2015).
4.2 Assumptions on the relative contribution from AGN and SF
In this section, we describe how we account for the contribution from both AGN and X-ray binaries to the stacked X-ray emission. As we do not know the relative strength of these two classes of processes, we consider 5 cases:
-
1.
All the X-ray emission is due to AGN activity.
-
2.
All the X-ray emission is due to processes related to star formation (SF), which scales with following the Ranalli et al. (2003) relation.
-
3.
Same as (ii), but using the Fragos et al. (2013) relation. In this case we assume the mean of each sample.
-
4.
The X-ray emission is due to a mixture of AGN and SF, which scales with following the Ranalli et al. (2003) relation.
-
5.
Same as (iv), but using the Fragos et al. (2013) relation.
Case i gives us an upper limit on AGN emission from high-redshift X-ray-undetected galaxies. Similarly, cases ii and iii give upper limits on the SFR. Case iv and v represent the more realistic cases in which AGN and XRB contribute simultaneously to the total X-ray emission. For the last two cases we assume the mean SFR and of the considered sample to obtain the X-ray emission due to XRB. Then we subtracted it from the total X-ray flux derived from the stacking analysis to estimate the emission due to nuclear accretion.
4.3 Correcting for obscuration
In Vito et al. (2013, 2014) we showed that at approximately half of the X-ray selected AGN are obscured by a column density with a median value of and no strong dependence on luminosity. When dealing with AGN, we thus assume that half of the sample is obscured by and that all sources have identical intrinsic (i.e. unabsorbed) flux. Under these assumptions, the intrinsic total soft band flux is:
| (4) |
where is the transmission factor due to absorption by a column density . Assuming an intrinsic slope of , ranges from at to at . We always apply Eq. 4 to the observed flux ascribed to AGN activity, thus correcting it by a factor .
4.4 X-ray detected high-redshift AGN
In order to derive a more comprehensive picture of the accretion properties of high-redshift galaxies, we also considered sources detected in the 7 Ms CDF-S (Luo et al. in prep.) that fall within the same sky field considered so far (i.e. CANDELS/GOODS-S restricted to from the CDF-S average aim point). We used the spectroscopic redshifts provided by Vito et al. (2013) and Luo et al. (in prep.) and photometric redshifts from Skelton et al. (2014) and Hsu et al. (2014).555In the updated version retrievable at http://www.mpe.mpg.de/XraySurveys/CDF-S/CDF-S_X_photoz.html In particular, Hsu et al. (2014) used hybrid (galaxy plus AGN) templates for X-ray detected sources in the 4 Ms CDF-S. For those sources the Hsu et al. (2014) redshifts are therefore expected to be more reliable than the Santini et al. (2015) ones. In total, there are AGN at detected in the reduced CANDELS/GOODS-S field in the 7 Ms CDF-S.
In our field, 10 sources out of the X-ray detected objects () have no optical counterpart and thus no redshift information. Including a correction for redshift incompleteness to the results derived for individually-detected sources is beyond the scope of this paper, which is focused on the population of individually-undetected galaxies. However, as will be shown in § 4.5 and § 5.1, such a correction would only strengthen the results.
X-ray spectra were extracted using the ACIS Extract software666http://www2.astro.psu.edu/xray/docs/TARA/ae_users_guide.html and fitted with XSPEC.777https://heasarc.gsfc.nasa.gov/xanadu/xspec/ As in Vito et al. (2013), we used a simple spectral model in order to derive basic spectral parameters such as column density, flux and intrinsic luminosity. In particular, we assumed an absorbed power-law with intrinsic photon index fixed to , including Galactic absorption (Kalberla et al., 2005). Fitting results are reported in Tab. 3. The use of more complex models is precluded for most of the considered sources because of the limited photon counting statistics. Moreover, our aim is to derive reasonable basic estimates of the intrinsic luminosity rather than to perform a detailed spectral analysis. A dedicated analysis of the population of X-ray detected, high-redshift AGN will be the topic of a future work.
| CXOCDFS J | |||||
|---|---|---|---|---|---|
| (1) | (2) | (3) | (4) | (5) | (6) |
| 033207.3274942 | P1 | ||||
| 033209.8275015 | P1 | ||||
| 033211.3275213 | 3.740 | S1 | |||
| 033213.0274351 | P2 | ||||
| 033216.8275043 | 3.712 | S2 | |||
| 033218.8275135 | 3.660 | S1 | |||
| 033223.1275029 | P1 | ||||
| 033225.8275507 | P2 | ||||
| 033229.8275105 | 3.700 | S1 | |||
| 033233.4275227 | P1 | ||||
| 033241.8275202 | 3.610 | S1 |
(1) Official Chandra name of the X-ray source; (2) redshift; (3) redshift reference - S1, S2: spectroscopic redshift from Luo et al. (in prep.) and Vito et al. (2013), respectively; P1, P2 : photometric redshift from Hsu et al. (2014, http://www.mpe.mpg.de/XraySurveys/CDF-S/CDF-S_X_photoz.html) and Skelton et al. (2014), respectively; (4) best-fitting column density. ∗ The low photon-counting statistics of this object prevented us from leaving the column-density parameter free, and thus we fixed it to the value reported in the Luo et al. (in prep.) catalog. (5) soft-band flux; (6) hard-band (), intrinsic (i.e. rest-frame and corrected for absorption) luminosity. All errors are at the confidence level. Errors on luminosity account only for the error on the power-law normalization.
4.5 Black Hole Accretion Rate Density (BHAD)
The BHAD is defined as
| (5) |
where is the bolometric luminosity, is the bolometric correction suitable for the hard X-ray band (), is the radiative efficiency and is the AGN bolometric luminosity function We assumed and (which is appropriate for AGN according to Marconi et al. 2004 and Lusso et al. 2012) with no dependence on X-ray luminosity for the stacked samples. Under these assumptions, Eq. 5 becomes
| (6) |
The integral is the co-moving AGN emissivity per unit volume ():
| (7) |
where is the comoving volume covered by the CANDELS field in the redshift range of interest, after correcting it for the area lost by considering only and having masked regions where X-ray detected sources are located (, corresponding to an area loss of ). We computed (the luminosity due to nuclear accretion in the stacked galaxies) from the fluxes reported in Tab. 1, under the assumptions described in § 4.2 and taking into account the correction for obscuration (§ 4.3), at the mean redshift of each sample.
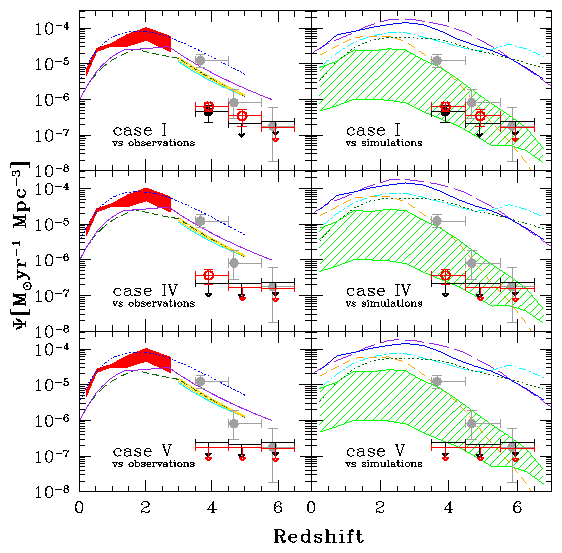
The BHAD values for each redshift bin and considered case are reported in Tab. 4. Fig. 14 shows the results as a function of redshift for the three cases of § 4.2 in which we considered an AGN contribution to the X-ray emission, compared with some previous observational results in the literature (panels in the left column): Delvecchio et al. (2014) derived the BHAD for a sample of Herschel-detected AGN using a SED-fitting procedure, while Ueda et al. (2014), Vito et al. (2014), Aird et al. (2015), Georgakakis et al. (2015) and Miyaji et al. (2015) derived the X-ray luminosity function for AGN. We converted those luminosity functions into BHADs using Eq. 5. In this process we had to assume a . Lusso et al. (2012) derived the corrections for converting from the to the bolometric luminosity due to accretion only, while Hopkins et al. (2007) derived corrections which refer to the total, observed bolometric luminosity of AGN hosts. As we are interested in emission due only to accretion, we use the Lusso et al. (2012) . However, we integrated the X-ray luminosity functions up to luminosities exceeding the luminosity range probed by that work (). Therefore, at larger luminosities we used the Hopkins et al. (2007) corrections, also noting that, at QSO-like luminosities, of the host galaxies is dominated by the accretion component. The difference between the BHAD from Aird et al. (2015) and the BHADs derived from the other X-ray based studies is largely due to the different used, as Aird et al. (2015) assumed the Hopkins et al. (2007) conventions at all luminosities. The panels in the right column of Fig. 14 show the comparison between our findings and results based on simulations which assume different flavours of SMBH seeding and growth mechanisms. In particular, massive seeds () are used by Lodato & Natarajan (2006), Bonoli et al. (2014, orange line), Sijacki et al. (2015) and Volonteri et al. (2016), while the BHAD of Volonteri (2010) and Bonoli et al. (2014, yellow region) are due to accretion onto light seeds (Pop III remnants, ). These BHAD curves have been derived differentiating the BH mass-density curves presented by all of these works (except for Sijacki et al. 2015, who directly report the BHAD). While these curves should be compared to the total BHAD, this is consistent (i.e. within the errors) with the BHAD due to AGN alone. In fact, the contribution of the stacked galaxies is more than one order of magnitude lower at and is at most equal at higher redshifts than the BHAD due to individually X-ray detected sources.
We also show the results from the sample of X-ray detected AGN in CANDELS/GOODS-S described in § 4.4, but we note that they should be treated with caution, as they are easily affected by small-number statistics and cosmic variance. This is why the BHAD for detected AGN is kept separate from the BHAD derived from the stacked signal, which should be less sensitive to those issues. Also, we did not account for the stellar contribution to the X-ray luminosity of the individually detected sources, as they are expected to be strongly dominated by the AGN, their X-ray luminosity being well above the maximum luminosity produced by X-ray binaries (, e.g. Ranalli et al. 2003, 2005). For these X-ray detected sources, we use the appropriate corresponding to the observed luminosity and applied Eq. 6. The implications of the results shown in Fig. 14 are discussed in § 5.1.
| bin | BHAD | |||||
|---|---|---|---|---|---|---|
| X-ray detected | X-ray undetected | |||||
| case i | case iv | case v | ||||
| all | ||||||
| all | ||||||
| all | ||||||
4.6 Star Formation Rate Density (SFRD)
We define the SFRD as:
| (8) |
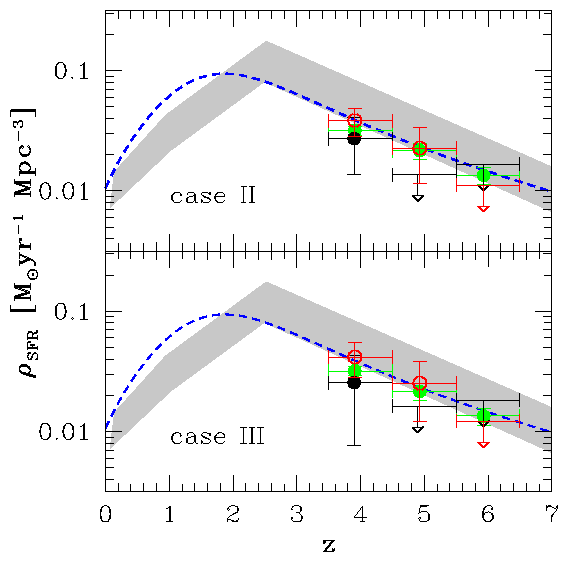
The SFR and SFRD values for each redshift bin and considered case are reported in Tab. 5. Fig. 15 shows the results as a function of redshift for the two cases (ii and iii) in which we derived the SFR from the stacked X-ray emission. In cases iv and v we did not derive the SFR from X-ray data, but we assumed the values reported by Santini et al. (2015, see § 4.2). The corresponding SFRD values are shown as green points in Fig. 15. We also plot in Fig. 15 the SFRD reported by Bouwens et al. (2015) and Madau & Dickinson (2014), corrected for the different IMFs used in those works. The estimated SFRD values are fairly consistent with the Bouwens et al. (2015) and Madau & Dickinson (2014) results. We note that both Bouwens et al. (2015) and Madau & Dickinson (2014) derived the SFRD at high redshift by integrating UV luminosity functions of galaxies down to magnitudes fainter than the limiting magnitude used in this work. However, the brighter magnitude limit of our sample produces only a small underestimate (few per cent) of our SFRD estimates.
| bin | case ii | case iii | case iv&v | ||||
|---|---|---|---|---|---|---|---|
| SFR | SFRD | SFR | SFRD | SFR | SFRD | ||
| all | |||||||
| all | |||||||
| all | |||||||
4.7 Faint-end of the Hard X-ray Luminosity Function (HXLF)
We used the stacked X-ray emission to place constraints on the faint end of the AGN luminosity function by considering that the number of AGN with a certain luminosity is limited by the observed total AGN luminosity () following
| (9) |
where the equality corresponds to the unrealistic case in which all the measured AGN emission is due to AGN with the same luminosity . We considered the soft-band flux corresponding to half of the Chandra sky-coverage in the CANDELS area considered in this work (i.e. half of the area is sensitive to fluxes ). We then derived the corresponding hard-band luminosity , including the absorption correction discussed in § 4.3, at the central redshift of each bin (i.e. 4, 5, and 6). We assumed that most of the stacked signal is due to sources close to the 7 Ms detection threshold, with luminosities between and . For simplicity, the mean logarithmic luminosity, was considered representative of the entire bin. The number of AGN with luminosity in this range could then be derived as
| (10) |
where is the luminosity due to AGN activity as measured by the stacking analysis in the different cases considered in § 4.2 and already used in § 4.5 to derive the BHAD. Finally, was used to estimate upper limits to the LF in the relative 1-dex luminosity bin:
| (11) |
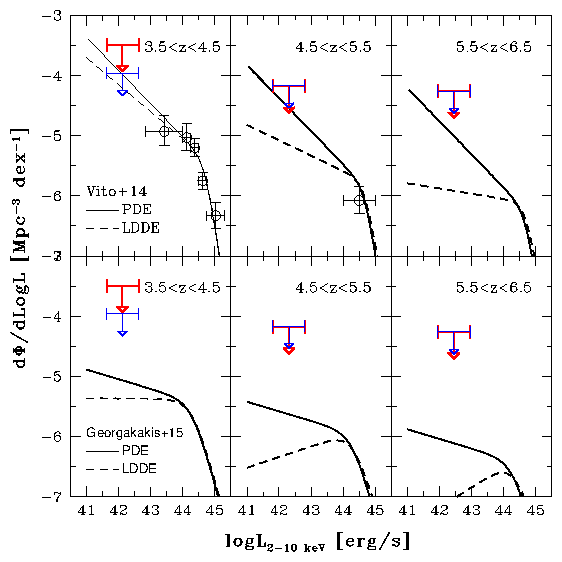
In Fig. 16 we compare the upper limits to the LF we derived for each redshift bin in case i (all the X-ray emission is due to AGN) and v (X-ray emission due to a mixture of AGN and XRB) with the XLF models of Vito et al. (2014) and Georgakakis et al. (2015). We have not included any X-ray detected sources; the very small number of possible detected AGN at with such low luminosities does not change the results significantly. These results about the faint end of the AGN XLF and their implications are discussed in § 5.3.
5 Discussion
Using the deepest X-ray data to date, we detected significant () stacked X-ray emission from massive CANDELS/GOODS-S galaxies (with X-ray detected AGN excluded). Signal with lower-significance () was also detected from the whole population of galaxies (i.e. applying no mass selection). We also reported the first X-ray detection of galaxies at , with a significance of , corresponding to a confidence level. No emission from galaxies was significantly detected, even with effective exposures, several times deeper than previous works (Cowie et al., 2012; Basu-Zych et al., 2013a; Treister et al., 2013). These results have been confirmed in Appendix D by stacking a sample of LBG from Bouwens et al. (2015). Overall, the signal seems to be sensitive to the stellar mass, with massive galaxies strongly dominating the X-ray emission, while no dependence on the specific star-formation rate properties was derived.
As X-ray emission from galaxies is primarily due to AGN and XRB (which can be used to trace star formation activity), we considered different contributions of these two classes of objects to the measured (or constrained by upper-limits) X-ray emission from our samples (see § 4.2). Here we discuss the implications of our results for the BHAD, the relative contribution of AGN and XRB (hence star formation) and the faint-end of the XLF. Finally, we apply our stacking procedure to two recently-published samples of high-redshift AGN and compare our findings with results from those works.
5.1 Black Hole Accretion Rate Density in the Early Universe
Besides BH mergers, BH mass growth can happen during the short (compared to a galaxy lifespan) phases of strong accretion (i.e. AGN) and/or through continuous (secular) accretion of material with a low rate during most of the galaxy lifespan (e.g. Hopkins et al., 2014), which may not produce enough emission to be detected even in deep X-ray surveys. In Fig. 14 (left panel) our results for AGN and stacked galaxies are compared with models derived from different AGN samples, in order to quantify the relative contribution of inactive galaxies to the BHAD. Even in case i (maximum AGN contribution) the BHAD we derived for the stacked (individually undetected) galaxies is significantly lower than that implied by models of the AGN XLF. This is clearer in cases iv and v, where we have subtracted the contribution from XRBs. Moreover, the BHAD of detected AGN in the first redshift bin (the and bins are based on just two and one detections, respectively, and therefore are not very informative) is more than one order of magnitude higher than that of undetected galaxies, implying that luminous X-ray detected AGN dominate the BHAD at high redshift, while any potential continuous low-rate accretion in inactive galaxies has a negligible effect on the total BH mass growth. This result agrees with Volonteri et al. (2016), who found that in the Horizon-AGN simulations most of the BH growth at occurs in luminous () AGN. Similarly, at low redshift the Soltan (1982) argument and direct measurements ascribe most BH growth to the AGN phase (e.g. Brandt & Alexander, 2015, and references therein). For completeness, in Fig. 14 (right panel) we compared our results with BHAD predictions from different simulations. Most of them overestimate the BHAD at high redshift, compared to both our results and other observational findings (as per the curves shown in the left panels). Our results suggest that this tension cannot be solved by invoking a low-rate accretion in individually undetected galaxies.
The BHAD derived from stacked galaxies would be higher if the fraction of obscured AGN among them we assumed (0.5) were too small. However, even in the extreme case where all the stacked galaxies host heavily obscured AGN (modifying Eq. 4 such that all AGN are assumed to be obscured by a column density ), the resulting BHAD would increase only by a factor of , remaining well below the BHAD of X-ray detected sources. Only if all the stacked galaxies hosted Compton-thick AGN the BHAD for galaxies at would be comparable to that of X-ray detected AGN.
The different mixtures of nuclear activity and XRB emission assumed in § 4.2 therefore produce no imprint in the resulting total BHAD, which is due almost entirely to luminous X-ray detected AGN. While at the sample size of X-ray detected AGN is statistically meaningful (see Tab. 3) and this result is robust, at higher redshift the very limited number of X-ray detected AGN prevents us from drawing solid conclusions. The much smaller number of X-ray detected AGN suggests that luminous and rare QSOs, which are missed by deep pencil-beam surveys like the 7 Ms CDF-S, may dominate the BHAD. Indeed, assuming the PDE model of Vito et al. (2014) to represent the XLF, AGN with account for of the BHAD at , but, with a comoving space density , only 1 of such objects is expected to be detected in the area considered in this work. Assuming the Georgakakis et al. (2015) model, which has a shallower faint end, the contribution of luminous AGN to the total BHAD is even larger.
5.2 Star formation or nuclear accretion?
While the total BHAD, being insensitive to the contribution of X-ray-undetected galaxies, does not give hints on the relative contribution of nuclear accretion and star formation to the stacked X-ray emission, the comparison of our findings in § 4.6 with independent measurements of the cosmic SFRD available in the literature (Fig. 15) is more informative. In particular, if all the emission is assumed to be due to XRB, the SFRD we derived in the three redshift bins is consistent with results from Bouwens et al. (2015) and Madau & Dickinson (2014). In other words, unless the calibrations we used are dramatically wrong, we need X-ray emission from high-redshift galaxies to be largely due to XRB, and hence linked to star formation, in order to match the SFRD derived in other works. This result agrees with Cowie et al. (2012), who suggested that the upper limits on the X-ray flux they derived at by stacking a sample of galaxies are consistent with being entirely related to star formation.
Another hint in favour of an XRB origin of the X-ray emission from individually undetected galaxies can be derived by comparing the SFRD obtained assuming the SFRs from the SED fitting technique by Santini et al. (2015) to the SFRD we derived from our stacking analysis. Assuming the SFR by Santini et al. (2015) for the same galaxies we included in our stacked samples, Eq. 8 returns a SFRD values (green points in Fig. 15) consistent with what we found from the X-ray stacking analysis only if we consider all the X-ray emission to be due to XRB. Stacking the X-ray emission in the hard band did not return detections or upper-limits tight enough to constrain the average X-ray effective spectral slope, which could be used to infer a nuclear or XRB origin of the X-ray emission.
5.3 The faint-end of the AGN XLF at high-redshift
The Vito et al. (2014) XLF models are marginally consistent with the upper limits resulting from our stacking analysis in both the considered cases (max AGN and AGN+SF) in Fig. 16. We note that these particular models were already considered as upper limits for the AGN XLF, since a maximum redshift-incompleteness correction was applied. Also, Georgakakis et al. (2015) showed that assuming the nominal photometric redshifts without considering the associated uncertainties probably led to an overestimate of the AGN space density at in Vito et al. (2014). The models of Georgakakis et al. (2015) are largely consistent with the stacked X-ray emission. Those models, while taking into account the Probability Distribution Functions (PDF) of the photometric redshifts of individual AGN, are not corrected for obscuration (i.e. the -axis is the observed luminosity). In this respect, they should be considered lower limits for the AGN XLF, as obscured AGN can be detected over smaller areas compared to unobscured sources with the same intrinsic luminosity (this, together with the different treatment of the photometric redshifts, could be reflected in the overall lower normalization of their models with respect to the Vito et al. 2014 ones).
We conclude that our stacking analysis supports a fairly flat faint end of the high-redshift AGN LF, in agreement with previous works in similar redshift ranges (Vito et al., 2014; Georgakakis et al., 2015), but extended to lower luminosities, thanks to the deep 7 Ms CDF-S data. Although not highly constraining, the presented results are the first observational estimates of the faint-end of the X-ray-selected AGN LF at high redshift. Still, we cannot distinguish between a PDE- and a LDDE-like evolution at , as different authors reported quite different slopes and normalizations for the same classes of models.
Finally, we note that a flat faint end at high redshift can be qualitatively associated with massive BH seeds (e.g. see the discussion in Gilli et al., 2011). If SMBH primarily grew from light seeds (), a large number of high-redshift AGN fuelled by accretion onto low-mass SMBH are expected. As the Eddington luminosity scales with the BH mass, even SMBH with accretion rates close to the Eddington limit would populate the faint-end of the LF at high redshift, which would therefore appear steep, as only a small fraction of the SMBH population could reach luminosities. Conversely, if the primary seeding mechanisms involved heavy seeds (), AGN can more easily reach luminosities close to , producing a flatter LF faint end. Future X-ray missions (see § 6) will provide a better sampling of the AGN XLF at low luminosities and higher redshifts, which is mandatory to understand the mechanisms of formation and growth of SMBH in the early universe. If the AGN XLF faint end is found to be flat at higher redshift (i.e. if the space density of low-luminosity AGN declines with increasing redshift at the same rate as that found, e.g., by Vito et al. 2014, for AGN, or even faster as suggested by Georgakakis et al. 2015), this would be a strong hint in favour of a massive-seeds scenario.
5.4 Comparison with previous recent works
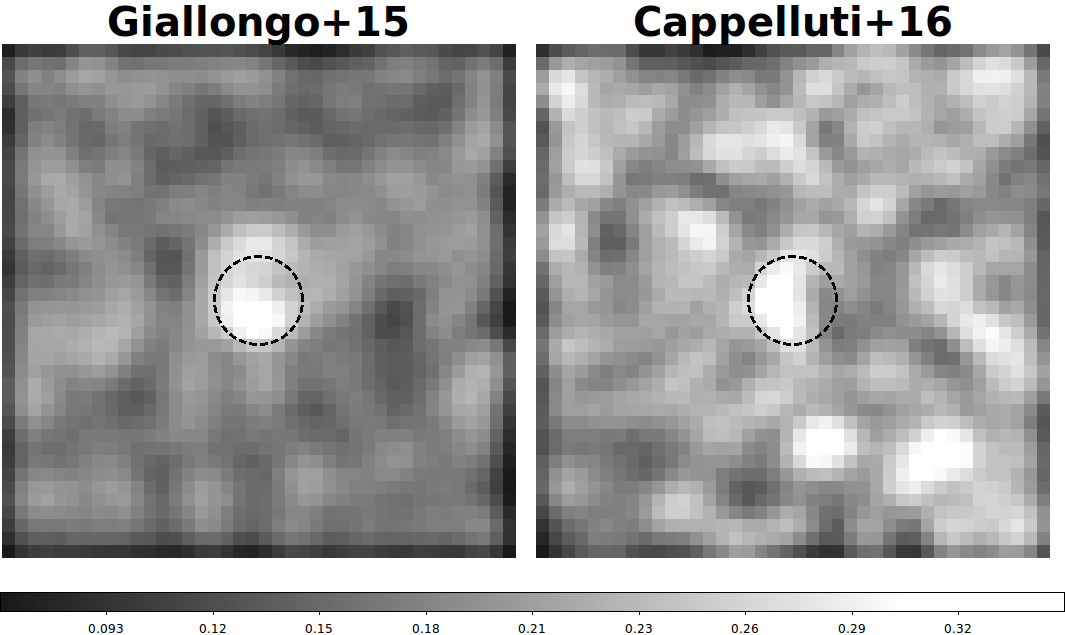
Recently, Giallongo et al. (2015) and Cappelluti et al. (2016) exploited specialized techniques to detect faint X-ray sources in the 4 Ms CDF-S observations, using the positions of CANDELS-detected galaxies as priors, thereby pushing the Chandra detection limit to lower fluxes with respect to blind-detection runs. Giallongo et al. (2015) selected a sample of 22 AGN candidates by looking for clustering of X-ray counts in space-time-energy parameter space. Five of their AGN candidates have spectroscopic redshifts, while the remaining ones are selected on the basis of the CANDELS photometric redshifts. Eight out of their 22 sources were already detected in the 4 Ms CDFS catalog of Xue et al. (2011). Cappelluti et al. (2016) detected 698 X-ray sources by performing a Maximum Likelihood PSF fit at the positions of CANDELS galaxies simultaneously in the and bands. Focusing on the redshift range probed by this work, , and using the CANDELS redshifts, there are 15 objects in their catalog, 9 of which were already included in the 4 Ms CDF-S catalog of Xue et al. (2011). Tab. 6 summarizes these numbers.
| Sample | ||||
|---|---|---|---|---|
| (1) | (2) | (3) | (4) | (5) |
| G+15 | 22 | 8 | 1 | 13 |
| C+16 | 15 | 9 | 1 | 5 |
(1) Parent sample; (2) number of high-redshift AGN candidates in the parent sample; (3) number of sources already detected in the 4 Ms CDF-S catalog of Xue et al. (2011); (4) number of AGN candidates excluded from the stacking because of the proximity of an unrelated X-ray detected source in the 7 Ms CDF-S catalog of Luo et al. (in prep.); (5) number of stacked AGN candidates.
Applying our stacking code, we derived a total net count rate of and for the Giallongo et al. (2015) and Cappelluti et al. (2016) galaxies in the redshift range probed by this work (), corresponding to a SNR=3.28 and 1.69, respectively. We note that these numbers refer to the stacked galaxies only, which are 13888CANDELS ID 4285, 5501, 8687, 8884, 9713, 9945, 11287, 12130, 14800, 23757, 28476, 31334, 33073 and 5999CANDELS ID 4466, 4760, 14537, 24833, 25825 for the two cases, the remaining ones being excluded from the stacking analysis as they are X-ray detected in the Luo et al. (in prep.) catalog or are too close to an X-ray detected source (see Tab. 6). Fig. 17 shows the stacked images in the soft band of the two samples. The numbers reported in Tab. 6 and the stacked signal visible in Fig. 17 mean that using the CANDELS positions as priors allows the detection of sources undetected by blind detection runs on even deeper (7 Ms) data sets.
Assuming the conversions discussed in § 4 and that all the emission is due to AGN, the stacked count rate for the Giallongo et al. (2015) sample corresponds to a total flux of and a luminosity of (at , the median redshift of the sample), a factor lower than the sum of the luminosities estimated by Giallongo et al. (2015) for the considered 13 sources. The stacked count rate of the Cappelluti et al. (2016) sample of 5 galaxies corresponds to a total flux of and an AGN total luminosity of , at the median redshift of the sample, i.e. . As for the Giallongo et al. (2015) sample, the flux we derive is lower (by a factor of ) than that estimated by Cappelluti et al. (2016) for the same 5 galaxies, i.e. . We ascribe the difference of the signal significance between the two samples to the difference in size, as the distributions of net-count rates of the individual sources are similar. Assuming the stellar mass and SFR values from Santini et al. (2015) and the Fragos et al. (2013) relation between SFR and (as we did in § 4), we estimated that of the luminosities measured for the two subsamples is due to XRBs.
The discrepancies between the fluxes we derived from our stacking analysis and those reported by Giallongo et al. (2015) and Cappelluti et al. (2016) for the same objects can be explained by a combination of several factors. For instance, the different methods and assumptions used; e.g. Cappelluti et al. (2016) assume a different spectral shape than the one we used. Moreover, we note that, by construction, we stacked the faintest X-ray sources from Giallongo et al. (2015) and Cappelluti et al. (2016), as the stacking procedure discards sources detected in the 7 Ms CDF-S catalog. In particular, in the Cappelluti et al. (2016) sample, this means that we stacked galaxies with the least secure X-ray counterparts. Indeed, 2 out of the 5 stacked X-ray sources have an ambiguous optical/X-ray matching in Cappelluti et al. (2016). For instance, one of them, CANDELS ID 25825, contributes with a negative flux to the stacked emission and has an X-ray counterpart in Cappelluti et al. (2016) at an angular distance comparable to the extraction radius we used to derive its photometry (even after the statistical offset correction was applied to the Chandra PSF in Appendix A). As we used the optical positions, we are likely missing most of the X-ray photons accounted for in Cappelluti et al. (2016). This is not true for the Giallongo et al. (2015) sample, for which the X-ray fluxes are reported at the optical positions. Finally, as these objects are among the faintest ones detected in the CDF-S, their detection process can be affected by Eddington bias: due to flux statistical fluctuations, detection algorithms can detect sources with average flux below the sensitivity limit of a data-set. Increasing the exposure (e.g. from 4 to 7 Ms), the positive and negative flux fluctuations of a source tend to cancel out, and the measured flux tends to the average value, which is now more reliably measurable. This causes the measured fluxes of faint sources to be preferentially higher in shallower data than in the deeper data. We also note that 3 out of the 5 stacked sources are low-likelihood detections in the soft-band in Cappelluti et al. (2016), and therefore their fluxes should be considered as upper limits.
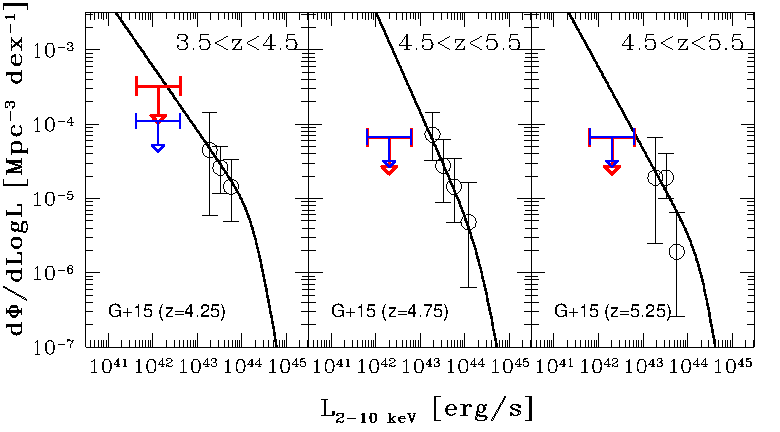
Giallongo et al. (2015) derived the UV LF of their sample of X-ray detected, high-redshift AGN candidates by deriving the absolute UV magnitude from the apparent optical magnitude in the filter closest to rest-frame at the redshift of each source. Despite the very different approach used, it is interesting to compare the AGN UV LF of Giallongo et al. (2015) with the CANDELS stacking results discussed in § 4.7. Thus, we transformed it into an X-ray LF by assuming a SED shape between and (as in Georgakakis et al. 2015), the Lusso et al. (2010) , and for the X-ray spectrum. Our upper limits do not agree with the Giallongo et al. (2015) AGN luminosity function, especially at (see Fig. 18). This could be due to the presence of spurious sources (especially among sources not detected in the 4 Ms CDF-S catalog of Xue et al. 2011) and/or of low-redshift interlopers in the Giallongo et al. (2015) high-redshift sample, which would result in an overestimate of the slope of the LF faint end and of its normalization. For instance, we note that 7 out of the 8 AGN detected in the 4 Ms CDF-S catalog by Xue et al. (2011) included in the Giallongo et al. (2015) sample, on the basis of the CANDELS photometric redshift (Dahlen et al., 2013), have a in Hsu et al. (2014), which used hybrid (AGN+galaxy) SED templates, with a particular focus on faint X-ray-detected AGN in the 4 Ms CDF-S. These potential issues would push the Giallongo et al. (2015) AGN LF to lower normalization, in the direction of reconciling it with our results. Recently, Madau & Haardt (2015) assumed the Giallongo et al. (2015) AGN LF to argue that AGN alone could in principle be responsible for the entire cosmic reionization, under quite strong assumptions, e.g. an escape fraction of hydrogen ionizing photons . The results discussed above tend to exclude such a possibility, consistent with previous works (e.g. Barger et al., 2003; Robertson et al., 2010; Robertson et al., 2013; Alvarez et al., 2012; Haardt & Madau, 2012; Grissom et al., 2014).
6 Conclusions and future perspectives
In this work, we have investigated the X-ray emission from CANDELS/GOODS-S galaxies by stacking data from the 7 Ms CDF-S, the deepest X-ray survey to date, reaching effective exposures of . We used the results to place constraints on the BHAD and SFRD due to individually undetected galaxies, and on the faint end of the AGN XLF at high redshift. In particular:
-
1.
We significantly () detected X-ray emission in the band from massive galaxies. Signal with lower significance (, confidence level) was detected from the entire sample (i.e. applying no mass cut). Remarkably, we detected a stacked X-ray signal from massive galaxies at at a confidence level ( ), the highest significance ever obtained for galaxies in the X-rays. Overall, X-ray emission is found to be dominated by massive galaxies, while no significant dependence on the sSFR has been found. See § 3.2 and § 3.3.
-
2.
The BHAD of individually undetected galaxies, derived under reasonable assumptions from the stacked signals or upper limits, is a factor of lower than that derived by previous works in the literature for the X-ray detected AGN population. This is true even under the least conservative assumption that all the X-ray emission from high-redshift galaxies is due to nuclear accretion (i.e. completely ignoring the contribution from XRB). Notably, the BHAD of a sample of X-ray detected, AGN in the CDF-S is in agreement with those works. This means that most of the cosmic BH growth at high redshift occurs in AGN which can be detected in deep X-ray surveys, while continuous, low-rate accretion in X-ray undetected galaxies (which represent by far the majority of the galaxy population) is negligible in the overall BHAD. See § 4.5 and § 5.1.
-
3.
Conversely, assuming that all the X-ray emission is due to XRB and using different scaling relations with the SFR, we found that the SFRD of stacked galaxies is consistent with UV-based results from the literature. Moreover, the total SFR derived from the stacked emission is in agreement with that derived from SED fitting and reported in the CANDELS/GOODS-S catalog. These results strongly suggest that most of the X-ray emission from individually undetected galaxies is due to XRB, and hence to star formation. See § 4.6 and § 5.2.
-
4.
We presented the first constraints on the faint-end () of the AGN XLF at high redshift. Our findings suggest that the faint-end slope is fairly flat, in agreement with previous works, but extending them down to lower luminosities. We also discussed why improving our knowledge of the evolution of the faint-end slope at high redshifts is important for understanding SMBH seeding and growth processes. See § 4.7 and § 5.3.
Improvements of this work and, in general, of our knowledge of high-redshift SMBH and galaxy formation and evolution will take advantage of new optical/IR and X-ray data. In particular, besides the ongoing and future ground-based spectroscopic campaigns in the GOODS-S field, like VUDS (Le Fèvre et al., 2015) and VANDELS (http://vandels.inaf.it), which will increase the redshift accuracy and completeness of high-redshift galaxy samples, the upcoming (2018) James Webb Space Telescope (JWST, Gardner et al., 2006, 2009) will provide extremely deep near-to-mid-IR imaging and spectroscopic data, which will open a completely new window on the formation and evolution of galaxies up to (Finkelstein et al., 2015). The study of the first galaxies is indeed among the main goals of the JWST mission. While JWST will dramatically increase the number of detected low-mass galaxies in the redshift range probed by this work, this will likely not have a strong impact on the results we presented, as most (if not all) of the X-ray emission comes from massive galaxies, already identified in existing optical/IR surveys. However, two major improvements due to JWST can be foreseen: (1) the galaxy sample selection will be greatly improved by the extremely deep spectroscopic and photometric data provided by JWST, resulting in better redshift identifications, more accurate low-redshift interloper removal and thus cleaner stacked samples, and (2) the redshift range of this work will be extended up to . The last point, in particular, means that we will be able to break into a crucial epoch for our understanding of SMBH and galaxy formation. For instance, sampling the faint-end of the AGN LF at will directly probe SMBH seeding mechanisms in the early universe (see § 5.3).
A major step forward in the characterization of the X-ray emission from high-redshift AGN will be taken with the Athena X-ray Observatory (Nandra et al., 2013), which is expected to detect hundreds of AGN at and, in particular, tens with luminosities as low as (Aird et al., 2013). Although Athena, which will be launched in , will not reach the faint fluxes probed by the central region of the 7 Ms CDF-S (because of the confusion limit imposed by its expected angular resolution at very low fluxes), it will survey much larger areas (tens of square degrees) at medium-to-deep sensitivities, thanks to its survey power which is times faster than that of Chandra or XMM-Newton. Therefore, while it cannot probe the very faint-end of the AGN XLF, Athena will provide valuable new data for studying the evolution of AGN up to and the X-ray properties of rare, powerful quasars perhaps at even higher redshift. On the basis of the results discussed in this paper (i.e. most of the BHAD at high redshift occurs in moderate-to-high luminosity AGN), X-ray surveys covering wide areas at relatively faint fluxes are best suited to study the black hole accretion history in the early Universe, which is one of the key goals of the Athena mission. Valuable wide X-ray surveys would also be provided by the proposed Wide Field X-ray Telescope (WFXT, http://www.wfxt.eu/) mission, which, with its field of view, angular resolution, and collecting area ten times larger than that of Chandra, would be a near-perfect survey machine.
The results presented in this paper are relevant to the proposed X-Ray Surveyor mission (Weisskopf et al., 2015) and, in turn, will be greatly improved by the X-ray data it will provide. X-Ray Surveyor is the natural successor of Chandra, matching its angular resolution, but with a much larger field of view () and sensitivity (). These characteristics are reflected in its survey speed, which is a factor of faster than Chandra. The X-Ray Surveyor sensitivity will allow sampling of the faint end of the high-redshift AGN XLF and extension of the results of this work. In turn, the evaluation of the number of high-redshift, low-luminosity AGN expected to be detected by X-Ray Surveyor must take into account the apparent flatness of the XLF faint end at high redshift, which will limit the low-luminosity source yields. Likely, X-Ray Surveyor will be the first X-ray mission which will directly (i.e. by detecting individual objects) sample the very faint-end regime of the AGN XLF at and probe its slope, thus providing us with the needed data (see § 5.3), complementary to those provided by JWST and Athena, to understand the formation and early growth mechanisms of the first SMBH.
Acknowledgments
We thank the anonymous referee for the useful discussion, which improved this work. FV, WNB, and GY acknowledge support from Chandra X-ray Center grant GO4-15130A and the V.M. Willaman Endowment. FV, RG, CV, and AC acknowledge support from INAF under the contract PRIN-INAF-2014. YQX acknowledges support from the National Thousand Young Talents program, the 973 Program (2015CB857004), NSFC-11473026, NSFC-11421303, the Strategic Priority Research Program of CAS (XDB09000000), and the Fundamental Research Funds for the Central Universities.
References
- Aird et al. (2010) Aird J., et al., 2010, MNRAS, 401, 2531
- Aird et al. (2013) Aird J., et al., 2013, preprint, (arXiv:1306.2325)
- Aird et al. (2015) Aird J., Coil A. L., Georgakakis A., Nandra K., Barro G., Pérez-González P. G., 2015, MNRAS, 451, 1892
- Alvarez et al. (2012) Alvarez M. A., Finlator K., Trenti M., 2012, ApJ, 759, L38
- Bañados et al. (2014) Bañados E., et al., 2014, AJ, 148, 14
- Barger et al. (2003) Barger A. J., Cowie L. L., Capak P., Alexander D. M., Bauer F. E., Brandt W. N., Garmire G. P., Hornschemeier A. E., 2003, ApJ, 584, L61
- Barger et al. (2005) Barger A. J., Cowie L. L., Mushotzky R. F., Yang Y., Wang W.-H., Steffen A. T., Capak P., 2005, AJ, 129, 578
- Basu-Zych et al. (2013a) Basu-Zych A. R., et al., 2013a, ApJ, 762, 45
- Basu-Zych et al. (2013b) Basu-Zych A. R., et al., 2013b, ApJ, 774, 152
- Bauer et al. (2002) Bauer F. E., Alexander D. M., Brandt W. N., Hornschemeier A. E., Vignali C., Garmire G. P., Schneider D. P., 2002, AJ, 124, 2351
- Beckwith et al. (2006) Beckwith S. V. W., et al., 2006, AJ, 132, 1729
- Belczynski et al. (2002) Belczynski K., Kalogera V., Bulik T., 2002, ApJ, 572, 407
- Belczynski et al. (2008) Belczynski K., Kalogera V., Rasio F. A., Taam R. E., Zezas A., Bulik T., Maccarone T. J., Ivanova N., 2008, ApJS, 174, 223
- Bonoli et al. (2014) Bonoli S., Mayer L., Callegari S., 2014, MNRAS, 437, 1576
- Bouwens et al. (2015) Bouwens R. J., et al., 2015, ApJ, 803, 34
- Boyle & Terlevich (1998) Boyle B. J., Terlevich R. J., 1998, MNRAS, 293, L49
- Brandt & Alexander (2015) Brandt W. N., Alexander D. M., 2015, A&ARv, 23, 1
- Brandt et al. (2001) Brandt W. N., Hornschemeier A. E., Schneider D. P., Alexander D. M., Bauer F. E., Garmire G. P., Vignali C., 2001, ApJ, 558, L5
- Brusa et al. (2009) Brusa M., et al., 2009, ApJ, 693, 8
- Buchner et al. (2015) Buchner J., et al., 2015, ApJ, 802, 89
- Cappelluti et al. (2016) Cappelluti N., et al., 2016, ApJ, 823, 95
- Civano et al. (2011) Civano F., et al., 2011, ApJ, 741, 91
- Civano et al. (2012) Civano F., et al., 2012, ApJS, 201, 30
- Cowie et al. (1996) Cowie L. L., Songaila A., Hu E. M., Cohen J. G., 1996, AJ, 112, 839
- Cowie et al. (2012) Cowie L. L., Barger A. J., Hasinger G., 2012, ApJ, 748, 50
- Dahlen et al. (2013) Dahlen T., et al., 2013, ApJ, 775, 93
- Damen et al. (2009) Damen M., Labbé I., Franx M., van Dokkum P. G., Taylor E. N., Gawiser E. J., 2009, ApJ, 690, 937
- Delvecchio et al. (2014) Delvecchio I., et al., 2014, MNRAS, 439, 2736
- Dickinson et al. (2003) Dickinson M., Giavalisco M., GOODS Team 2003, in Bender R., Renzini A., eds, The Mass of Galaxies at Low and High Redshift. p. 324 (arXiv:astro-ph/0204213), doi:10.1007/10899892˙78
- Ebrero et al. (2009) Ebrero J., et al., 2009, A&A, 493, 55
- Efron & Tibshirani (1993) Efron B., Tibshirani R. J., 1993, An introduction to the bootstrap. Chapman&Hall/CRC
- Fan et al. (2006a) Fan X., et al., 2006a, AJ, 131, 1203
- Fan et al. (2006b) Fan X., et al., 2006b, AJ, 132, 117
- Ferrarese & Merritt (2000) Ferrarese L., Merritt D., 2000, ApJ, 539, L9
- Finkelstein et al. (2015) Finkelstein S. L., Dunlop J., Le Fevre O., Wilkins S., 2015, preprint, (arXiv:1512.04530)
- Fotopoulou et al. (2016) Fotopoulou S., et al., 2016, A&A, 587, A142
- Fragos et al. (2013) Fragos T., et al., 2013, ApJ, 764, 41
- Gardner et al. (2006) Gardner J. P., et al., 2006, Space Sci. Rev., 123, 485
- Gardner et al. (2009) Gardner J. P., et al., 2009, Astrophysics and Space Science Proceedings, 10, 1
- Gebhardt et al. (2000) Gebhardt K., et al., 2000, ApJ, 539, L13
- Georgakakis et al. (2015) Georgakakis A., et al., 2015, MNRAS, 453, 1946
- Giallongo et al. (2015) Giallongo E., et al., 2015, A&A, 578, A83
- Gilli et al. (2007) Gilli R., Comastri A., Hasinger G., 2007, A&A, 463, 79
- Gilli et al. (2011) Gilli R., et al., 2011, Memorie della Societa Astronomica Italiana Supplementi, 17, 85
- Grissom et al. (2014) Grissom R. L., Ballantyne D. R., Wise J. H., 2014, A&A, 561, A90
- Grogin et al. (2011) Grogin N. A., et al., 2011, ApJS, 197, 35
- Gültekin et al. (2009) Gültekin K., et al., 2009, ApJ, 698, 198
- Guo et al. (2011) Guo Q., et al., 2011, MNRAS, 413, 101
- Guo et al. (2013) Guo Y., et al., 2013, ApJS, 207, 24
- Haardt & Madau (2012) Haardt F., Madau P., 2012, ApJ, 746, 125
- Haiman (2013) Haiman Z., 2013, in Wiklind T., Mobasher B., Bromm V., eds, Astrophysics and Space Science Library Vol. 396, The First Galaxies. p. 293 (arXiv:1203.6075), doi:10.1007/978-3-642-32362-1˙6
- Hasinger et al. (2005) Hasinger G., Miyaji T., Schmidt M., 2005, A&A, 441, 417
- Hickox & Markevitch (2006) Hickox R. C., Markevitch M., 2006, ApJ, 645, 95
- Hiroi et al. (2012) Hiroi K., Ueda Y., Akiyama M., Watson M. G., 2012, ApJ, 758, 49
- Hopkins & Beacom (2006) Hopkins A. M., Beacom J. F., 2006, ApJ, 651, 142
- Hopkins et al. (2007) Hopkins P. F., Richards G. T., Hernquist L., 2007, ApJ, 654, 731
- Hopkins et al. (2008) Hopkins P. F., Hernquist L., Cox T. J., Kereš D., 2008, ApJS, 175, 356
- Hopkins et al. (2014) Hopkins P. F., Kocevski D. D., Bundy K., 2014, MNRAS, 445, 823
- Hsu et al. (2014) Hsu L.-T., et al., 2014, ApJ, 796, 60
- Jiang et al. (2008) Jiang L., et al., 2008, AJ, 135, 1057
- Jiang et al. (2009) Jiang L., et al., 2009, AJ, 138, 305
- Kalberla et al. (2005) Kalberla P. M. W., Burton W. B., Hartmann D., Arnal E. M., Bajaja E., Morras R., Pöppel W. G. L., 2005, A&A, 440, 775
- Kalfountzou et al. (2014) Kalfountzou E., Civano F., Elvis M., Trichas M., Green P., 2014, MNRAS, 445, 1430
- Koekemoer et al. (2011) Koekemoer A. M., et al., 2011, ApJS, 197, 36
- La Franca et al. (2005) La Franca F., et al., 2005, ApJ, 635, 864
- Le Fèvre et al. (2015) Le Fèvre O., et al., 2015, A&A, 576, A79
- Lehmer et al. (2010) Lehmer B. D., Alexander D. M., Bauer F. E., Brandt W. N., Goulding A. D., Jenkins L. P., Ptak A., Roberts T. P., 2010, ApJ, 724, 559
- Lehmer et al. (2012) Lehmer B. D., et al., 2012, ApJ, 752, 46
- Lodato & Natarajan (2006) Lodato G., Natarajan P., 2006, MNRAS, 371, 1813
- Lusso et al. (2010) Lusso E., et al., 2010, A&A, 512, A34
- Lusso et al. (2012) Lusso E., et al., 2012, MNRAS, 425, 623
- Madau & Dickinson (2014) Madau P., Dickinson M., 2014, ARA&A, 52, 415
- Madau & Haardt (2015) Madau P., Haardt F., 2015, ApJ, 813, L8
- Magorrian et al. (1998) Magorrian J., et al., 1998, AJ, 115, 2285
- Marconi & Hunt (2003) Marconi A., Hunt L. K., 2003, ApJ, 589, L21
- Marconi et al. (2004) Marconi A., Risaliti G., Gilli R., Hunt L. K., Maiolino R., Salvati M., 2004, MNRAS, 351, 169
- Miller et al. (2015) Miller B. P., Gallo E., Greene J. E., Kelly B. C., Treu T., Woo J.-H., Baldassare V., 2015, ApJ, 799, 98
- Mineo et al. (2012) Mineo S., Gilfanov M., Sunyaev R., 2012, MNRAS, 419, 2095
- Miyaji et al. (2000) Miyaji T., Hasinger G., Schmidt M., 2000, A&A, 353, 25
- Miyaji et al. (2015) Miyaji T., et al., 2015, ApJ, 804, 104
- Mortlock et al. (2011) Mortlock D. J., et al., 2011, Nature, 474, 616
- Nandra et al. (2013) Nandra K., et al., 2013, preprint, (arXiv:1306.2307)
- Ranalli et al. (2003) Ranalli P., Comastri A., Setti G., 2003, A&A, 399, 39
- Ranalli et al. (2005) Ranalli P., Comastri A., Setti G., 2005, A&A, 440, 23
- Ranalli et al. (2015) Ranalli P., et al., 2015, preprint, (arXiv:1512.05563)
- Robertson et al. (2010) Robertson B. E., Ellis R. S., Dunlop J. S., McLure R. J., Stark D. P., 2010, Nature, 468, 49
- Robertson et al. (2013) Robertson B. E., et al., 2013, ApJ, 768, 71
- Santini et al. (2015) Santini P., et al., 2015, ApJ, 801, 97
- Sijacki et al. (2015) Sijacki D., Vogelsberger M., Genel S., Springel V., Torrey P., Snyder G. F., Nelson D., Hernquist L., 2015, MNRAS, 452, 575
- Silverman et al. (2008) Silverman J. D., et al., 2008, ApJ, 679, 118
- Skelton et al. (2014) Skelton R. E., et al., 2014, ApJS, 214, 24
- Soltan (1982) Soltan A., 1982, MNRAS, 200, 115
- Steffen et al. (2004) Steffen A. T., Barger A. J., Capak P., Cowie L. L., Mushotzky R. F., Yang Y., 2004, AJ, 128, 1483
- Symeonidis et al. (2014) Symeonidis M., et al., 2014, MNRAS, 443, 3728
- Thomas et al. (2005) Thomas D., Maraston C., Bender R., Mendes de Oliveira C., 2005, ApJ, 621, 673
- Tozzi et al. (2006) Tozzi P., et al., 2006, A&A, 451, 457
- Treister et al. (2013) Treister E., Schawinski K., Volonteri M., Natarajan P., 2013, ApJ, 778, 130
- Trump et al. (2015) Trump J. R., et al., 2015, ApJ, 811, 26
- Ueda et al. (2003) Ueda Y., Akiyama M., Ohta K., Miyaji T., 2003, ApJ, 598, 886
- Ueda et al. (2014) Ueda Y., Akiyama M., Hasinger G., Miyaji T., Watson M. G., 2014, ApJ, 786, 104
- Venemans et al. (2013) Venemans B. P., et al., 2013, ApJ, 779, 24
- Venemans et al. (2015a) Venemans B. P., et al., 2015a, MNRAS, 453, 2259
- Venemans et al. (2015b) Venemans B. P., et al., 2015b, ApJ, 801, L11
- Vignali et al. (2002) Vignali C., Bauer F. E., Alexander D. M., Brandt W. N., Hornschemeier A. E., Schneider D. P., Garmire G. P., 2002, ApJ, 580, L105
- Vito et al. (2013) Vito F., et al., 2013, MNRAS, 428, 354
- Vito et al. (2014) Vito F., Gilli R., Vignali C., Comastri A., Brusa M., Cappelluti N., Iwasawa K., 2014, MNRAS, 445, 3557
- Volonteri (2010) Volonteri M., 2010, A&ARv, 18, 279
- Volonteri et al. (2016) Volonteri M., Dubois Y., Pichon C., Devriendt J., 2016, preprint, (arXiv:1602.01941)
- Weigel et al. (2015) Weigel A. K., Schawinski K., Treister E., Urry C. M., Koss M., Trakhtenbrot B., 2015, MNRAS, 448, 3167
- Weisskopf et al. (2015) Weisskopf M. C., Gaskin J., Tananbaum H., Vikhlinin A., 2015, in EUV and X-ray Optics: Synergy between Laboratory and Space IV. (arXiv:1505.00814)
- Willott et al. (2003) Willott C. J., McLure R. J., Jarvis M. J., 2003, ApJ, 587, L15
- Willott et al. (2009) Willott C. J., et al., 2009, AJ, 137, 3541
- Wu et al. (2015) Wu X.-B., et al., 2015, Nature, 518, 512
- Xue et al. (2011) Xue Y. Q., et al., 2011, ApJS, 195, 10
- Xue et al. (2012) Xue Y. Q., et al., 2012, ApJ, 758, 129
- Yencho et al. (2009) Yencho B., Barger A. J., Trouille L., Winter L. M., 2009, ApJ, 698, 380
- Zhang et al. (2012) Zhang Z., Gilfanov M., Bogdán Á., 2012, A&A, 546, A36
- van der Marel et al. (2002) van der Marel R. P., Alves D. R., Hardy E., Suntzeff N. B., 2002, AJ, 124, 2639
Appendix A Approximating the Chandra PSF with circular regions through accurate simulations
The aperture photometry procedure described in § 2 requires a good knowledge of the PSF fraction enclosed in the radii used to extract the number of counts. However, the Chandra PSF is known to have a complex shape, varying over the field of view (f.o.v.). While circular regions are generally good approximations at low off-axis angles (), the PSF shape changes dramatically at large . Moreover, the PSF is slightly different on different chips and on different positions on the same chip, at a given . Knowing the exact PSF shape over the f.o.v. is therefore very difficult. This is why it is generally approximated by a circular region with radius varying with . The radial dependence was parametrized differently by different authors (e.g. Hickox & Markevitch, 2006). In this appendix, we use simulated images of the CDF-S to derive an accurate parametrization of the Chandra PSF in the GOODS-S field.
The simulated Chandra observations were created with the MARX 5.1.0101010http://space.mit.edu/cxc/marx/ and SAOTRACE 2.0.4111111http://cxc.harvard.edu/cal/Hrma/SAOTrace.html software. We simulated sources at random positions in the CANDELS field with a monochromatic spectrum () and very high fluxes (). The chosen energy corresponds to the peak of the Chandra efficiency in the soft band. No background was added at this stage. Doing this, we exactly know the detected number of simulated counts for each source, with no statistical issues related to low count rates and background subtraction.121212In § 2.1 we simulated the 4 Ms CDF-S observation in order to validate the stacking procedure. In that case, sources were not simulated with the same high flux but with the distribution of fluxes taken from the Gilli et al. (2007) Log-Log relation and we also included the background obtained by masking all the X-ray detected sources in the 4 Ms CDF-S.
As we applied the stacking procedure on the final 7 Ms CDF-S image, resulting from merging tens of images, we need to account for the different positions each single source has in different observations. To achieve such a result, each source was simulated once per pointing, reproducing exactly the aim point, roll angle, exposure, date and detector offset of the real observations. We used the MARX internal dithering model and an aspect blur of .
The simulated images are then reprojected and merged by the CIAO reproject_obs tool. Through aperture photometry we derived the radii of the circular regions which include 30% to 90%, in steps of 5%, of the total simulated photons in the merged image. Simulating sources we homogeneously covered the CANDELS field. We then fitted the radius corresponding to each EEF as a function of the off-axis angle (, in arcmin), with the function (following Hickox & Markevitch 2006):
| (12) |
where and , the radius corresponding to the desired EEF at and , respectively, are free parameters, as well as the index . The best-fit parameters are reported in Tab. 7. In Fig. 19, upper panel, we show the analytical function fitted to the individual radii corresponding to the 30, 50, and 90% EEF and, lower panel, the resulting best-fit radii as a function of for the considered EEF (in steps of 10% for clarity). Fig. 20 shows the counts included in the 50% EEF radius for individual, simulated sources plotted against the total simulated (i.e. 100% EEF) counts, demonstrating the accuracy of both the best-fitting analytical form and the aperture-photometry procedure. Given that the roll-angles vary for each pointing, each source can be located in more than one chip in different observations. However, each source, depending on the position on the sky, is generally located preferentially in 1–2 chips. For simplicity, we fitted the average behaviour across the chips.
The curves of constant EEF as a function of were derived under the assumption that the circular extraction regions are centred on the X-ray positions. However, in § 3 we stacked the CANDELS optical positions. Considering the catalog of X-ray detected sources and relative CANDELS counterparts, although on average there is no significant offset between the optical and X-ray positions, the offset scattering at low off-axis angles is comparable to the PSF size (see § 3.2). This causes the EEF at a given corresponding to a given extraction radius to be underestimated, as the extraction region is not centred on the X-ray source. In order to take this effect into account, we fitted again the simulated sources, statistically accounting for the scattering of the optical-X-ray position offsets. In particular, for each simulated X-ray source, we derived the aperture photometry 25 times, each time centring the extraction regions at a distance randomly drawn from a Gaussian distribution with equal to the observed offset scattering. The resulting parameters and curves are reported in Tab. 7 and shown in Fig. 19 (lower panel) as solid curves. As expected, accounting for the positional offset scatter causes the radii corresponding to a given EEF to be larger with respect to the case in which no offset is considered (i.e. centring the extraction regions at the X-ray positions). The difference is larger at small , where the positional-offset scatter is comparable to the extraction-region sizes, while at large the curves, where the offset scatter is negligible with respect to the extraction-region sizes, converge. By artificially including a broadening due to the offset scattering, we derive an “effective” PSF (continuous lines in Fig. 19) which should not be confused with the true PSF (dashed lines).
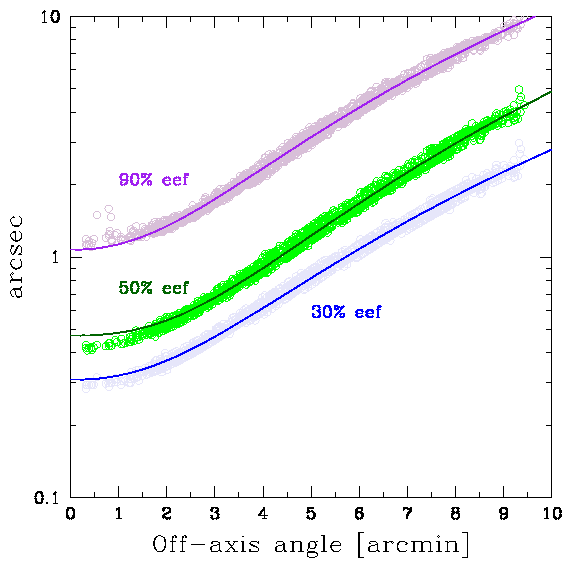
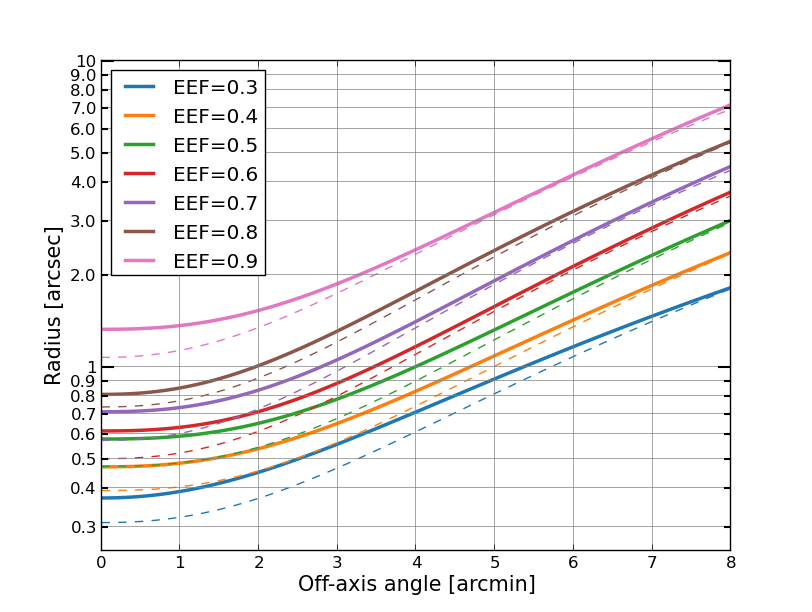
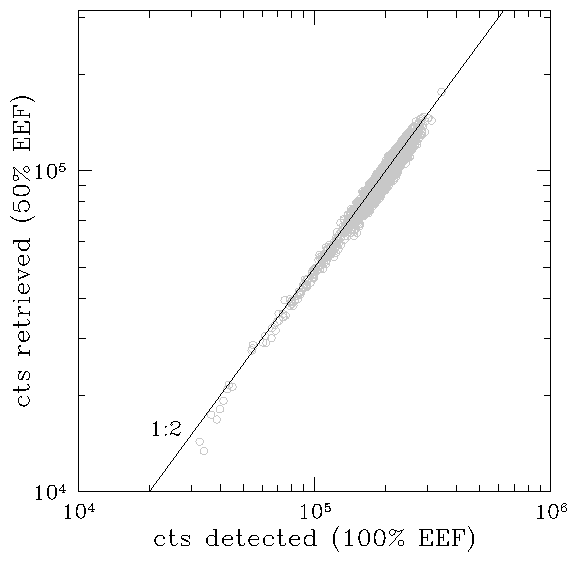
.
EEF
no offset
offset
0.30
0.31
2.49
2.29
0.37
2.30
2.09
0.35
0.35
2.91
2.36
0.40
2.76
2.21
0.40
0.39
3.40
2.48
0.47
3.22
2.39
0.45
0.42
3.87
2.50
0.50
3.83
2.47
0.50
0.47
4.40
2.54
0.58
4.27
2.52
0.55
0.50
4.93
2.54
0.60
4.75
2.50
0.60
0.50
5.31
2.38
0.62
5.44
2.50
0.65
0.55
5.90
2.40
0.66
5.93
2.45
0.70
0.57
6.39
2.31
0.71
6.59
2.46
0.75
0.64
7.07
2.32
0.72
7.13
2.35
0.80
0.74
7.89
2.34
0.81
7.74
2.28
0.85
0.82
8.55
2.24
0.95
8.76
2.30
0.90
1.07
9.65
2.22
1.32
10.1
2.42
Appendix B Assessing the photometric-redshift accuracy
To quantify the photometric-redshift accuracy, we computed the quantity
| (13) |
for all X-ray-undetected galaxies with a high-quality spectroscopic redshift in the Santini et al. (2015) catalog. Considering galaxies at , the median is 0.013, with first and third quartiles (Q1 and Q3; corresponding to 25% and 75% of the ordered values) of 0.004 and 0.021, respectively. Considering all galaxies with spectroscopic redshifts (i.e. applying no redshift cut), the median is 0.020 with Q1 and Q3 equal to 0.009 and 0.038, respectively.
In Fig. 21 we plot the photometric-redshift accuracy as a function of redshift and magnitude to look for a possible degradation at high redshifts and faint magnitudes, typical of our samples of stacked galaxies. We also plotted the curves corresponding to the normalized median absolute deviation
| (14) |
where , separately for positive () and negative () . From Fig. 21 we conclude there is no apparent decrease in the photometric-redshift accuracy at high redshift and faint magnitudes.
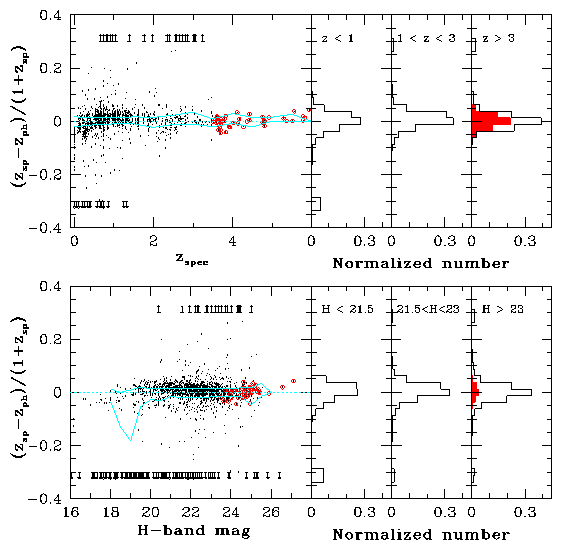
These results testify to the good quality of CANDELS photometric redshifts at . Although we did not find an evident degradation of the photometric redshift accuracy at faint magnitudes, the test was performed by construction on the sub-population of CANDELS galaxies for which a spectroscopic redshift was available; these are typically bright () galaxies. Considering fainter galaxies with no spectroscopic identification, the photometric redshift accuracy is expected to be worse: for this reason we will investigate in § C the importance of redshift uncertainties for our results.
Appendix C The impact of photometric-redshift uncertainties on the stacking results
For the sake of simplicity, throughout this work we used the nominal photometric redshifts (i.e. not considering their errors). Although in Appendix B we quantitatively demonstrated the reliability of CANDELS photometric redshifts at for galaxies with magnitude , even a small number of low-redshift interlopers could in principle affect our results. While the proper treatment of photometric redshift uncertainties would be to weight the contribution of every single galaxy to the total stacked count-rate in a redshift bin considering its Probability Distribution Function (PDF), the computational cost is very expensive (i.e. tens of thousands of CANDELS galaxies would be stacked for each redshift bin, most of which would contribute to the stacked signal with very little weight, since only a small fraction of their PDF overlaps with the considered redshift ranges). Moreover, CANDELS photometric redshifts are evaluated by weighting 6 different PDFs for each object, derived with different SED-fitting codes and assumptions (Dahlen et al., 2013).
In this section, we use a Monte Carlo procedure to assess how much the stacked count-rates derived in § 3.2 are affected by contamination due to redshift uncertainties. Santini et al. (2015) provide the 68% confidence interval of the photometric redshift of each CANDELS galaxy. We considered all galaxies for which that interval overlaps the redshift range considered in this work () and for each of them extracted randomly a redshift from a Gaussian distribution having the nominal redshift as mean and the redshift error as , i.e. we approximated the individual PDFs with Gaussian functions. Spectroscopic redshifts were always assigned to galaxies for which they are available (see § 3.1). We then stacked the count rates of galaxies which fall into the redshift bins of interest, according to the redshift assigned by the random extraction, and compute the SNR as we did in § 3.2. This procedure was repeated 1000 times, returning a distribution of SNR for each redshift bin. Fig. 22 shows the distribution of SNR derived with the Monte Carlo procedure and the SNR measured in § 3.2 in the three redshift bins. The measured SNRs are consistent with the values expected accounting for photometric-redshift uncertainties, although there is a slight offset for the highest redshift bin. We conclude that our results are not significantly affected by contamination from objects wrongly placed in the considered redshift bins. The same conclusion was reached assuming for each galaxy a flat PDF in the 68% confidence interval, with zero probability that the real redshift is outside this interval.
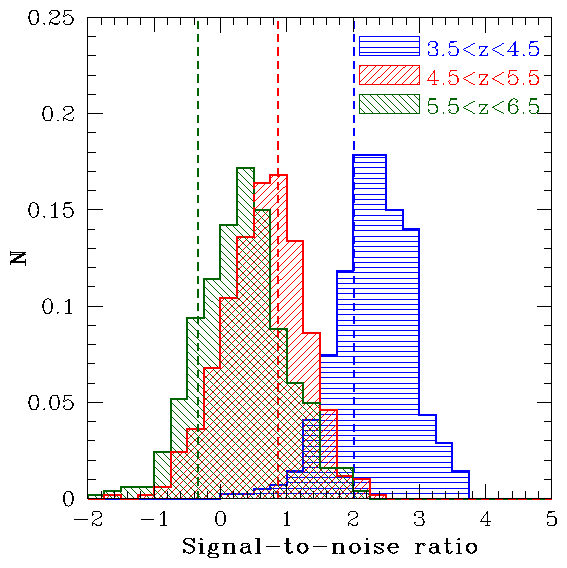
Appendix D Stacking a sample of Lyman Break selected galaxies
In order to check how much the stacking results for CANDELS galaxies depend on the particular selection approach, we used a different selection and stacked a sample of Lyman-break galaxies (LBG) from Bouwens et al. (2015) at . Although the considered CANDELS and LBG samples are not independent (being selected using the same optical/IR observations), it is worth investigating the results obtained using a different selection method. As we did for the CANDELS galaxies, we applied a magnitude cut at to the LBG sample in order to keep the incompleteness of the stacked samples low, and considered only LBG within arcmin of the 7 Ms CDF-S average aim point. Tab. 8 reports the stacking results for the samples of LBG. As for CANDELS galaxies, we detected stacked X-ray emission in the soft-band only for the sample (with SNR, similar to that derived by stacking CANDELS galaxies in the same redshift bin), while no detection is obtained for higher redshift galaxies (see also Basu-Zych et al. 2013a). This reassures us about the robustness of our results against the particular selection approach applied.
We note that these are the best constraints on the stacked X-ray emission of galaxies at redshifts up to 8. In fact, the samples of LBG at are the largest ever stacked and the X-ray data used are the deepest available to date. We reach flux limits of .
The overlap between the stacked LBG (3519 galaxies) and CANDELS (2076 galaxies) samples, matched within a radius, consists of 1350 galaxies. We show in Fig. 23 the overlap among the single, redshift-defined subsamples. We note that Bouwens et al. (2015) ran their own detection pipeline and reported only sources which passed the Lyman-break selection. It is therefore difficult to establish if high-redshift CANDELS galaxies not included by Bouwens et al. (2015) did not pass the Lyman-break selection or were not detected at all. We note that the stacked galaxies included in both the CANDELS and LBG samples and those included only in the CANDELS sample have similar magnitude distributions, while those included only in the LBG sample are typically fainter (by ). Moreover, the individual redshift bins defined for LBG in Bouwens et al. (2015) overlap (e.g. fig.1 in Bouwens et al. 2015 shows that an LBG at has roughly the same probability of being included in the or sample, but it also has a small probability to be included in the sample; this is due to the Lyman-break method itself) and do not correspond exactly to the ones we defined.
| Exp. | ||||||
| mag | () | () | ||||
| (1) | (2) | (3) | (4) | (5) | (6) | (7) |
| 4 | 2444 | 26.4 | 14.33 | |||
| 5 | 673 | 26.7 | 3.95 | |||
| 6 | 259 | 26.8 | 1.52 | |||
| 7 | 107 | 27.1 | 0.62 | |||
| 8 | 36 | 27.1 | 0.21 |
(1) redshift; (2) number of stacked LBG; (3) average -band magnitude; (4) total exposure time; (5) total weighted net count-rate and (6) corresponding flux (corrected for the EEF) in the soft band; (7) signal-to-noise ratio derived from the bootstrap procedure.
