-
May 2016
Critical Telomerase Activity for Uncontrolled Cell Growth
Abstract
The lengths of the telomere regions of chromosomes in a population of cells are modelled using a chemical master equation formalism, from which the evolution of the average number of cells of each telomere length is extracted. In particular, the role of the telomere-elongating enzyme telomerase on these dynamics is investigated. We show that for biologically relevant rates of cell birth and death, one finds a critical rate, , of telomerase activity such that the total number of cells diverges. Further, is similar in magnitude to the rates of mitosis and cell death. The possible relationship of this result to replicative immortality and its associated hallmark of cancer is discussed.
Keywords: Mathematical chromosome biology, telomeres, telomerase, replicative immortality, mathematical modelling of cancer
Published: Physical Biology 13 (2016) 046005
1 Introduction
A healthy mature individual undergoes cellular replication and division in a variety of tissue types and blood cells. Associated with these events is the shortening of repeat units at the ends of each chromosome called telomeres. Telomeres were first recognized in the 1930’s as special structures capping the ends of chromosomes, the cell’s genetic material. Further research has identified telomeres to be important components in a variety of cellular processes, the most important being replication [1]. Cellular replication involves one cell dividing itself into two identical copies, each containing a full copy of the genetic material. It was proposed [2] that a generational clock may be associated with the progressive shortening of the telomeres. The decreasing lengths of telomeres have been found to be involved in aging, with shorter telomeres associated with advanced age. There is a complicated and not always consistent association between telomere length and human diseases such as cancer [3].
The replication of the cell’s linear chromosomes is a inherently destructive process, in that each replication causes a shortening of the chromosome through a phenomenon known as the end-replication problem [2, 4]. Cells are able to protect their (coding) genetic material by instead allowing telomeres to shorten [1]. Further, in the absence of particular proteins and processes (discussed below) there exists a limited number of such divisions before which the cell reaches the so-called Hayflick limit [5, 6]. Cells whose telomeres have been shortened to this critically short length are said to have reached replicative senescence.
While almost all eukaryotic cells contain chromosomes and telomeres (read: not mature red blood cells), there are only some cell types that are actively dividing throughout adulthood. Other cells instead have lifetimes on the same order as the organism itself, and thus divide rarely or not at all. Leukocytes, or white blood cells, are among the cell types that regularly divide. Leukocytes encompass multiple different types of mono-nucleated blood cells including lymphocytes, viz. B cells and T cells, as well as granulocytes. These cells are involved in the cellular component of immune response, and thus they experience large cellular turnover and are required to maintain large, dynamic populations. (The function and behaviour and, in fact, the names of these cells change with repeated sequences of replication.) The ease with which leukocytes can be extracted and analyzed, especially when compared to other rapidly dividing cell types, such as colon crypt cells, makes them the perfect subject for analyzing the Hayflick limit and telomere length dynamics.
All blood cells, white or red, originate as hematopoietic stem cells within the bone marrow. These stem cells are pluripotent, self-renewing cells capable of differentiating into unique types of hematopoietic progenitor cells, which then mature into peripheral blood cells [7]. The hematopoietic stem cells are considered to be “immortal cells”, and are believed to maintain their telomere length by means of the enzyme telomerase. The kinetics of B, NK and T cells, and other leukocytes has been studied extensively, and values have been obtained for their proliferation and the death rates. Some estimated values are shown in Table 1.
| Cell Type | Mitotic Rate (/week) | Death Rate (/week) |
|---|---|---|
| Memory T-Cells [8] | 0.02 - 0.03 | 0.02 - 0.03 |
| Mature B-Cells [9] | 0.5 | 0.48 |
| Neutrophiles [10] | 0.042 | 0.042 |
As cells divide and multiply the end-replication problem causes chromosomal shortening. The level of attrition in leukocytes has been measured and most estimates of the number of base pairs lost per division range from 50 to 100 bp, with the highest estimate at 120 bp/division [11, 12]. This value is not uniform across species or even between individuals, with the exact figure changing greatly between individuals and different cells types. Leukocytes were found to be able to divide on average 23 times before reaching senescence [13]. Similiar to the amount of base pairs lost per cell division, the Hayflick limit varies greatly among different cell types. For human fibroblasts between 14 and 29 divisions were observed, while for human embryos the limit was found to be between 35 and 63 divisions [5].
The role of the telomerase enzyme is to elongate telomeres, effectively mitigating the effects of telomere shortening. It is composed of an RNA structural protein complex termed TERC (hTERC in humans) and a catalytic protein complex known as TERT (hTERT in humans). As with all proteins, the function is dependent upon the structure. Telomerase acts by positioning itself along the telomeric region of DNA with its intrinsic strand of RNA bases aligning with the overhang of the chromosome. In humans the alignment function is carried out by hTERC. The intrinsic RNA component, hTERT in humans, is a single strand of RNA with base pairs which complement the nucleotides on the telomere. In the case of humans this corresponds to AAUCCC; this motif is repeated roughly three times (uracil replacing thymine in hTERT is not an issue, as both result in complimentary base pairing with adenine). Using standard biological syntax the RNA bases of hTERT would be expressed as -AAUCCCAAUCCCAAUCCC-. The labeling is due to the fact that telomerase elongates in the to direction. This leads to the addition of a -TTAGGGTTAGGGTTAGGG- section being added to the overhang. DNA polymerase then elongates the complimentary strand, thereby elongating the double stranded section of the telomere. The positioning of DNA polymerase still requires an RNA primer, which is not replaced, thus the overhang remains. The exact mechanism of this elongation was first elucidated in 1991 by Greider [14].
There are many approaches possible to model the complex biology of telomere dynamics, and a recent in-depth review of much of this work is included in a recently been published study [15]. Therefore, we refrain from providing an exhaustive listing of previously published work. Of particular relevance to this paper are the models of Itzkovitz et al [16] and the revision of their model introduced by Cyrenne and one of us [17]. In particular, these models examined the various properties of a population of cells that underwent replication and death that included an index tracking the generational age of each cell. In this paper we extend these studies to include, in the simplest fashion possible, the effect of the telomere-elongating protein telomerase on such populations. The work of Hirt et al [15], like our study, also incorporates telomerase into the modelling. It provides a detailed theory predicting the distribution of telomere lengths and its dependence on telomerase. However, unlike their work, our paper only seeks to provide the simplest possible mathematical representation of the role of the variable activity of telomerase on these dynamics. That is, we follow the number of cells of each generational age at a given chronological time. Because of and in spite of the simplicity of our model, we are able to extract information regarding the dynamics that result if the expression of the telomerase enzyme exceeds a critical value. Further, we show, subject to the limitations of the coarse model we employ, that this critical value is not that different from the mitotic and cell death rates that are found in healthy cells. Other models have identified cell immortality, and in an elegant fashion include the role of stochasticity, such as that of Antal et al [18]. However, here we study a different mechanism of telomere elongation, that is telomerase and not telomere sister chromatid exchange, and focus on how a divergence of cell population numbers are produced by the activity of telomerase.
2 Levels of Telomerase in Humans
The literature includes ample qualitative discussion of telomerase levels in cancerous cells [19], as well as the repeated statement that in almost healthy (non stem cell) tissues the level of this enzyme is effectively zero [20]. Modern sequencing technology allows for precise quantitative statements to be made, with minimal effort, so here we provide such information regarding the levels of this enzyme.
The results shown here are in whole or part based upon data generated by the TCGA Research Network: http://cancergenome.nih.gov/. To be concrete, we have examined RNASeqv2 data from matched normal/tumour samples for several cancers: bladder, ovarian, prostate and breast. The raw RNASeq data were analysed by the TCGA consortium using MapSlice and RSEM algorithms [21, 22], and our conclusions are based on Level 3 data. To be concrete, count data for 20,531 genes, annotated by RSEM and Entrez Gene numbers, are obtained. For all cancers that we studied, quanlitatively and often quantitatively similar results were obtained.
To place the numbers discussed below in context, note that all samples examined had average gene expressions (counts) of between 900 and 1100. The maximum gene expression counts, typically for some collagens and housekeeping genes, was of the order of 105. The count levels for and were 1 to 3 orders of magnitude less than the 103 average expression level.
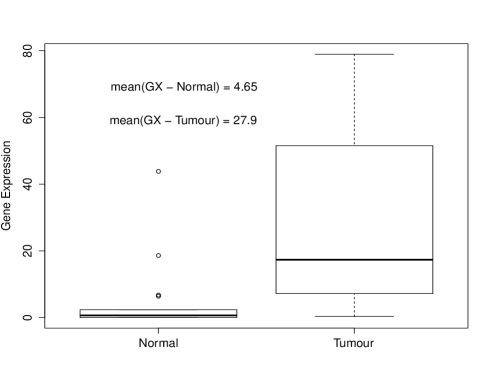
We found in all samples that the counts for the telomerase RNA component, , were close to the lower detection level, usually of order one, and rarely as high as 10. There is little difference in the gene expression counts between normal and tumour samples. However, the telomerase reverse transcriptase did show consistent changes between normal and tumour samples, with the tumours having a mean expression level between 3 and 6 times that of the associated normal samples. (A comprehensive examination of all of this data can be found in Ref. [23].) As one clear example, as of the time of the writing of this report there were 18 matched normal/tumour samples for bladder cancer at TCGA. In Fig. 1 a box-whisker plot of the expression data shows that one has a six-fold increase in the mean expression level for the tumours in comparison to the normal samples. Further, in 17 of the 18 samples the expression level is higher in the tumour than the normal samples, whereas in the 18th sample the expression levels are effectively equal. Consistent with the literature, in 7 out of the 18 normal samples the expression level of is effectively zero.
Below we proceed with the understanding that the presence of telomerase in samples is often associated with cancer, as supported by Fig. 1. Experimental identification of the activity rate of the elongation telomeres by telomerase is presently difficult to obtain, but could perhaps be provided by florescently tagging telomeres, and then following their lengths using cytometry as a function of the concentration of .
3 Methods - Mathematical Modelling
3.1 Biochemical Reactions:
For the models presented in this paper, the biochemical species of interest are cells and telomerase proteins. Within an approximation explained below, a cell is characterized by its generational age. This is the difference in the number of times a cell has undergone mitosis and replication compared with the number of times it has been acted upon by telomerase. A cell species will be denoted by . The generational age is denoted by the subscript . When a cell undergoes mitosis its generational age increases by one; that is . When a cell is acted upon by telomerase its generational age decreases by one; that is . A cell’s generational age can run from (a newly differentiated cell) to (a senescent cell). Cell species of different generational age will be represented by , and the respective population of cells of each generational age is denoted by . These cellular populations are a function of time and will be termed the subpopulation functions, , for .
A telomerase protein species is represented by . The telomerase population (number of proteins) is given by . Then we denote the concentration of telomerase as in units of number per volume, or concentration.
The section of the telomeres that is lost during replication, and the lengths of telomeres that are regenerated via telomerase, are not constant or equal. Previous mathematical modelling by Cyrenne and one of us of a longitudinal study of baboons [17] found lengths between 120 and 600 base pairs could be lost during mitosis. Similar variations in the elongation by telomerase are expected - that is, there is a stochastic component to this biology. Therefore, it is not per se the number of mitotic divisions less the number of elongations that sets the Hayflick limit, but rather a critical length of the telomeric region that induces replicative senescence. Here we simplify our work without sacrificing the key result (regarding a critical rate of telomerase activation giving rise to a divergent number of cells) by taking the lengths of the telomeres lost during replication and the number of the TTAGGG repeats added via the action of telomerase to be equal (in total length, in terms of base pairs), and the Hayflick limit to be determined by the net generational age of a cell. This approximation could change our result quantitatively, but not qualitatively, as we argue below.
A comment on terminology is appropriate before proceeding. Pristine cells are those with generational age of zero, or . Senescent cells are those which have reached the Hayflick limit, or . Permissive cells include all those that are not either pristine or senescent, or . We refer to them as permissive because these cells permit mitosis and replication to occur, and consequently permit the total number of cells in the population to increase, the crucial element needed to make sense of our results.
We now describe and model the relevant biochemical reactions that occur in a population of replicating cells. First, mitotic replication is taken to occur at a rate of replicative events per cell per unit time. This process results in one cell of generation , , producing two cells of generation , . This is shown in Eq. (1), and all subsequently described processes, first in terms of the chemical reaction, and then for the changes induced in (instantaneous) populations, .
| (1) | |||||
As is made clear above, only cells can undergo mitosis, and the inability of a cell whose chromosomes have reached the Hayflick limit to subsequently divide is often referred to as replicative senescence [5].
Acute death removes a cell from the derived population pool. This occurs at a rate of mortality events per cell per unit time. Therefore a cell of generation , , is removed from the system, as shown in Eq. (2).
| (2) | |||||
Note that in all reactions the null set denotes the lack of presence in the population pool of cells. Cells of any generation are susceptible to acute death, and therefore these expressions are valid for .
The population pool is “filled” via the differentiation of stem cells. The rate at which cells leave the stem cell population pool and enter the population pool is denoted by , and is in number of cells per unit time. Collectively this results in the production of new cells and an increase in as shown below.
| (3) | |||||
Through the previously discussed mechanisms, telomerase acts to “rejuvenate” a cell at a rate per cell per unit time. The specific details as to what we choose to take as will be discussed in more detail below. The net result is the onversion of a cell of generation , , to a cell of generation , (it is in this sense that telomerase rejuvenates a cell - it makes it younger). The effect of telomerase as we model it in this paper is contained in Eq. (4).
| (4) | |||||
Only cells can be acted upon by telomerase. A telomerase protein, , is essential to the reaction, but is not consumed in the process. (A model in which is the only non-zero rate is presented in the appendix.)
3.2 Chemical Master Equation:
We consider the system to be composed of these reactions with these average reaction rates. Also, for now we take the concentration of telomerase to be fixed, but return to the lifting of this simplification later in this paper. The probability of finding the system in a state having cells with these number of net mitotic divisions is denoted by . Following this notation, the chemical master equation for such a collection of cells and telomerase can be written as (here we suppress the time dependence of the probability function)
| (5) |
Note the differing summation limits.
3.3 Deterministic Equations for the Average Subpopulation Functions:
If all reaction rates are taken to be constant, then one may derive the equations of motion of the average subpopulation functions. We denote averages over an ensemble of populations of cells by . Then one finds the following equations of motion for these average subpopulation functions to be simple coupled linear ODES, namely
| (6) |
One may examine many aspects of the subpopulation functions, including the average length of the telomeres for the chromosomes in each cell, and we discuss some of these results below. However, the main focus of this paper is in the (average) total number of cells in the population, which we denote by and is defined by
| (7) |
Conditions under which this total population size becomes very large, which physically could correspond to a rapidly growing tumour and which mathematically we will associate with a diverging population size, is related to the progression of cancer[28, 29]. Below we identify conditions under which our simple model can lead to such divergences.
3.4 Limiting Behaviour – Previously Published Models:
One of the focuses of the results given below is concerned with the long-time limit of the total (average) population, . To place these new results properly in perspective, here we summarize this limiting behaviour using previously published work.
Itzkovitz et al [16] examined a model with no Haylflick limit () with the constraint that the total population is fixed at its value. For the initial condition corresponding to only cells being present at , namely , this situation is guaranteed if . One may generalize their model to allow for non-constant populations, and for the specific case of an empty initial state (), iteratively solving the associated ODEs one finds
| (8) |
Therefore, for the situation of interest below, namely , this sum diverges to . We will relate this limit to our work below.
If one modifies the model of Ref. [16] to include the Hayflick limit then one may follow the work of Cyrenne and one of the present authors in Ref. [17] to obtain
| (9) |
Clearly, this latter result makes clear that the steady state average total population will always remain finite. One may connect the formalisms of Refs. [16] and [17] by noting that in enforcing the existence of the Hayflick limit the population size will remain finite (as it does in [16]) but will approach its steady state value from some arbitrarily defined initial distribution.
3.5 Main result of study:
The noteworthy result of the present paper is simply that Eq. (9) will be modified such that due to activity of telomerase when the activity of this protein exceeds a critical value. The structure of the equations of motion for the average populations of each generational age does not make this obvious. That is, the action of telomerase is number conserving - the result of its action is simply to change what we are calling the generational age of a cell from to . If no new cells are created because of , why is the population size so drastically affected? We provide one explanation for this behaviour in the following section.
4 Results - Uncontrolled Cell Growth and
4.1 Dynamics of total population :
We now turn to the main result of our paper. We show that for a model that includes the Hayflick limit ( finite) if then a critical value of exists, which we denote as , such that .
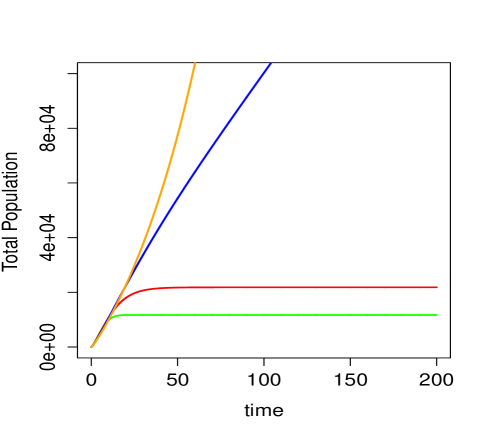
Example plots of this situation are shown in Fig. 2 for the initial state at being that no cells are present in the derived population pool. Note that irrespective of the choices of , when is finite and then always remains finite - see Eq. (9). However, as the curves in Fig. 2 make clear, only when exceeds some critical value (here between 0.5 and 1) does the (average) total number of cells diverge. We label this critical value of as .
The identification of is one of the key results of this paper. The average total population of all cell types can be shown to satisfy the following equation:
| (10) |
However, the solutions for the subpopulations such as via, e.g. Laplace transforms, are cumbersome. Therefore, in order to most easily identify the form of the analytic matrix solutions to these deterministic ODEs will be presented. The equations of motion of the average populations givens in Eq. (3.3) can be expressed in an equivalent form using matrices and vectors:
| (11) |
where
| (12) |
and the (square non-symmetric) coefficient matrix is denoted by , and can be written down for a given using Eq. (3.3). To allow for the application of a helpful theorem, it is informative to write down the matrix for a given , so for this matrix is shown below. (Note that the tridiagonal form of this matrix is preserved in rows 2 to .)
| (13) |
Equation (11) is solved using conventional methods for ordinary differential equations - one must solve both the homogeneous and inhomogeneous equations. The solution to the homogenous equation includes an expansion of eigenvectors and eigenvalues, and the eigenvalue solutions for the matrix will be denoted by
| (14) |
The complementary particular solution is a vector of constants, which we denote as , and is given by
| (15) |
Then, letting the be expansion coefficients determined by initial conditions, the solution to Eq. (11) can be written as
| (16) |
The divergent total number of cells seen in Fig. 2 is therefore seen to be associated with one of the eigenvalues of becoming positive. In particular, this mathematical formulation makes clear that this diverging is independent of the initial conditions for the (unless one is considering the highly unlikely initial condition such that the coefficient associated with the eigenvector with the positive eigenvalue is equal to zero). Further, the divergence is not dependent on the existence of a pool of repopulating stem cells, since does not depend on .
One may make progress analytically on the eigenvalue problem using the Gerschgorin Disk Theorem [24]. For the 44 matrix shown above, the real value of three of the eigenvalues is bounded above by (for the other eigenvalue the upper bound is zero). Therefore, we immediately have the result that only for can one obtain an eigenvalue with a positive real part. It is straightforward to generalize the application of this theorem to any .
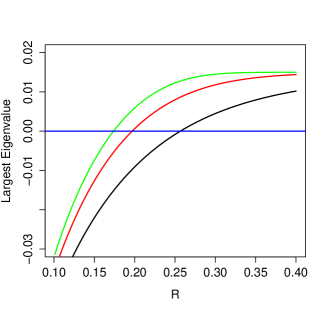
Example results for the eigenvalue which becomes positive, leading to the divergent total population, are shown in Fig. 3. The variation of the eigenvalue is shown as a function of for increasing values of . Here we take values based on a longitudinal study for baboon T cells [26] completed previously [27], namely . This plot makes clear that as increases towards its known value (), the critical value of at which the eigenvalue first becomes positive decreases. For for these values we find . Similar results are found when values for mature B cells are used, namely for we find . That is, when the mitotic replication rate and the cell death rate are similar, then is of the same order of magnitude, but larger than either or . We discuss these magnitudes below.
We have undertaken a numerical study (hopefully exhaustive ) examining the eigenvalues of for biologically relevant , and rate constants and (and ). First, confirming the above analytical result, the diverging population occurs only for . Second, if one augments the model to include so-called apoptotic death, denoted by , meaning the increased (net) death rate of senescent cells due to p53 triggered apoptosis, is increased, but only by a small amount for biologically relevant (for a variety of cell types, not simply leukocytes, for which most experimental data is available). For example, for , the parameters fit to the longitudinal baboon leukocyte data, increases from 0.173 for to 0.174 when is used. Third, although the differential equation for may be written in a form that does not include , such as Eq. (10), the subpopulation solutions (such as ) do depend on . Therefore, although itself conserves the number of cells (see the Appendix and Eq. (4)), its role is to transform cells that have become senescent, and therefore unable to replicate through mitosis, to subsequently become permissive thereby permitting a non-dividing senescent cell to again divide. This serves as the basis for the model that we present in the next subsection.
4.2 Concentration-Dependent Telomerase Activity:
Our bioinformatics summary of the gene expression levels of the transcript in matched normal/tumour samples, given earlier, suggests that it is a reasonable assumption to say that only when a tumour is present does one find appreciable levels of telomerase. For example, during the process of oncogenesis the gene which is translated to produce telomerase is upregulated [2, 25]. Therefore, our previous model, which took the activity level of telomerase as to be a constant was an assumption that we should investigate.
Instead, consider the following. Telomerase proteins, , are produced at a rate and degrade at a rate . Production of telomerase is accomplished through regular protein translation, and degradation of telomerase occurs through simple denaturing mechanisms.
| (17) | |||||
| (18) |
The results in §4.1 given above are those produced in our model when the concentration of telomerase is a constant.However, the rate of elongating chromosomes is dependent on , the concentration of telomerase. Here we propose the simplest modelling of this concentration dependence that seems likely.
The telomerase concentration function, , can be described by the following first-order ordinary differential equation
| (19) |
represents the rate of production of the enzyme in number of proteins per unit time, whereas represents the rate of degradation of the enzyme in number of proteins per unit time. We have taken the production and decay rates to be concentration independent (although generalizations of this approach produce no important modifications to our results). We introduce a value we have termed the activation time and denote it as , and take it to represent the time when telomerase production begins, such as some time corresponding to the appearance of a neoplasia. Defining and physically assuming gives
| (20) |
Clearly, after some time the concentration of telomerase is fixed to be
.
Now one must include the effect of this time dependence in the activity of telomerase. Therefore we now introduce a new form of the telomerase rate functional which implements an activator Hill function, Eq. (21) - this is the standard form for modelling enzymatic activity which increases non-linearly from a baseline.
| (21) |
Now consider the following scenario. A healthy post-puberty individual has a sufficiently small concentration of telomerase that we can approximate . Therefore, a system of cells (for some given tissue with a stem cell source of new cells) reaches steady values of . Then crisis occurs at , and quickly the rate increases and stabilizes at some new value. If , one finds uncontrolled growth for the affected tissue. That is, in comparison to the results shown at the beginning of this section no qualitative change occurs, only the onset of the uncontrolled growth is shifted in time to .
5 Conclusions and Discussion
Using the simplest model possible, we have incorporated the effect of telomerase being present in a cell’s nucleus, thereby allowing it to elongate the telomeres of the cell’s chromosomes. We have made many approximations in our treatment of this system, but none of them should influence our main result, namely that if the activity of telomerase exceeds some critical value then the total number of cells will be found to diverge as . In the parlance of the oft-quoted “Hallmarks of Cancer” [28, 29], these cells have obtained replicative immortality.
The critical value, , that we find is similar in magnitude to the average rate of cell division (mitosis) , which is often similar but larger than the average rate of cell death . The work of Ref. [15] found a similar result, namely that the lengths of telomeres are elongated by telomerase, but only for unphysical levels of telomerase. Our critical value seems to be physical in that the size of is an effective rate, one that incorporates many biological processes, and represents that all of hte breakpoints are traversed, which depend on many protein/enzyme levels, cell division occurs. If the population of cells with different telomere lengths is going to have an exponentially increasing number of total cells, bypassing the steady-state levels found in replicative senescence (for our parameter values dominates the total number of cells in steady state), then telomere-elongation events must at least cancel out the byproducts of cell division, so finding is indeed the expected result.
Our model, the equations of motion for the average number of cells of each net generational age, is deterministic. However, no qualitative changes occur when one uses a stochastic simulation of the chemical master equation presented in this work (we used the full Gillespie simulation algorithm [30, 31]). Details of such work, in combination with other biological processes important in the initiation of the cell cycle, will be presented elsewhere.
The biological implications of these mathematical results must be considered carefully. No cell lasts forever in a living organism, so is not a directly useful limit. Instead, suppose that a healthy population of cells finds that a few cells obtain a replicative advantage, such as when a neoplasia forms. If the enzyme telomerase is activated in that population, then the advantaged cell won’t necessarily be limited by the Hayflick limit, since the role of telomerase is, in part, to make senescent cells become permissive of mitosis. That is, the results from the present model should be considered in terms of an increasing number of selectively advantaged tumour cells without bound. If such cells grow to some large size (think of the grapefruit size tumour often found in women with ovarian cancer) the consequences of some of these cells undergoing an epithelial-mesenchymal transition thereby possibly leading to distant metastatic cells is the life-determining upper bound in time imposed by the cancer.
6 Acknowledgments
We thank an anonymous referee for alerting us to Ref. [24], to David Berman and Palak Patel regarding experiments to measure the activity of telomerase, and to Troy Day for helpful comments. This work was supported in part by Queen’s University.
Appendix A
To further investigate the dynamics of our model, a limiting case is considered. That is, we now examine the same deterministic equations which were presented in §4.1, but for the case in which is the only non-zero rate constant. That is, in terms of applicable biological processes only telomerase acts on cells in the derived population pool. That is, we consider the model defined by
| (22) |
(Note that for completeness this limit is examined. It does not correspond to a physical limit.) This is equivalent to setting and Eq. (3.3) reduces to
| (23) |
These deterministic equations can be solved analytically by reverse iteration once a value for has been specified. To proceed, a closed form expression for can be calculated. This expression can then be used to solve for . Repeating this process allows for all subpopulation functions to be obtained, ending with .
We begin with a constant initial condition - it partitions the number of total cells evenly among all the available generations at and is given by for all . When solving the resulting equations with this initial condition, each of these expressions is a geometric series, and this set of equations is that they hold true for any value of .
| (24) |
These equations are consistent with
| (25) |
for all times.
References
References
- [1] Blackburn EH, 1991. Structure and Function of Telomeres, Nature 35, 569.
- [2] Harley CB, Vaziri H, Counter CM and Allsopp RC, 1992. The telomere hypothesis of cellular aging. Exp Gerontol 27(4), 375.
- [3] Chial, HJ, 2015. Telomeres, Aging and Cancer. Nature Education 8(2), 1
- [4] Olovnikov AM, 1973. A theory of marginotomy: The incomplete copying of template margin in enzymic synthesis of polynucleotides and biological significance of the phenomenon. J Theor Biol 41, 181.
- [5] Hayflick L and Moorhead PS,1961. The serial cultivation of human diploid cell strains. Exp Cell Res 25, 585.
- [6] Shay JW and Wright WE, 2000. Hayflick, his limit, and natural ageing. Nature Reviews Molecular Cell Biology 1, 72.
- [7] Sidorov I, Kimura M, Yashin A and Aviv A, 2009. Leukocyte telomere dynamics and human hematopoietic stem cell kinetics during somatic growth. Experimental Hematology 37, 514.
- [8] Borghans JAM and de Boer RJ (2007). Quantification of T-cell dynamics: From telomeres to DNA labelling. Immunological Reviews 216, 35.
- [9] Cooperman J, Neely R, Teachey DT, Grupp S and Choi JK, 2004. Cell division rates of primary human precursor B cells in culture reflect in vivo rates. Stem Cells 22, 1111.
- [10] Summers C, Rankin SM, Condliffe AM, Singh N, Peters AM, and Chilvers ER, 2010. Neutrophil kinetics in health and disease. Trends in Immunology 31, 318.
- [11] Weng NP, Levine BL, June CH, and Hodes RJ, 1995. Human naive and memory T lymphocytes differ in telomeric length and replicative potential. Proc Natl Acad Sci USA 92, 11091.
- [12] Vaziri H, Schachter F, Uchida I, Wei L, Zhu X, Effros R, Cohen D, and Harley CB, 1993. Loss of telomeric DNA during aging of normal and trisomy 21 human lymphocytes. Am J Hum. Genet 52, 661.
- [13] Pilyugin SS, Mittler J, and Antia R, 1997. Modeling T-cell proliferation: An investigation of consequences of the Hayflick limit, J Theor Biol 186, 117.
- [14] Greider, CW, 1991. Telomerase is processive. Mol Cell Biol 11(9), 4572.
- [15] Hirt BV, Wattis JAD, and Preston SP, 2014. Modelling the regulation of telomere length: the effects of telomerase and G-quadruplex stabilising drugs. J Math Biol 68(6), 1521.
- [16] Itzkovitz S, Shlush LI, Gluck D, and Skorecki K, 2008. Population mixture model for nonlinear telomere dynamics. Phys. Rev. E 78, 060902.
- [17] Cyrenne BM and Gooding RJ, 2015. Examining a scaled dynamical system of telomere shortening. Physica A 419, 268.
- [18] Antal T, Blagoev KB, Trugman SA and Redner S, 2007. Aging and immortality in a cell proliferation model. J. Theor. Biol. 248, 411.
- [19] Hiyama E and Hiyama K, 2003. Telomerase as (a) tumor marker. Cancer Letters 194, 221.
- [20] Vaziri H and Benchimol S., 1998. Reconstitution of telomerase activity in normal human cells leads to elongation of telomeres and extended replicative life span. Curr Biol 8(5), 279.
- [21] Wang K, Singh D, Zeng Z, Coleman SJ, Huang Y, Savich GL, He X, Mieczkowski P, Grimm SA, Perou CM, MacLeod JN, Chiang DY, Prins JF, Liu J, 2010. MapSplice: accurate mapping of RNA-seq reads for splice junction discovery. Nucleic Acids Res. 38(18), e178.
- [22] Li B, Ruotti V, Stewart RM, Thomson JA, and Dewey CN, 2010. RNA-Seq gene expression estimation with read mapping uncertainty. Bioinformatics 26(4), 493.
- [23] Gooding RJ (in preparation).
- [24] Gerschgorin S,1931. Über die Abgrenzung der Eigenwerte einer Matrix, Izv. Akad. Nauk. USSR Otd. Fiz.-Mat. Nauk 6, 749.
- [25] Shay JW and Bacchetti S, 1997. A survey of telomerase activity in human cancer. Eur J Cancer 33(5):, 787.
- [26] Baerlocher GM, Rice K, Vulto I, and Landsdorp PM, 2007. Longitudinal data on telomere length in leukocytes from newborn baboons support a marked drop in stem cell turnover around 1 year of age. Aging Cell 6, 121.
- [27] Cyrenne BM, 2014. Incorporating the Hayflick Limit into a model of Telomere Dynamics. (unpublished BSc thesis).
- [28] Hanahan D and Weinberg RA, 2001. The hallmarks of cancer. Cell. 2000 100(1), 57.
- [29] Hanahan D and Weinberg RA, 2011. Hallmarks of cancer: the next generation. Cell 144(5), 646.
- [30] Gillespie, DT, 1976. A General Method for Numerically Simulating the Stochastic Time Evolution of Coupled Chemical Reactions. Journal of Computational Physics 22(4), 403.
- [31] Gillespie, DT, 1977. Exact Stochastic Simulation of Coupled Chemical Reactions. The Journal of Physical Chemistry 81(25), 2340.