Ocular Shock Front in the Colliding Galaxy IC 2163
Abstract
ALMA observations in the 12CO line of the interacting galaxy pair IC 2163 and NGC 2207 at resolution reveal how the encounter drives gas to pile up in narrow, kpc wide, “eyelids” in IC 2163. IC 2163 and NGC 2207 are involved in a grazing encounter, which has led to the development in IC 2163 of an eye-shaped (ocular) structure at mid-radius and two tidal arms. The CO data show that there are large velocity gradients across the width of each eyelid, with a mixture of radial and azimuthal streaming of gas at the outer edge of the eyelid relative to its inner edge. The sense of the radial streaming in the eyelids is consistent with the idea that gas from the outer part of IC 2163 flows inward until its radial streaming slows down abruptly and the gas piles up in the eyelids. The radial compression at the eyelids causes an increase in the gas column density by direct radial impact and also leads to a high rate of shear. A linear regression of the molecular column density on the magnitude of across the width of the eyelid at fixed values of azimuth finds a strong correlation between and . Substantial portions of the eyelids have high velocity dispersion in CO, indicative of elevated turbulence there.
Subject headings:
galaxies: individual (IC 2163/NGC 2207), galaxies: ISM, galaxies: interactions1. Introduction
The pair of galaxies IC 2163 (catalog ) and NGC 2207 (catalog ) are involved in a grazing encounter. IC 2163 exhibits an eye-shaped (ocular) structure midway out in the disk and two tidal arms. In the generic N-body simulations of galaxy encounters by Elmegreen et al. (1991), Sundin (1989), and Donner et al. (1991), a disk galaxy that undergoes a close, prograde approximately in-plane collision with a galaxy of similar mass develops two long tidal arms and, for a relatively short time, an ocular structure. Although galaxy collisions of this type are not uncommon, only a few galaxies with ocular structure are known (Elmegreen et al., 1995a; Kaufman et al., 1997, 1999) because the ocular stage is of short duration (the duration of a specific ocular disturbance is of the order of the ocular radius divided by the streaming motions at the ocular). Making detailed observations of a galaxy pair at this phase is critical for testing numerical simulations of prograde encounters and the assumed physics.
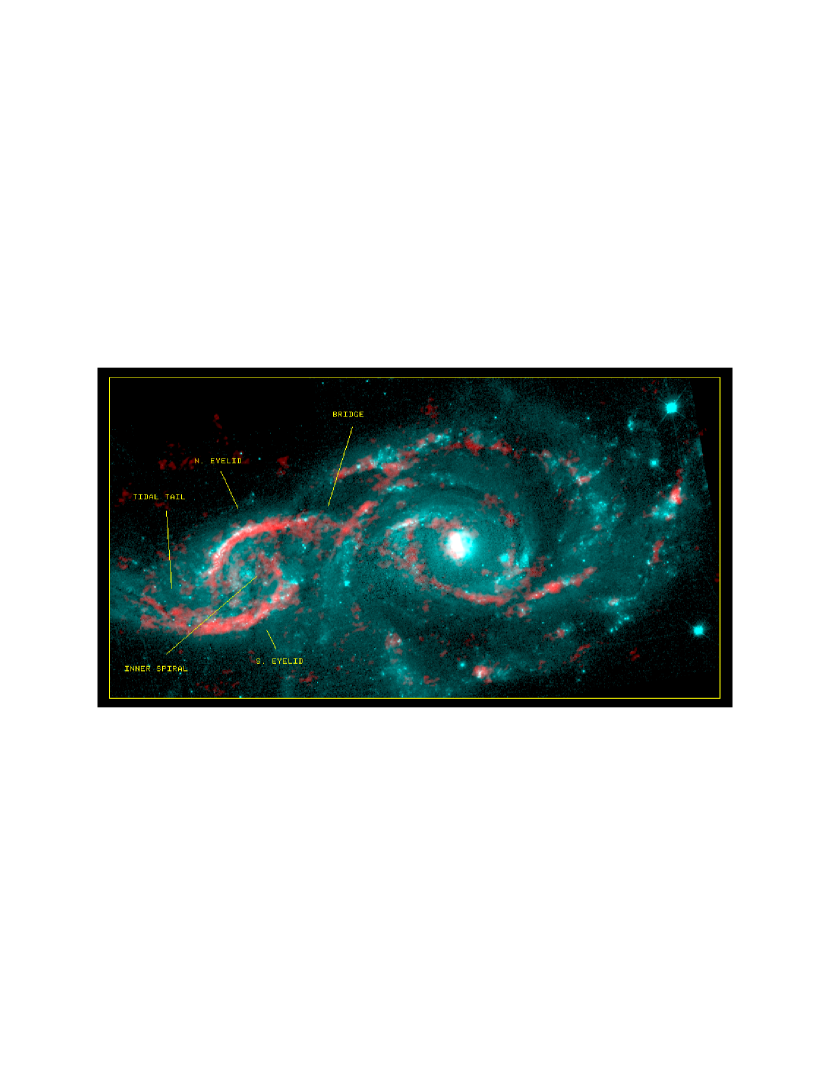
IC 2163 is a prime example of an ocular galaxy. The narrow ridges along the ocular, which we call the “northern and southern eyelids” (labelled in the top panel of Figure 1), have a plane-of-sky width of as seen in Hubble Space Telescope WFPC2 bands and ground-based H (Elmegreen et al., 2000, 2001), in Spitzer IRAC (3.6 – 8µm) images (Elmegreen et al., 2006), and in Karl G. Jansky Very Large Array (VLA)111The National Radio Astronomy Observatory is a facility of the National Science Foundation operated under cooperative agreement by Associated Universities, Inc. cm radio continuum observations and XMM-Newton images (Kaufman et al., 2012). Some lower resolution observations that also reveal the concentration of material in the eyelids are the VLA H I and cm radio continuum (Elmegreen et al., 1995a), the Spitzer MIPS 1 (24 µm) (Elmegreen et al., 2006), and the Herschel Space Observatory PACS (Photodetector Camera and Spectrometer) 70 µm maps (Mineo et al., 2014).
We have previously modelled NGC 2207/IC 2163, reproducing many of the observed features with N-body (Elmegreen et al., 1995b) and SPH encounter simulations (Elmegreen et al., 2000; Struck et al., 2005). In the encounter simulations, IC 2163 suffers a prograde, nearly in-plane encounter as it passes, mainly southward, behind NGC 2207 (relative to us), and its ocular structure forms from outer disk material that loses angular momentum in the tidal perturbation, flows inward until it hits an angular momentum barrier, piles up in the eyelids, and produces a shock zone there. Although in the SPH model by Struck et al. (2005), the outer disk of IC 2163 initially side-swipes the outer disk of NGC 2207, the ocular shock zone is not the result of direct contact between the two galaxies but develops later from the prolonged prograde encounter.
Elmegreen et al. (2001, 2006) observe bright knots of star formation along the eyelids. Kaufman et al. (2012) find that the flux density ratio of 8 µm to cm radio continuum emission for the star-forming regions on the eyelids is a factor of 2 greater than elsewhere in these galaxies (or in the M81 H II regions, which they take as a reference standard). In that paper, we offer three possible explanations: shock-heated H2 in the eyelids, shock fragmentation of large grains down to polycyclic aromatic hydrocarbon (PAH) sizes to increase the number of small grains, or the accumulation of B stars in the eyelids from the previous 30 Myr of star formation.
We observed IC 2163/NGC 2207 in 12CO at a resolution of with the Atacama Large Millimeter Array (ALMA). The goal of the present paper is to use the ALMA data to look for the predicted gas flows into the eyelids that drive the pileup of gas there and to relate the observed streaming motions to the molecular gas densities in the ocular shock zone. This is a major test of the numerical simulations, and our results provide constraints on future models. In the H I observations by Elmegreen et al. (1995a) there are indications of streaming motions around the oval. However the resolution of the H I data is too low compared to the width of the eyelid to get detailed information. In contrast, the spatial resolution afforded by the ALMA CO observations allows us to distinguish between the outer and the inner edges of each eyelid and thus measure the radial and tangential streaming of the gas at the outer edge of an eyelid relative to that at its inner edge.
From the NASA/IPAC Extragalactic Database (NED), we adopt a distance of Mpc for IC 2163/NGC 2207 with a Hubble constant = 73 km s-1 Mpc-1 and corrected for infall towards Virgo. Then = 170 pc, and the width of the eyelids corresponds to 1 kpc.
The velocities listed in this paper are heliocentric and, unless stated otherwise, use the radio definition of the nonrelativistic Doppler shift.
Section 2 describes our ALMA observations. Section 3 measures the velocity differences and across the width of each eyelid and compares the H I and CO velocity fields at the ocular. Section 4 presents the correlation between and the molecular column densities in the eyelids. Section 5 considers evidence for turbulence in the eyelids, and Section 6 summarizes our conclusions.
2. Observations and data reduction
On 2014 April 3, IC 2163 and NGC 2207 were observed in 12CO emission in a mosaic of 34 pointings with the ALMA 12-m array of 32 antennae (two of which were subsequently completely flagged throughout the run due to outlying values of ). The observations are from Configuration C32-4 of Cycle 1. The on-source time was 38 minutes and the pointings were apart. The phase center was R.A., decl. (2000) = 06 16 22.809, -21 22 30.71. Ganymede served as the flux calibrator with the Butler-JPL-Horizons 2012 frequency-dependent flux model, J0609-1542 served as the bandpass calibrator, and J0609-1542 served as the phase calibrator. Hanning smoothing was applied.
The uv-coverage ranged from 8.0 to 169 k. The maximum recoverable scale with this ALMA configuration is = 2.6 kpc, which is appreciably broader than the IC 2163 eyelids or the spiral arms of NGC 2207. The only single-dish 12CO observations of this galaxy pair are a shallow mapping using several pointings with the Swedish ESO Submillimeter Telescope (SEST) (HPBW = ) by Thomasson (2004), who does not list the total integrated CO flux. Due to lack of access to any suitable observations, our interferometric data could not be combined with single-dish observations. As described in Struck et al. (2005), the SEST observations find CO emission from both disks, with brighter emission from IC 2163, and the CO emission does not seem to be concentrated on the massive H I clouds identified by Elmegreen et al. (1995a). The SEST spectrum of IC 2163 is double peaked, hinting that some of the emission is from the eyelids. The missing short-spacing data in our ALMA maps could lead to underestimates of the total CO flux of each galaxy. However, because diffuse CO emission will be more spread out than our 2.6 kpc maximum recoverable scale, it should make only a minimal contribution to the molecular column densities of the clumped emission we are studying and is unlikely to affect the velocities at the eyelids which are the main focus of this paper.
The CASA 4.2.1 software package was used for the data reduction. Calibration and flagging were carried out by the ALMA Data Reduction Team. We subsequently checked the data and flagged one high amplitude spike in the target observations. Using the CASA clean routine, a cleaned data cube of line emission from the galaxy pair was made with natural weighting, a central frequency of 114.1973 GHz and a total bandwidth of 0.3845 GHz.
For the data analysis we used the AIPS software package. To select areas of genuine CO emission, we convolved the above cube to resolution, clipped it at 2.5 times its rms noise, and retained regions of emission only if they appear in at least two adjacent channels. The result was applied as a blanking mask to the original cube, and after correcting for primary-beam attentuation, we took a pixel channel subcube which contains all of the line-emission in the masked, primary-beam corrected cube.
Table 1 lists the properties of this subcube, which was used for calculating the moment maps. We also blanked the image of the intensity-weighted velocity field and the velocity dispersion image where the CO surface brightness Jy beam-1 m s-1 in the CO surface density map. A surface brightness of 200 Jy beam-1 m s-1 is equivalent to the rms noise over two channel widths.
| Parameter | Value |
|---|---|
| Configuration | C32-4 |
| Channel width | 10 km s-1 |
| Pixel size | |
| Cube Size | pixels, 64 channels |
| Weighting | Natural |
| PSF (HPBW, PA) | , |
| rms noise per channel | 3.7 mJy beam-1 |
| (CO) | 30.7 K/Jy beam-1 |
| Velocity range of line-flux | km s-1 |
| Total integrated (CO) | Jy km s-1 |
| Peak Dynamic rangebbPeak brightness in the channel maps is on the northern eyelid. | 24 |
Except as noted in Section 3.1 below, the correction for primary beam attenuation is a factor of for almost all of the CO emission from the galaxy pair in the ALMA map.
To convert the values of CO surface brightness to molecular column density, we take = (H2 cm-2)/(K km s-1) from Dame et al. (2001).
The observations also yielded a continuum image centered on 102.3 GHz. The brightest continuum source is well below the rms noise in the spectral-line cube.
We compare our CO images of IC 2163 with the VLA H I observations by Elmegreen et al. (1995a). The latter have a point spread function (PSF) with FWHM equal to , PA = . We use an H I surface density image made from a masked cube with a channel width of 21 km s-1 and rms noise per channel = 0.73 mJy beam-1 and an H I velocity field image made from a masked cube with a channel width of 5.25 km s-1 and rms noise = 1.3 mJy beam-1.
3. Velocities at the Eyelids
3.1. CO Velocity Differences across the Eyelid Width
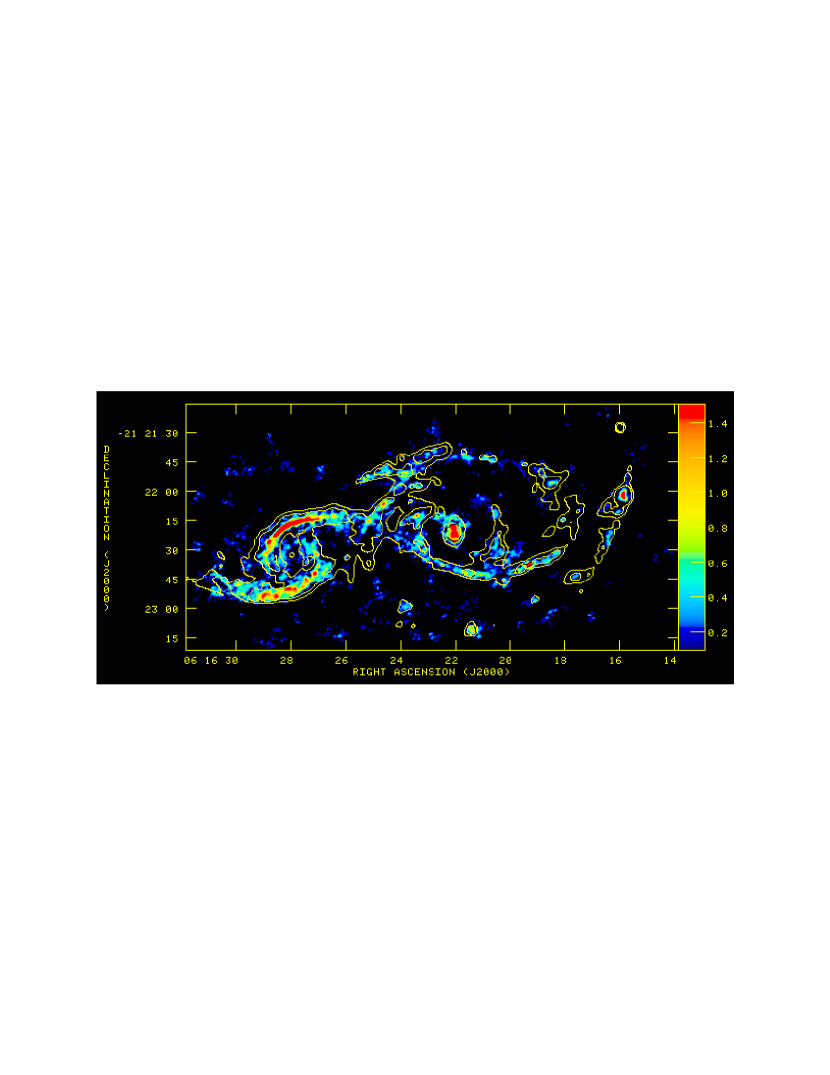
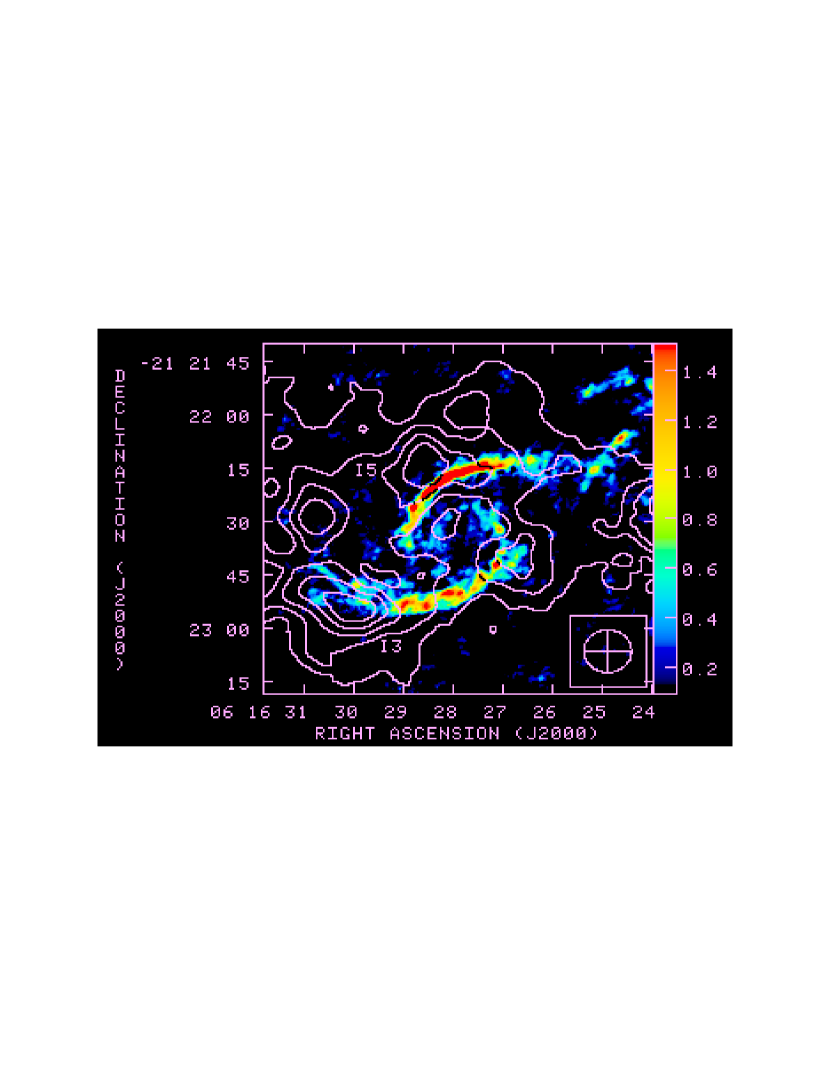
The top panel in Figure 1 displays a composite color image of IC 2163/NGC 2207 with the HST B image from Elmegreen et al. (2000) in cyan and the surface brightness image from our ALMA CO data in red. Features of interest in IC 2163 are marked in this figure. In the bottom panel of Figure 1 the color-coded (CO) image is overlaid with contours of Spitzer 8 µm emission at 4 and 8 MJy sr-1. This figure shows that along the eyelids in IC 2163 and along the spiral arms of NGC 2207, the CO emission occupies the same narrow ridge as the 8 µm emission. For clarity, higher level and lower level contours of 8 µm surface brightness are omitted. The molecular gas in IC 2163 is strongly concentrated in the northern and southern eyelids, with fainter CO emission from the inner spiral arms, the portion of the tidal tail included in this field, and part of the tidal bridge extension of the northen eyelid, until it blends, in projection, with a spiral arm of NGC 2207. The eyelids are generally much brighter in CO than the spiral arms of NGC 2207; the highest molecular column density in the galaxy pair (including the nucleus of NGC 2207) is on the northern eyelid.
In the outer northeastern part of the field in Figure 1 (R.A. east of 06 16 28 with decl. north of -21 21 50), no H I emission is detected [see Section 3.2 below and Elmegreen et al. (2016)], so the CO emission there is probably not real. At this outlying location and at an analogous outlying location in the southwestern part of the field in Figure 1, the correction for CO primary beam exceeds a factor of 1.3.
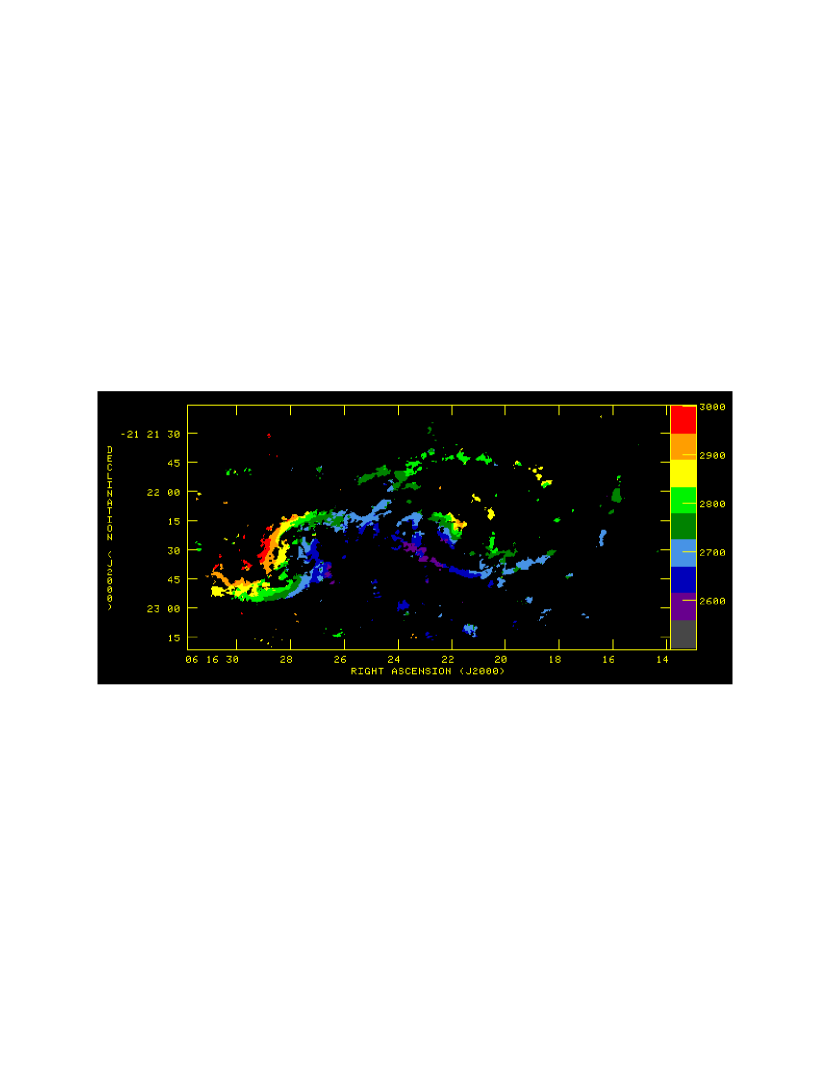
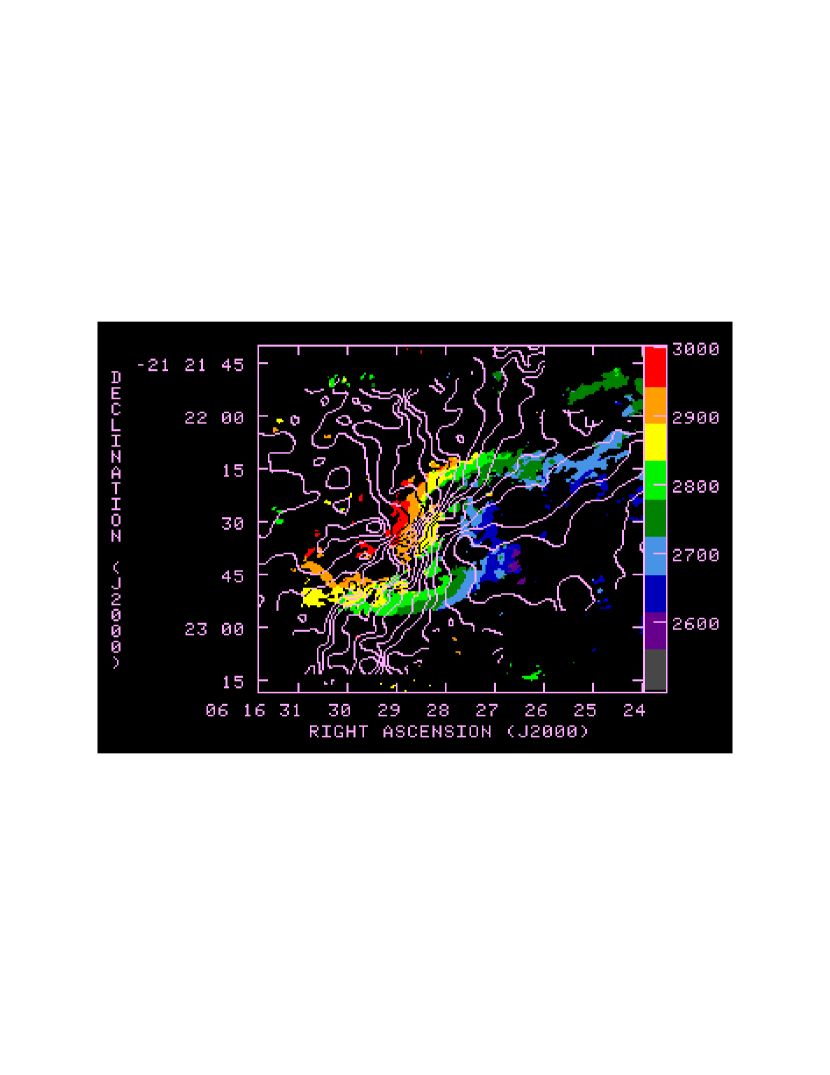
Figure 2 displays the CO velocity field of IC 2163/NGC 2207. We note that the CO isovelocity contours on the eyelids make a shallow angle with respect to the outer edge of each eyelid. The velocity field image reveals that over a wide range of azimuth, there is a large velocity gradient across the kpc width of the eyelid at any given azimuth. We define the line-of-sight velocity difference between the outer and the inner edge of the eyelid as
| (1) |
The values of for the eyelids are much greater than the velocity differences across the width of the spiral arms in NGC 2207. At some locations along the eyelids, cuts across the eyelid width perpendicular to the eyelid ridge-line yield values of in excess of 100 km s-1.
For measurement and analysis of the velocities at the eyelids, we transformed the images of IC 2163 to face-on polar coordinates. We adopted values of the projection parameters of IC 2163 from Elmegreen et al. (1995a, b), i.e., we take the intersection of the plane of the disk with the plane of sky on the receding side as the H I kinematic major axis at position angle PA = and the disk inclination as (where = 0 for face-on). The ocular is intrinsically more oval than it appears in the sky-plane (Elmegreen et al., 1995b). For the transformation to polar coordinates, we take the center as the nucleus, which is at the center of the oval. The receding, approaching, near, and far sides of IC 2163 are identified in the sky-plane image of the CO surface brightness in Figure 3. The long lines in this figure are labelled with the value of the azimuthal angle in face-on polar coordinates, i.e., the kinematic major axis at = and and the kinematic minor axis at = and . The azimuth is measured counterclockwise from the receding kinematic major axis at PA = .
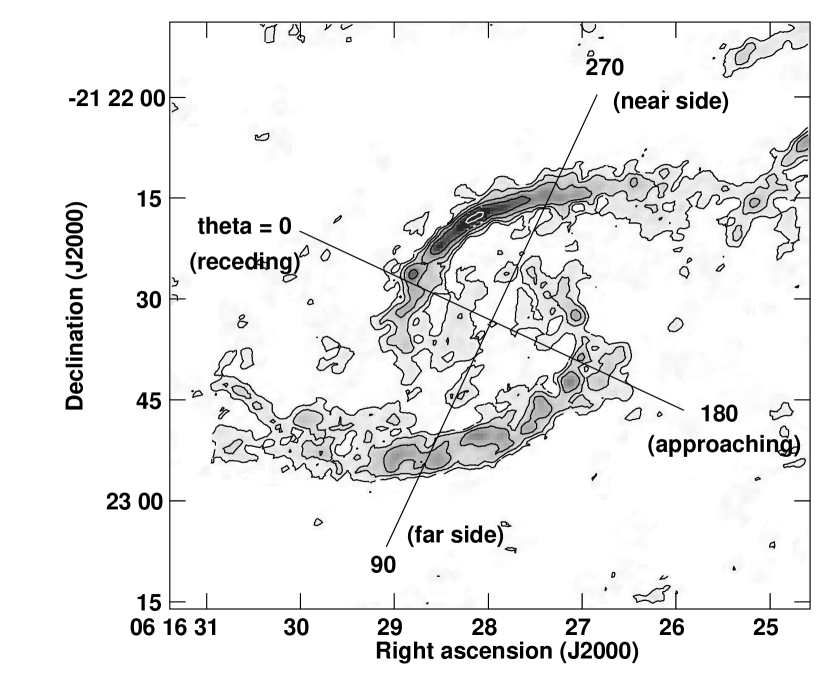
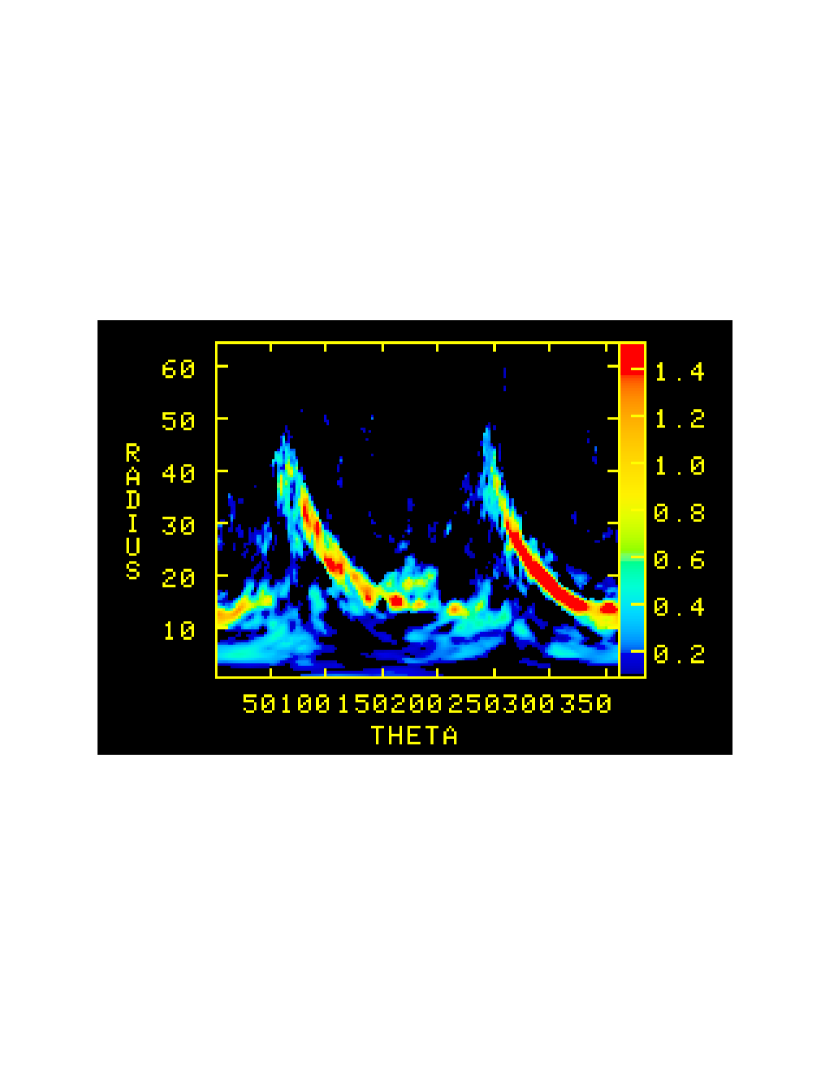
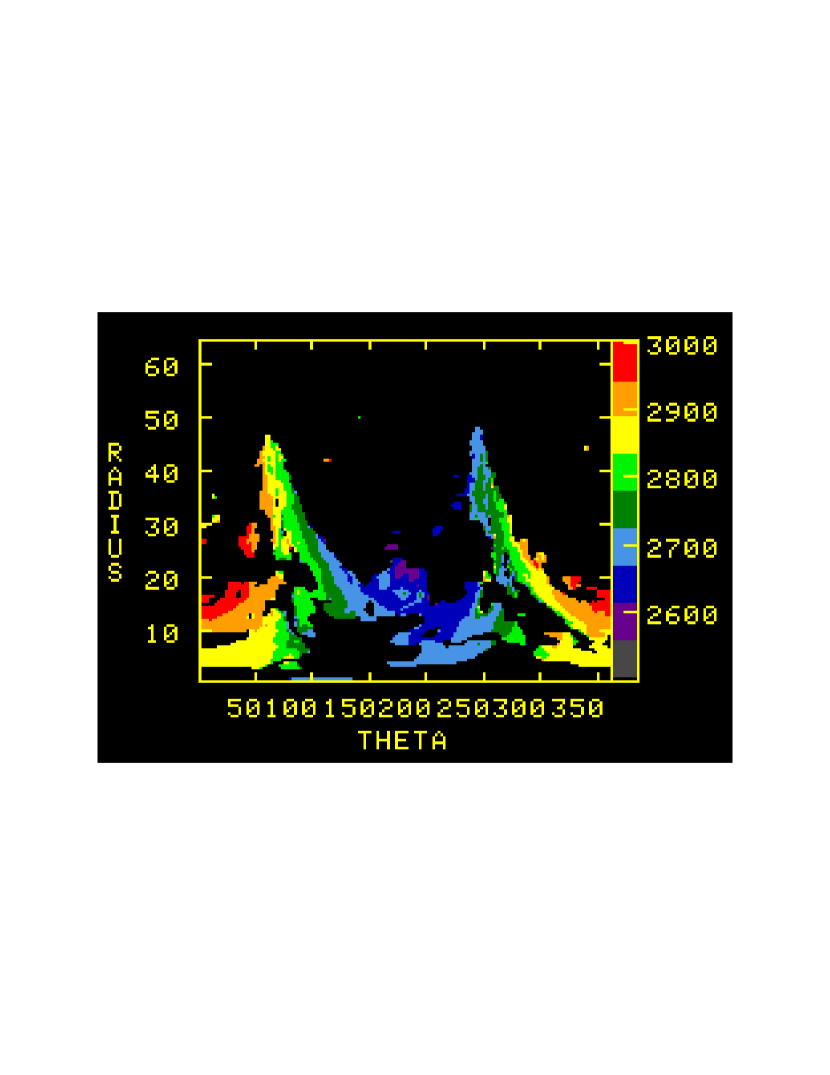
Figure 4 displays the CO surface brightness image and the CO velocity field in face-on polar coordinates. The H I kinematic minor axis on the side nearest us is at (as indicated in Figure 3). Then the observed line-of-sight velocity
| (2) |
where is the face-on galactocentric radius, is positive for expansion, and is the sum of the circular velocity and tangential streaming . Because the tidal peturbation to IC 2163 is nearly in-plane, we assume that across the eyelid width, for the molecular gas is negligible compared to or . In Figure 4, the southern eyelid starts at , and the northern eyelid starts at .
For the eyelid measurements of each parameter, i.e., the line-of-sight (LOS) velocity, the face-on radius , the difference in face-on radius = between the outer and inner edges of the eyelid, and the LOS column density , we defined the edge of the eyelid as the closest pixel position to where (CO) = 200 Jy beam-1 m s-1 except for the following two transition regions at the ends of the eyelids. Specifically, to distinguish between CO emission from the southern eyelid and that from the inner spiral at and to distinguish between CO emission from the northern eyelid and that from the transition to the tidal tail at , we used the location of IRAC 4 clumps as a guide. The transformation from plane-of-sky to face-on polar coordinates resulted in a pixel size of for the azimuthal angle . We measured the values of at one pixel () intervals of in the polar coordinate image, with the line-of-sight velocity measured at the same value of at both edges. We then averaged our measurements over four pixels () in as that gives an arclength approximately equal to the FWHM of the PSF at the smallest value of on the inner edge of an eyelid.
Table 2 lists the values of the LOS velocity difference and the difference in face-on radius between the outer and inner edges of the eyelid. The values of in this table are averages for the area between the inner and outer edges of the eyelid. For and , we used the same values of and averaged over the same in azimuth as for . Given the channel width, the minimum uncertainty in is 7 km s-1. The uncertainties listed for in Table 2 are either 7 km s-1 or the standard error of the mean in averaging over in , whichever is greater. The rms noise in the CO channel maps times the channel width is 37 Jy beam-1 m s-1, equivalent to = 3.3 pc-2. The uncertainties listed for in Table 2 are either 3.3 pc-2 or the standard error of the mean in averaging over in , whichever is larger.
The observed large values of over a wide range of azimuth (see Table 2) argue for a mixture of radial and azimuthal streaming of gas at the outer edge of the eyelid with respect to gas at the inner edge of the eyelid. With the adopted orientation of IC 2163, outer disk gas that streams radially inward, slows down radially in the ocular ridge and speeds up azimuthally there, would produce positive on much of the northern eyelid, i.e., from , and negative on much of the southern eyelid, i.e., from . This is in the same sense as the observed values. Thus the observed CO velocity field is consistent with the idea that gas from the outer part of IC 2163 flows inward until its radial streaming slows down abruptly to produce the thin pileup zone in the eyelids.
| () | (km s-1) | ( pc-2) | (arcsec) | (km s-1 kpc-1) |
|---|---|---|---|---|
| (1) | (2) | (3) | (4) | (5) |
| Northern Eyelid | ||||
| 263.6 | 10.4 | |||
| 272.9 | 8.1 | |||
| 282.2 | 7.2 | |||
| 291.5 | 6.5 | |||
| 300.8 | 7.3 | |||
| 310.1 | 4.5 | |||
| 319.4 | 4.2 | |||
| 328.7 | 4.3 | |||
| 338.0 | 4.5 | |||
| 347.2 | 5.6 | |||
| 356.5 | 7.4 | |||
| 5.8 | 5.8 | |||
| 15.1 | 4.0 | |||
| 24.4 | 4.6 | |||
| 33.7 | 3.8 | |||
| Southern Eyelid | ||||
| 75.5 | 10.0 | |||
| 84.8 | 8.8 | |||
| 94.1 | 6.5 | |||
| 103.4 | 6.7 | |||
| 112.7 | 6.5 | |||
| 122.0 | 6.9 | |||
| 131.2 | 6.5 | |||
| 140.5 | 5.1 | |||
| 151.1 | ||||
| 161.4 | 3.0 | |||
| 170.7 | 3.5 |
In Table 2 the positive values of for , as the gas in the northern eyelid approaches the H I tidal tail, probably mean that the term in Equation 2 dominates in this range. The values of are smaller at the extreme eastern and extreme western ends of each eyelid than elsewhere on the eyelid; according to the encounter simulations, the material there originated in regions that experienced weaker tidal torque.
On the northern eyelid at , results from radial streaming only and has an LOS value of km s-1, equivalent to = km s-1 in the plane of the disk. At on the northern eyelid, results from azimuthal motions only, and the value of is km s-1. Thus there is considerable shear associated with tangential streaming since it is unlikely that the circular velocity changes by an amount this large across the 1 kpc width of the eyelid. The tangential streaming at has an appreciably smaller magnitude than the radial streaming at , but the values of and probably vary with . On the southern eyelid at , results from radial streaming only, and the value of = km s-1.
Column (5) of Table 2 lists the difference approximation to the directional derivative in the disk-plane of the velocity with respect to across the width of the eyelids for fixed:
| (3) |
where is the LOS velocity difference from the Column (2) and is the difference in face-on radius in kpc. Note that this includes radial and tangential streaming. Except at the extreme eastern and extreme western ends of the southern eyelid and at the extreme western end of the northern eyelid, the values of are all quite large, with values in excess of 150 km s-1 kpc-1 on a significant part of the northern eyelid and km s-1 kpc-1 on the southern eyelid. The velocity gradient is greater than or equal to the directional derivative, and thus the velocity gradients across the eyelids are large. Such large values are qualitatively consistent with the encounter simulation predictions that the eyelid compression region is a shock zone.
For the rest of this paper, we shall assume that the tangential streaming component dominates at the eyelids.
If we take the duration of a specific ocular disturbance to be of the order of the ocular radius divided by the streaming motions at the ocular, then the present ocular structure in IC 2163 should last for a timescale of the order of several yr.
3.2. Comparison between CO and H I Velocity Fields
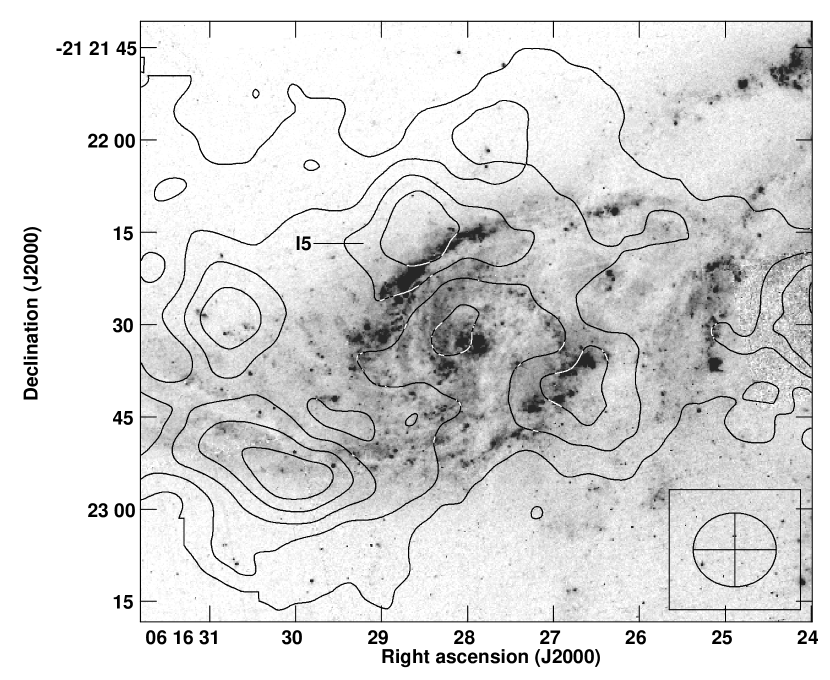
Elmegreen et al. (1995a) separate the H I associated with IC 2163 from that associated with NGC 2207. For IC 2163, the top panel of Figure 5 displays H I isovelocity contours overlaid on the CO velocity field, the bottom panel of Figure 5 has H I column densiy contours overlaid on (CO), and Figure 6 has the same (H I) contours overlaid on the HST B-band image. The lowest (H I) contour level in these figures is 5 pc-2, which is equivalent to the rms noise over two channel widths. The beam symbol represents the H I resolution; the H I point spread function (PSF) has FWHM equal to , PA = . Thus the H I images provide a considerably less detailed view than our CO data with a resolution of .
In the CO velocity field, the kinematic major axis is at position angle PA = : on the outer edge of the eyelids, the highest velocity molecular gas is at PA = on the northern eyelid and diametrically opposite the lowest velocity molecular gas on the southern eyelid. This is consistent with the value PA = that Elmegreen et al. (1995a) obtain for the kinematic major axis in H I.
Because of tidal effects, the velocity fields in H I and CO are not regular, and in H I the dynamic center appears to be northeast of the nucleus. The largest amplitude wiggles in the H I isovelocity contours tend to be displaced toward the outer side of the CO eyelids. Not all of the wiggles in H I velocity contours just north of the northern eyelid have the same sense of curvature; in the vicinity of the massive H I cloud I5 (Elmegreen et al., 1995a), labelled in the bottom panel of Figure 5, the curvature of the wiggles in the H I velocity contours reverses sense. This indicates complex flows in the H I gas related to this massive H I cloud. There are also pronounced wiggles in the H I velocity contours near the massive H I cloud I3, which is centered at the start of the tidal tail.
At the CO eyelids, the CO and H I isovelocity contours have a similar tilt at some locations but not at other locations, particularly on the southern eyelid. Some differences between the tilt of the CO and H I isovelocity contours at the eyelids may result from differences in spatial resolution and differences in where the column densities of molecular and atomic gas have local maxima.
The H I velocity dispersion at the massive H I clouds I5 and I3 is km s-1 after correction for the velocity gradient across the kpc synthesized beam (Elmegreen et al., 1995a). Elmegreen et al. (2000) suggest that these high values for the H I velocity dispersion could result from (a) high turbulence in the H I gas and lead to unusually large H I scale heights or from (b) several streams with different velocities within the H I synthesized beam. If the H I disk is thicker than normal, the H I velocities at higher altitudes may differ from those in the disk. For comparison, Section 5 below presents our measured values of the CO velocity dispersion in various parts of the galaxy pair.
The massive H I cloud I5, whose center lies outside of the CO eyelid and outside of the B-band ridge, is located northeast of the region of greatest on the northern eyelid. Based on H and 24 µm emission, Elmegreen et al. (2016) find a very low star formation rate in their aperture A10, which covers most of I5. Thus the H I here is not a product of photodissociation. I5 may be along (or part of) the stream producing the greatest concentration of molecular gas on the eyelids, and some of its H I may get converted into molecular gas in the eyelid compression zone.
3.3. Differences between North and South Eyelids
We compare the CO velocity field values of and on the northern eyelid with those on the southern eyelid.
For on the northern eyelid, the streaming motions in the disk range in magnitude from 159 km s-1 to 278 km s-1, and the values of are km s-1 kpc-1. Since this range of lies within of the H I kinematic minor axis, these velocities represent mainly radially inward motion of molecular gas at the outer edge of the northern eyelid relative to its inner edge. On the southern eyelid for , there is little variation of or of with azimuth; the values of here are negative and have a mean magnitude km s-1, and has a mean magnitude of km s-1 kpc-1. Since this range of is within of the kinematic minor axis, the observed negative values of on the southern eyelid here represent mainly radially inward motion of molecular gas at the outer edge of the southern eyelid relative to its inner edge. Thus in the CO velocity field the magnitude of the radial streaming motions and the values of near the H I kinematic minor axis are considerably higher on the northern eyelid and vary much more with azimuth than on the southern eyelid.
Our measurements find a relative velocity difference between the outer and inner edges of each eyelid in the direction that produces a compression zone at the eyelids. Although the sense of this velocity difference is consistent with having gas from the outer part of the galaxy flow inwards until it reaches the eyelids, an alternative interpretation would have the inner edge of the eyelids moving outwards with respect to the outer edge. To see if the inner edge of the eyelids is moving radially relative to the center of the disk, we compare the CO value of (the velocity at the inner edge of the eyelid) on the kinematic minor axis with . The values of (heliocentric, optical definition) listed by Elmegreen et al. (1995a) are km s-1 from the kinematic minor axis of their H I velocity field and km s-1 from optical observations at the nucleus. The CO emission at the IC 2163 nucleus is faint and thus not useful for measuring .
After our CO velocities are converted to heliocentric, optical definition, the northern eyelid has = km s-1 at , consistent with the H I and optical values of . However the southern eyelid has = km s-1 at , which is appreciably higher than . The difference between the values of on the northern and southern eyelids at the kinematic minor axis can be seen in the color displays of the CO velocity field in Figure 2 and Figure 5 where the northern eyelid is dark green and the southern eyelid is light green at these positions. Relative to the center of the disk, the inner edge of the northern eyelid does not seem to be moving radially but the inner edge of the southern eyelid is moving radially outwards. After the gas streamed radially inward to form the eyelids, the inner edge of the southern eyelid may have started to move outward in a second ocular wave. Under certain conditions in the models by Struck et al. (2005), a second ocular wave can form and propagate outward.
As noted in Section 3.2 above, the H I velocity field reveals a small apparent shift of the dynamic center of IC 2163 to the northeast of the center of the galaxy.
These various asymmetries may be evidence of a dynamic situation in which the evolution of the ocular is not symmetric about the center of the galaxy because of differences in the near-field tidal forces on the two eyelids as discussed in Section 3.4 below.
3.4. A Possible Qualitative Explanation for the Velocity Asymmetries
Section 3.3 points out certain velocity asymmetries in the ocular. Relative to us, the near side of IC 2163 is at PA = . According to the model by Elmegreen et al. (1995b), this is also the side of IC 2163 that was closest to NGC 2207 as IC 2163 traveled behind NGC 2207 from the north and west to its present position partially behind the outer eastern side of NGC 2207. This means that most of the northern eyelid, in particular the part with values of km s-1, is now on the side closest to NGC 2207. Thus the velocity asymmetries may result from differences in the near-field tidal forces on the two eyelids. The western end of the northern eyelid connects smoothly in shape and velocity to the tidal bridge arm between the galaxies. The eastern end of the southern eyelid connects smoothly in shape and velocity to the shocked gas returning to the main disk from the southern side (leading edge) of the broad H I tidal tail (see Figure 1 and the CO and H I velocity fields in Figure 5), which is on the side of IC 2163 farthest from NGC 2207.
4. Correlation between and the Molecular Column Densities
4.1. Observed Correlation
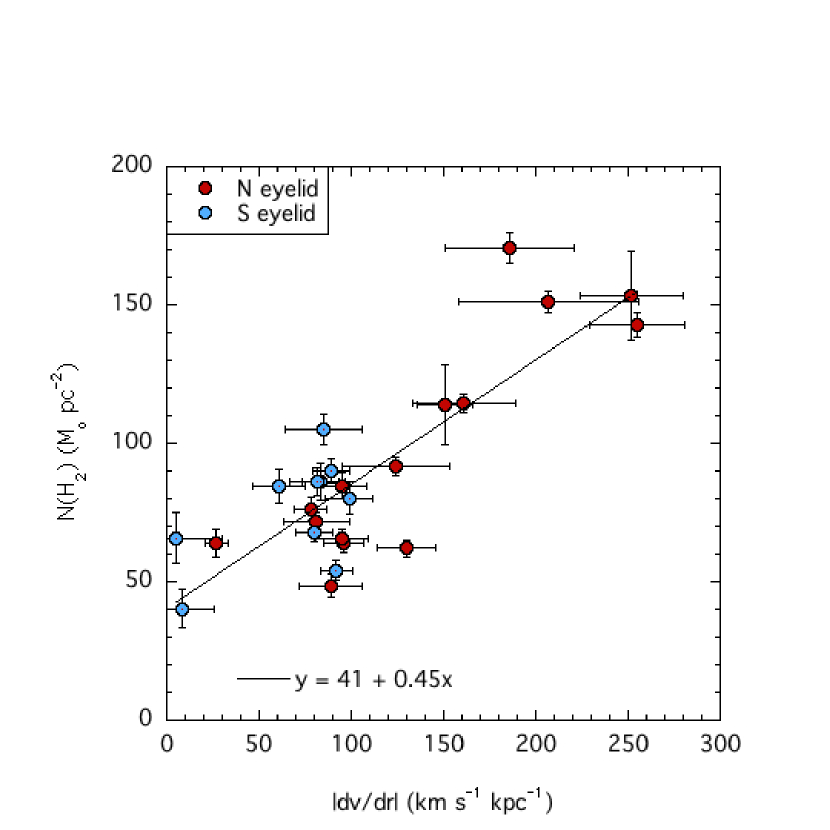
We consider what effect the large differences in velocity across the kpc width of each eyelid have had on the molecular column densities there. In Figure 7, we plot the LOS molecular column density from Column (3) of Table 2 versus the magnitude of the directional derivative of the velocity with respect to R from Column (5) of that table. The measurements for the 15 values of azimuth on the northern eyelid are plotted as red points; those for the 10 values of on the southern eyelid are plotted as blue points. A linear regression of on for all 25 points in this figure gives
| (4) |
for in pc-2 and in km s-1 kpc-1. The correlation coefficient is 0.84 with 23 degrees of freedom, and thus there is a strong correlation. Because the northern eyelid has a substantially larger range of than the southern eyelid, the regression tends to be dominated by the data on the northern eyelid. A linear regression for the 15 values of on the northern eyelid (the red points in Figure 7) gives
| (5) |
and a correlation coefficient of 0.87 with 13 degrees of freedom.
The values in this figure involve a combination of radial and tangential streaming. We assume that at the eyelids the tangential streaming . For the northern eyelid, the point for (where the measured represents pure radial streaming) and the point for (where the measured represents pure tangential streaming) lie on or very close to the fitted line in Figure 7. We do not measure the density contrast (eyelid/pre-eyelid) directly since our interferometric observations do not detect the pre-eyelid molecular column density.
Our choice of value for is listed in Section 2. If we were to choose a different value of for the eyelids, without varying its value with azimuth along the eyelid, this would change the slope of the fitted line in Figure 7, but there would still be a strong correlation between and .
The following factors may lead to some of the scatter seen in Figure 7 and/or decrease the slope of the line. (a) After losing some azimuthal velocity in the shock/shear zone in the eyelids, the gas will start to fall inward slowly. This would tend to decrease its density at the inner edge of the eyelid and should have a stronger effect for stronger shocks. In Figure 4 the CO emission from the southern eyelid appears more ratty at the inner edge than at the outer edge, which may be a consequence of shocks generating turbulence. (b) According to the encounter simulations, the gas reaching the eyelid comes in from a range of radii .
4.2. Interpretation of Correlation between and the Molecular Column Densities
The radial compression at the eyelids causes an increase in the gas column density by direct radial impact and also leads to a high rate of shear there. One expects shocks and compression from the radial streaming and also from the shear associated with tangential streaming; both types of streaming can lead to intersecting gas streams.
The following argument based on angular momentum conservation computes the rate of shear arising from radial streaming into the eyelids. Consider particles in an annulus bounded by radii and with and initial azimuthal velocities = = (for a flat rotation curve). If a perturbation kicks particles inward from to radius (partway between and ) and kicks particles outward from to radius to form a thinner annulus bounded by and , with , then by angular momentum conservation, the azimuthal velocity of particles initially at speeds up to
| (6) |
and the azimuthal velocity of particles initially at slows down to
| (7) |
The rate of shear between and
| (8) |
Substituting for and gives
| (9) |
Then setting , this reduces to
| (10) |
The density contrast is
| (11) |
Comparison of Equations (10) and (11) shows the proportionality between the rate of shear and the density contrast:
| (12) |
where = is the rate of shear.
The rate of shear and the column density contrast correlate with each other because both result from the radial compression of the eyelid.
From our data, we are unable to disentangle how much of the observed correlation in Figure 7 is due to direct radial impact and how much is a subsequent consequence of the shocks in the intersecting gas streams that arise from shear.
5. CO Velocity Dispersion
Since intersecting gas streams and shocks in the eyelid compression zone should increase the turbulence there, we consider whether the CO observations show evidence of high velocity dispersion in the eyelids.
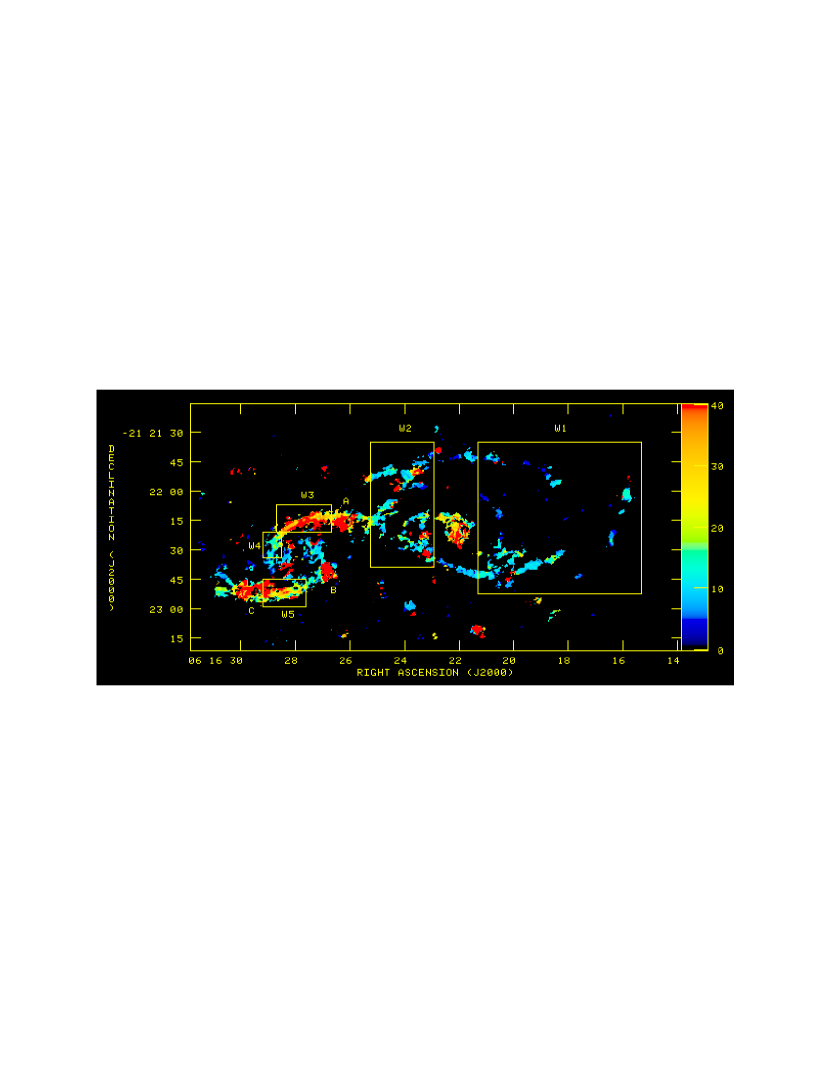
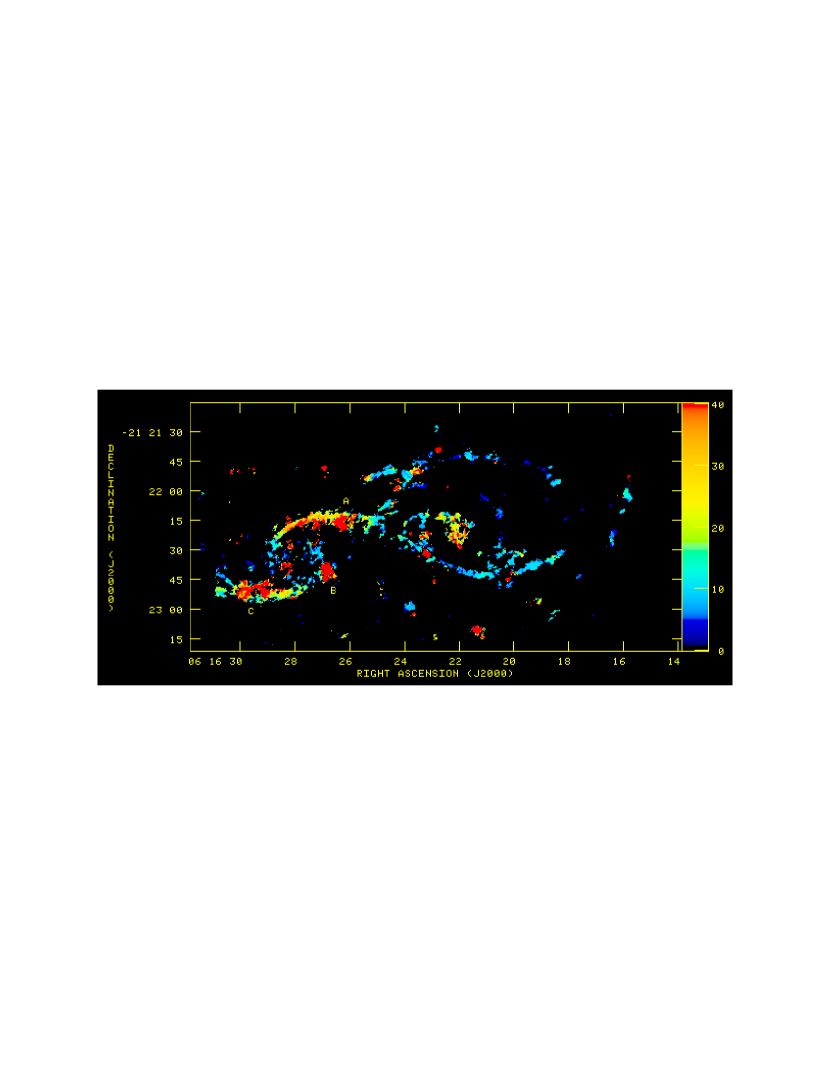
Figure 8 displays the CO velocity dispersion images before and after correcting for the mean velocity gradient across the FWHM of the PSF. For the various portions of the galaxy pair indicated by the boxes in the top panel of this figure, Table 3 lists the mean values of the uncorrected CO velocity dispersion , the corrected velocity dispersion , and their rms scatter.
For the spiral arms of NGC 2207 on its western (anti-companion) side, the mean rms scatter is km s-1. This is consistent with the value of the CO velocity dispersion that Mogotsi et al. (2016) find for bright CO emission in normal, nearby galaxies; their average for the CO mean velocity dispersions in 11 galaxies is km s-1, with a range of 7 to 15 km s-1. Our mean value of for the spiral arms of NGC 2207 on its companion side is somewhat higher than on its western side.
| Portion of Galaxy Pair | aaFrom measurements made at fixed values of in face-on polar coordinate images and averaged over in . The azimuth is measured ccw from the receding kinematic major axis at PA = . | corrected aamean of unblanked pixels rms scatter in the region |
|---|---|---|
| (km s-1) | (km s-1) | |
| Spiral arms of NGC 2207bb is the LOS velocity difference between the outer and inner edges of the eyelid, is the LOS molecular column density averaged over the area between the same outer and inner edges for the same fixed azimuth as , is the difference in face-on radius, and is the difference approximation to the directional derivative in the disk-plane of with respect to for fixed and inclination . | ||
| (W1) west of central bar | ||
| (W2) east of central bar | ||
| Features in IC 2163bbsee boxes marked in Figure 8 | ||
| (W3) northern eyelid | ||
| (W4) IR 8 + IR 9ccIR 8 and IR 9 are the IRAC clumps marked in Figure 9. | ||
| (W5) southern eyelid |
.
The CO velocity dispersion in a subtantial part of the eyelids is significantly higher than on the spiral arms of NGC 2207. As discussed below, we exclude from the eyelids the three dynamically complex regions labelled A, B, and C in Figure 8; they lie outside the range of studied in Table 2. Over much of the eyelids, the values of are high. However both eyelids have some regions, e.g., the IRAC clumps IR 8 plus IR 9 on the northern eyelid and IR 3 on the southern eyelid (see Figure 9 for the locations of these clumps), where is nearly the same as Mogotsi et al. (2016) find in normal galaxies. Our method of correcting for the mean velocity gradient across the synthesized beam introduced considerable blanking at these locations. The velocity dispersion before correcting for the velocity gradient (see the top panel of Figure 8 and Table 3) is also not particularly high in these regions.
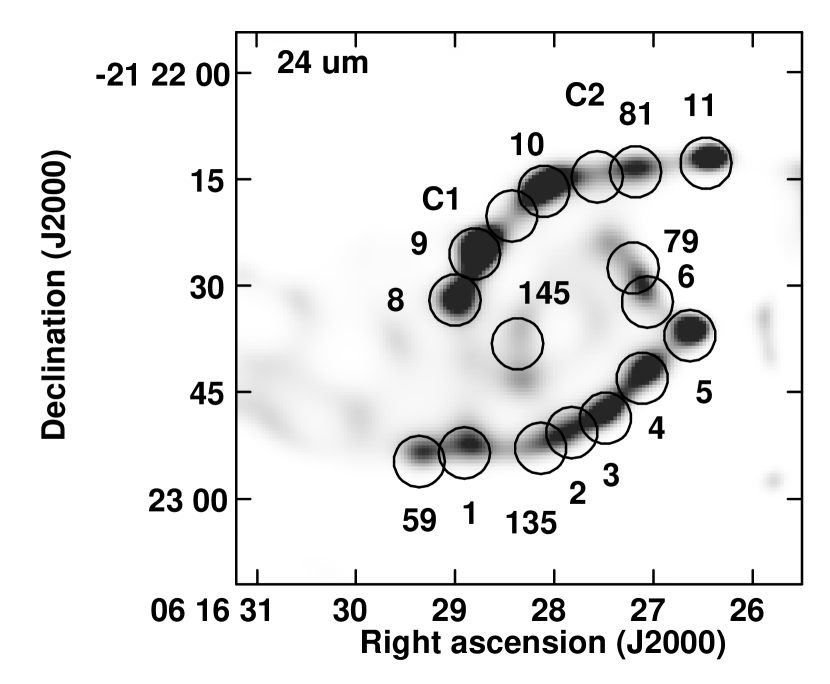
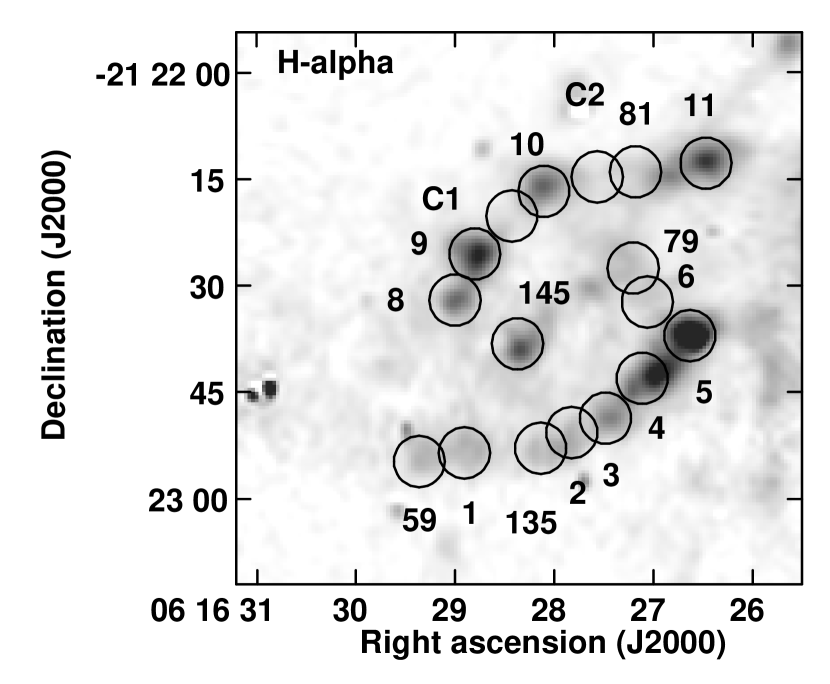
We rule out stellar feedback as the source of the high values of on the eyelids by comparing the locations of the bright clumps of 24 µm and H emission in IC 2163 (see Figure 9) with where the high values of velocity dispersion occur. The northern eyelid clumps IR 11, IR 10, IR 9, and IR 8 and the southern eyelid clumps IR 5, IR 4, and IR 3 are the most luminous clumps of 24 µm emission in IC 2163 and are also bright in H. Of these, IR 11, IR 10, IR 5 (which partially overlaps Region B), and IR 4 have km s-1, whereas IR 8, IR 9, and IR 3 have 11 km s-1. IR 9 is the second most luminous star-forming region in NGC 2207/IC 2163 in 8 µm, 24 µm, and cm radio continuum emission (Elmegreen et al., 2006; Kaufman et al., 2012; Elmegreen et al., 2016). In contrast, on the northern eyelid, the locations labelled C1 and C2 in Figure 9 have = 27 km s-1 and 35 km s-1, resp., but do not contain bright clumps of 24 µm or H emission.
Turbulence generated by the ocular shock front remains as a viable explanation for the high values of on much of the eyelids. The observed velocity dispersions may be an immediate result of the impact and shear in the eyelids or a subsequent development of microturbulence (random motions on small scales) as the components of the gas mix. Gravitational energy powers the microturbulence via gravito-hydrodynamic instabilities. The regions of low on both eyelids may be where the microturbulence dissipated, the energy was radiated away, and the gas was not stirred up again. These regions are farthest along the northern eyelid from the tidal bridge arm and somewhat far along the southern eyelid from the tidal tail. The presence of high velocity dispersion on substantial portions of the eyelids seems consistent with the prolonged effect of the prograde tidal force exerted by NGC 2207 on IC 2163 and thus in accord with the numerical models for the encounter by Elmegreen et al. (1995b, 2000) and Struck et al. (2005).
Gas streaming radially inward from the outer part of the galaxy may dissipate a lot of translational kinetic energy via shock heating or microturbulence in the eyelid compression zone. The amount of heating would depend on the details of how the gas flows into the eyelids, which is beyond what we can derive from the present data. Kaufman et al. (2012) find that the flux density ratio of 8 µm to cm radio continuum emission is a factor of two greater in the IRAC clumps on the eyelids than elsewhere in this galaxy pair, possibly an indication of shock-heated H2 in the eyelids.
Figure 10 displays samples of line profiles from the unmasked cube for the various boxes marked with W’s in Figure 8 and from Region A. At a number of positions in these W-box samples, we compare the value of from fitting the line profile in the unmasked cube with a single Gaussian to the value of from the second moment image in the top panel of Figure 8 (i.e., from the masked cube). The ratio of the Gaussian to the second moment has a mean value of 0.98, with an rms scatter of . In box W3 and much of box W5 on the eyelids, the line profiles are broad; the high values of result here from elevated turbulence. The line profiles in boxes W1 and W2 in NGC 2207 are narrow.
Region A at is where the northern eyelid joins the tidal bridge arm, and Region C at is where the southern eyelid joins the tidal tail. These are regions of complicated dynamics where the orbits change [see, for example, Fig. 2 in Elmegreen et al. (2000)]. Region C is part of the massive H I cloud I3 (see Section 3.2), which has a mean H I velocity dispersion of 51 km s-1. Region B () where the inner spiral arm seems to join the southern eyelid is another region of complex dynamics. In Region A, many of the line profiles consist of two narrow peaks separated by km s-1, and thus Region A is not a region of high turbulence. In Regions B and C, the situation from the line profiles is less clear.


6. Conclusions
In the encounter simulations by Elmegreen et al. (1995b, 2000) and Struck et al. (2005) for this galaxy pair, the prograde tidal force exerted on IC 2163 pulls outward on two opposite quadrants, producing the tidal tail and the tidal bridge, and pinches inward on the other two quadrants, producing the ocular structure. Although close, prograde, approximately in-plane collisions between disk galaxies of similar mass are not uncommon, only a few galaxies exhibiting ocular structure are known (Kaufman et al., 1997, 1999) because the ocular stage lasts for only an short time, e.g., the duration of the present ocular disturbance in IC 2163 is of the order of several yr. Our ALMA 12CO observations of the galaxy pair NGC 2207/IC 2163 with resolution provide the first observational confirmation from velocity data with sufficiently high spatial resolution of how ocular structure develops in such an encounter. This supports numerical models for the effects of close, prograde encounters in general.
We find large LOS velocity differences across the (= 1 kpc) width of each eyelid of the ocular, some in excess of 100 km s-1 over a wide range of azimuths. These are a mixture of radial and azimuthal streaming of gas at the outer edge of the eyelid relative to its inner edge. The sense of the radial streaming at the eyelids is consistent with the idea that material from the outer part of IC 2163 flows inward until it hits an angular momentum barrier, where the radial streaming slows down abruptly and produces the observed galactic-scale pileup/shock zone at the eyelids. Across the 1 kpc width of each eyelid, the corresponding values of in the disk-plane are large, with some on the northern eyelid in excess of 150 km s-1 kpc-1.
We note velocity asymmetries between the northern and southern eyelids and conjecture that these may result from differences in the near-field tidal forces on the two eyelids.
Radial streaming into the eyelids causes an increase in the gas column density by direct radial impact and also, with angular momentum conservation, leads to a high rate of shear. We find a strong correlation at fixed values of azimuth between the molecular column density and . Such a correlation may arise from a combination of the shocks produced by direct radial impact and the shocks in the intersecting gas streams resulting from shear.
Substantial portions of the eyelids have high CO velocity dispersion, which is not a product of stellar feedback. Since turbulence generated by the ocular shock front is an expected consequence of the prolonged prograde tidal force of NGC 2207 on IC 2163, the presence of high velocity dispersion on the eyelids is in accord with the above numerical models for the encounter.
The SPH model for NGC 2207/IC 2163 by Struck et al. (2005) has a full treatment of both galaxies simultaneously and handles gas plus stars but does not have sufficient number of particles or spatial resolution at the level of the eyelid width for predicting the values of as a function of azimuth in the eyelids. The latter is left for future models.
References
- Dame et al. (2001) Dame, T.M., Hartmann, D., & Thaddeus, P. 2001, ApJ, 655, 863
- Donner et al. (1991) Donner, K.J, Engstrom, S. & Sundelius, B. 1991, A&A, 252, 571
- Elmegreen et al. (1991) Elmegreen, D.M., Sundin, M., Elmegreen, B.G., & Sundelius, B. 1991, A&A, 244, 52
- Elmegreen et al. (1995a) Elmegreen, D.M., Kaufman, M., Brinks, E., Elmegreen, B. G., & Sundin, M. 1995a, ApJ, 453, 100
- Elmegreen et al. (1995b) Elmegreen, B.G., Sundin, M., Kaufman, M., Brinks, E., & Elmegreen, D.M. 1995b, ApJ, 453, 139
- Elmegreen et al. (1998) Elmegreen, B.G., Elmegreen, D.M., Brinks, E., et al. 1998, ApJ, 503, L119
- Elmegreen et al. (2000) Elmegreen, B.G., Kaufman, M., Struck, C., et al. 2000, AJ, 120, 630.
- Elmegreen et al. (2001) Elmegreen, D.M., Kaufman, M., Elmegreen, B.G., Brinks, E., Struck, C., Klaric, M., & Thomasson, M. 2001, AJ, 121, 182
- Elmegreen et al. (2006) Elmegreen, D.M., Elmegreen, B.G., Kaufman, M., Sheth, K., Struck, C., Thomasson, M., & Brinks, E. 2006, ApJ, 642, 158
- Elmegreen et al. (2016) Elmegreen, B.G., Kaufman, M., Bournaud, F., Elmegreen, D.M., Struck, C., Brinks, E., & Juneau, S. 2016, ApJ, 823, 26
- Kaufman et al. (1997) Kaufman, M., Brinks, E., Elmegreen, D.M, Thomasson, M., Elmegreen, B.G., Struck, C., & Klarić, M. 1997, AJ, 114, 2323
- Kaufman et al. (1999) Kaufman, M., Brinks, E., Elmegreen, B.G., Elmegreen, D.M., Klarić, M., Struck, C., Thomasson, M., & Vogel, S. 1999, AJ, 118, 1577
- Kaufman et al. (2012) Kaufman, M., Grupe, D., Elmegreen, B.G., Elmegreen, D.M., Struck, C., & Brinks, E. 2012, AJ, 144, 156
- Mineo et al. (2014) Mineo, S., Rapport, S., Levine, A., Pooley, D., Steinhorn, B., & Homan, J. 2014, ApJ, 797, 91
- Mogotsi et al. (2016) Mogotsi, K.M., de Blok, W.J.G., Caldú-Primo, A., Walter, F., Ianjamasimanana, R., Leroy, A.K., & Leroy, A.K. 2016, AJ, 151, 15
- Struck et al. (2005) Struck, C., Kaufman, M., Brinks, E., Thomasson, M., Elmegreen, B.G., & Elmegreen, D.M. 2005, MNRAS, 364, 69
- Sundin (1989) Sundin, M. 1989, in ”Dynamics of Astrophysical Disks,” ed. J. Sellwood, Cambridge University Press, p. 215
- Thomasson (2004) Thomasson, M. 2004, in ASP Conf. Ser. 320, The Neutral ISM in Starburst Galaxies, ed. S. Aalto, S. Hüttemeister, & A. Pedlar (San Francisco, CA: ASP), 81
- Velusamy et al. (2008) Velusamy, T., Marsh, K.A., Beichman, C.A., Backus, C.R., & Thompson, T.J. 2008, AJ, 136, 197