†These authors have equal contributions in the work.
Simultaneous measurement of mass and rotation of trapped absorbing particles in air
Abstract
We trap absorbing micro-particles in air by photophoretic forces generated using a single loosely focused Gaussian trapping beam. We measure a component of the radial Brownian motion of a trapped particle cluster and determine the power spectral density, mean squared displacement, and normalized position and velocity autocorrelation functions in order to characterize the photophoretic body force in a quantitative fashion for the first time. The trapped particles also undergo spontaneous rotation due to the action of this force. This is evident from the spectral density that displays clear peaks at the rotation and the particles’ inertial resonance frequencies. We fit the spectral density to the well-known analytical function derived from the Langevin equation, measure the resonance and rotation frequencies and determine values for particle mass that we verify at different trapping laser powers with reasonable accuracy.
Photophoretic forces jovanovic2009photophoresis have provided an alternate route for trapping absorbing mesoscopic particles in air, as these forces, having a thermal origin, are almost four orders of magnitude higher than optical radiation pressure or dipole forces Desyatnikov09 , when acting on particles of the same size. Such forces can therefore balance gravity, and recently, extensive use has been made of them to trap braun2013optically ; jauffred2015optical , controllably manipulate shvedov2010giant ; Shvedov:09 ; zhang2012observation , or even rotate lin2014optical particles in air using rather simple experimental configurations and without the use of tight focusing objective lenses typically warranted in optical gradient force trapping. However, there has been very little attempt to quantify the effects of these forces and observe their manifestations in the Brownian motion of trapped particles in comparison to the extensively studied problem of trapping using optical gradient forces.
In this paper, we address this issue, and study the motion of Brownian particles trapped under the influence of photophoretic forces. The particles are absorbing in nature and trapped in a very simple experimental set-up by a single Gaussian beam that is focused by a low magnification microscope objective. As shown in Fig. 1(a), we trap the particles in a vertical configuration, i.e. with the particles falling under gravity ( direction) while the laser beam travels in the direction. In this scenario, the particle is axially in equilibrium when gravity is balanced by the action of the radiation pressure and photophoretic forces, i.e. , where is the force due to gravity, is the radiation pressure force, is the photophoretic force arising due to difference of temperature on two opposite surfaces of the particle (), while is the longitudinal component of the photophoretic body force that is generated due to the variation of the accommodation coefficient across the surface of the trapped particle ( and , with ). The direction of this force is from to jovanovic2009photophoresis . At atmospheric pressures, dominates over Rohatschek1995 , and is therefore the dominant force balancing gravity. Due to the action of these competing forces, the particle is not necessarily trapped at the focus of the Gaussian beam, but at an axial distance from the beam center where the net force is zero zhang2012observation ; lin2014optical . The radial trapping is solely achieved by the transverse component of the body force which is similar to optical gradient forces in our experimental configuration since it is purely restoring in nature, there being no other balancing forces. It is also understandable that since is a body-fixed force, its direction with respect to the gravity leads to generation of a torque on the particle about the axis of , that leads to rotation of the trapped particle in the transverse direction wurm2008 . In fact, it is this rotation that provides the restoring force as the direction of reverses from points A to B in the rotation path shown in Fig. 1(b). Evidence of such rotation was recently demonstrated in Ref. lin2014optical , where the authors measured the rotation frequency in the time domain using simple detectors. However, other than rotation, the trapped particle also undergoes Brownian motion, which may be difficult to detect in the time domain due to the presence of the strong intensity modulation of the scattered light due to rotation of the particle. To resolve this issue, we use a position-sensitive detection system, and measure the Brownian motion of a trapped particle cluster from the scattered light intensity. This allows us to perform both time and frequency domain analyses to obtain interesting results which include estimates of the mass of the trapped particles.

The experimental schematic is shown in Fig. 1(c). For the experiment, we coat commercial spheres (Sigma Aldrich, mean diameter between 9-13 , density 1100 ) with by sonicating them in a sulfide salt solution followed by heat exposure in a furnace. A SEM image of the coated beads is shown in Fig. 1(d). The coating is not uniform, but in patches, and for determining mass of the particles, we consider an average thickness of around 100 nm which we determine by the total area covered by coated material compared to the area of the particles. The trapping laser is a diode laser at 671 nm with maximum power 300 mW which we couple into a 10X objective (MO1) using appropriate beam- shaping lenses L1 and L2 (Fig. 1(c)). The trapping chamber (GC) is a rectangular glass cuvette placed on a microscope glass slide affixed above the output pupil of MO1. The coated particles are taken on a glass cover slip that is attached on top of the sample chamber using sticky tape, so that the particles being on the inner surface fall down under gravity as the cover slip is perturbed mechanically. The focus of the objective is about 10 mm from the lower surface of GC. Imaging of trapped particles is performed on a CCD camera by a second 10X objective MO2 in a direction perpendicular to the trapping beam. The scaling of the images is performed by placing a known microscope calibration length standard (graduations at 10 intervals) at the focal plane of MO2. Particles are typically trapped about 1 mm above or below the focal point (Fig.r̃effig1(e)) as is usually the case in photophoretic trapping. We generally trap particle clusters which is clear from the Fig. 1(f) that is the zoomed-in image of Fig. 1(e). The size of the trapped cluster is measured to be around 52 . We often observe a chain of trapped particles similar to that reported in zhang2012observation - however, our focus in this paper is on single clusters. The motion of the trapped particle in the radial () direction is detected by a position sensitive detection system constructed around a balanced detection scheme li2010measurement designed by imaging the scatter from the trapped cluster on the edge mirror EM using lens L3. The edge mirror splits the detection beam into two halves that are focused on detectors PD1 and PD2 (Thorlabs PDA100A-EC Si-photodiodes). The output of the detectors is fed into sum and difference amplifiers such that the normalized detection signal is given by , where A and B are the outputs of the two detectors. Note that axial motion can be measured by rotating EM by from the configuration shown in Fig. 1(c). The final output is recorded in a computer using Labview. We record the Brownian motion of the trapped particle cluster at laser powers of 50, 100, and 200 mW before MO1. Note that as the laser power is increased, the axial trapping position is modified slightly towards higher values of as shown in Fig. 1(a), so that the imaging as well as the detection systems have to be realigned to obtain maximum signal.

A trapped Brownian particle under the influence of a linear restoring force obeys a second order Langevin equation given by
| (1) |
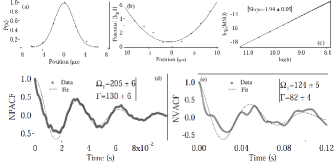
where , , being the viscosity of air, the radius of a particle assuming it is a sphere, and the mass. is the natural frequency given by , being the stiffness, , and is the delta-correlated stochastic noise characteristic of Brownian motion. Note that in our case originates from , with the latter being linearly proportional to the intensity of the trapping laser Rohatschek1995 ; wurm2008 at a particular air pressure. This implies that too should vary linearly with intensity as we demonstrate later. We proceed to determine the characteristics of the radial Brownian motion in the time domain. The results are shown in Fig. 2. Fig. 2(a) shows the normalized position probability histogram - in the direction which fits very well to a Gaussian. Note however, that the signal also includes the contribution of the rotation of the center of mass of the particle cluster, so that the total extent of the position distribution is possibly amplified from the case of pure translational/rotational Brownian motion. However, we are more interested in the qualitative nature of the position probability distribution which is useful in understanding the basic properties of photophoretic trapping. We determine the effective trapping potential from using the relation , where is the Boltzmann constant, and the temperature. The data fits well to a parabola of the form , where is a constant, which demonstrates that the effective potential near the trap center is parabolic as in the case of optical trapping so that the restoring force is clearly linear. Note again that the qualitative nature of the potential is of interest to us, so that the nature of the -scaling is largely unimportant. The potential is clearly harmonic which is consistent with particle rotation as well (since rotation is also a manifestation of simple harmonic motion). It is worthwhile to point out here that the exact particle dynamics in the time domain can be determined by a fast camera which will be able to resolve the Brownian motion from the rotation of the particle - this, however, is presently not available with us. We next determine the mean squared displacement () of the Brownian motion data and using the relation , being the time, we plot in Fig. 2(c). The value of the slope is , which signifies that we are indeed in the ballistic domain of Brownian motion - where the expected slope is 2. Finally, we calculate the and of the data. Note that the instantaneous velocity of a trapped particle can be calculated only in the ballistic domain due to the dependence of the . The and can be related to the parameters and by the following li2010measurement
| (2) | |||||
| (3) | |||||
where and denote position and velocity, respectively. We determine the and for all values of the trapping laser powers used by directly computing the autocorrelations from the Brownian motion data. For representation, we demonstrate the at 200 mW (Figs. 2(d)), and the at 50 mW (Figs. 2(e)) laser power. The calculated autocorrelations are each fit to the RHS of Eqs. 2 and 3 for the position and velocity, respectively. We determine the fit parameters and (the errors in the fit values are also shown at the level), from both the autocorrelation functions at all laser powers and the values come within 10% of each other at each power. However, the fits are not particularly good, and this may be due to the fact that the time series data is a convolution of the Brownian motion and the rotation due to the body force, which the fit functions fail to account for. This is why we resort to the frequency domain to obtain clear signatures of the inertia and the rotation, and use these values to calculate the mass of the trapped particle cluster. We do compare the fit values of and obtained by the time domain analysis to those obtained by the frequency domain analysis and observe agreement at the level, as we show later.
| Radius | Density | Mass | Laser | Fitted | Fitted | Mass from | Average | Calculated | |
|---|---|---|---|---|---|---|---|---|---|
| of particle () | power | (standard values) | from PSD | fit | k | ||||
| (m) | (kg/m3) | (kg) | (mW) | (kg/m s) | from PSD | (kg) | (kg) | (N/m) | |
| 50 | 1.96e-5 (325K) | 88(2) | 112(2) | 1.09(2)e-10 | 1.37(6)e-6 | ||||
| 26 | 1300 | 9.55e-11 | 100 | 2.18e-5 (375K) | 110(2) | 160(1) | 9.72(18)e-11 | 9.68(1.24)e-11 | 2.49(11)e-6 |
| 200 | 2.58e-5 (475K) | 150(2) | 239(3) | 8.42(12)e-11 | 4.81(17)e-6 |
We now analyze the data in the frequency domain by determining the PSD of the Brownian motion for the laser powers mentioned earlier. The sampling frequency is 6.5 kHz, and we average 25 individual spectra to generate each final spectrum. These are shown in Figs. 3(a)-(c). The PSD is given by
| (4) |
Here, is the conversion factor of the detector from voltage to actual displacement. We do not determine in the present case since it is not required in the measurements we report. We fit Eq. 4 to the data shown in Figs. 3(a)-(c). Now, the data show clear peaks at the natural frequency and the rotation. The fit function does not fit the rotation peak as expected, and we separately fit Lorentzian functions to determine the centers of the rotation peaks (. The fit parameters are shown in Table 1. It is clear that as the laser power is increased, the values of and increase. However, while increases linearly within , the rates of increase of and are different with increasing by a factor of around as the laser power is doubled, while the increase in is proportional to the value of in air as a function of temperature. The increase in , and accordingly the viscous damping as the laser power is increased is evident in Fig 3(a)-(c) from the gradual broadening of the resonance peak. From the fit values of , we determine by using , where the values of for calculating are evaluated from standard tables engineering assuming particular temperature values at different laser powers. We infer the temperature of the air in the following manner: we calculate the mass of the particle cluster from the measured diameter and the density which we estimate to be 1300 from the average thickness of the coating (100 ) and its density (7600 ) compared to the average diameter and density of the particles. For the lowest laser power of 50 mW measured near MO1, we consult the viscosity tables and select that value of viscosity using which the value of mass from the fit value of is reasonably close to . This occurs at around 325K, which implies that the laser heating of the particle has led to an increase of the air temperature in its vicinity by around 25K from room temperature, which is not very unreasonable. With this value of , = 1.09(2)e-11 kg - the error in parenthesis being due to the error in the fit for . This is within 15% of . For consistency check, we use the two other laser power values (100 and 200 mW), and assuming a linear dependence of air temperature increase with laser power, we find (Table 1) that the values of are within 10% of . Note here, that even if we assume a constant value of for the different laser power values, the value of differs only by 33% from , which implies that our error estimates are not unreasonable. The average value of is which is indeed very close to , albeit with a error of around 15%. We now calculate the stiffness at the different laser powers and observe from Table 1 that as expected, it increases linearly within the error values. In addition, the amplitude of the power spectra, , decreases linearly as increases, which again acts as a consistency check to the data. Finally, we observe that the values of and obtained from the and shown in Fig. 2(d) and (e) agree with that from the PSD at the same laser powers at the level.
In conclusion, we develop a very simple optical trapping set-up for confining absorbing particles in air with a single loosely focused Gaussian laser beam. We characterize the radial component of the photophoretic body force and show its equivalence to the optical intensity gradient force commonly used in optical tweezers. For this, we detect the radial () Brownian motion and analyse it both in the time and frequency domain. The latter seems the most reliable technique to study the motion of trapped particles, as it clearly separates out the inertial resonance from the rotation induced by . We find out the changes in both frequencies due to increase in laser power, and are also able to extract an estimate of the particle mass with around 15% accuracy by fitting the power spectral density to the analytical expression derived from the Langevin equation - a procedure we intend to improve in the future by employing Bayesian statistics. Ours is the first direct characterization of particle motion induced by photophoretic forces using a very simple experimental set-up, and may set the path for more precise experiments that could help develop crucial understanding about photophoretic forces that have deep connotations in diverse natural phenomenon ranging from planet formation planetform2013 to stratification in the atmosphere wurm2008 .
This work was supported by the Indian Institute of Science Education and Research, Kolkata, an autonomous research and teaching institute funded by the Ministry of Human Resource Development, Govt. of India.
References
- (1) O. Jovanovic, J. Quant. Spectrosc. Rad. Transf. 110, 889–901 (2009).
- (2) A. S. Desyatnikov, V. G. Shvedov, A. V. Rode, W. Krolikowski, and Y. S. Kivshar, Opt. Express 17, 8201–8211 (2009).
- (3) M. Braun and F. Cichos, ACS nano 7, 11200–11208 (2013).
- (4) L. Jauffred, S. M.-R. Taheri, R. Schmitt, H. Linke, and L. B. Oddershede, Nano Lett. 15, 4713–4719 (2015).
- (5) V. G. Shvedov, A. V. Rode, Y. V. Izdebskaya, A. S. Desyatnikov, W. Krolikowski, and Y. S. Kivshar, Phys. Rev. Lett. 105, 118103 (2010).
- (6) V. G. Shvedov, A. S. Desyatnikov, A. V. Rode, W. Krolikowski, and Y. S. Kivshar, Opt. Express 17, 5743–5757 (2009).
- (7) Z. Zhang, D. Cannan, J. Liu, P. Zhang, D. N. Christodoulides, and Z. Chen, Opt. Express 20, 16212–16217 (2012).
- (8) J. Lin and Y. qing Li, Appl. Phys. Lett. 104, 101909 (2014).
- (9) H. Rohatschek, J. Aerosc. Sc. 26, 717–734 (1995).
- (10) G. Wurm and O. Krauss, Atmosph. Env. 42, 2682–2690 (2008).
- (11) T. Li, S. Kheifets, D. Medellin, and M. G. Raizen, Science 328, 1673–1675 (2010).
- (12) http://www.engineeringtoolbox.com/dry-air-properties-d_973.html.
- (13) J. Teiser and S. E. Dodson-Robinson, Astronom. and Astrophys. 555, A98 (2013).
Complete References:
-
1.
O. Jovanovic, “Light induced motion of particles suspended in gas”, J. Quant. Spectroscop. and Rad. Transf. 110, 889–901 (2009).
-
2.
A. S. Desyatnikov, V. G. Shvedov, A. V. Rode, W. Krolikowski, and Y. S. Kivshar “Photophoretic manipulation of absorbing aerosol particles with vortex beams: theory versus experiment”, Opt. Express 17, 8201–8211 (2009).
-
3.
M. Braun and F. Cichos, “Optically controlled thermophoretic trapping of single nano-objects”, ACS nano 7, 11200–11208 (2013).
-
4.
L. Jauffred, S. M.-R. Taheri, R. Schmitt, H. Linke, and L. B. Oddershede, “Optical trapping of gold nanoparticles in air”, Nano Lett. 15, 4713–4719 (2015).
-
5.
V. G. Shvedov, A. V. Rode, Y. V. Izdebskaya, A. S. Desyatnikov, W. Krolikowski, and Y. S. Kivshar, “Giant optical manipulation”, Phys. Rev. Lett. 105, 118103 (2010).
-
6.
V. G. Shvedov, A. S. Desyatnikov, A. V. Rode, W. Krolikowski, and Y. S. Kivshar, “Optical guiding of absorbing nanoclusters in air”, Opt. Express 17, 5743–5757 (2009).
-
7.
Z. Zhang, D. Cannan, J. Liu, P. Zhang, D. N. Christodoulides, and Z. Chen, “Observation of trapping and transporting air-borne absorbing particles with a single optical beam”, Opt. Express 20, 16212–16217 (2012).
-
8.
J. Lin and Y. qing Li, “Optical trapping and rotation of airborne absorbing particles with a single focused laser beam”, Appl. Phys. Lett. 104, 101909 (2014).
-
9.
H. Rohatschek, “Semi-empirical model of photophoretic forces for the entire range of pressures”, J. Aerosc. Sc. 26, 717–734 (1995).
-
10.
G. Wurm and O. Krauss, “Experiments on negative photophoresis and application to the atmosphere”, Atmosph. Env. 42, 2682–2690 (2008).
-
11.
T. Li, S. Kheifets, D. Medellin, and M. G. Raizen, “Measurement of the instantaneous velocity of a brownian particle”, Science 328, 1673–1675 (2010).
-
12.
http://www.engineeringtoolbox.com/dry-air-properties-d_973.html.
-
13.
J. Teiser and S. E. Dodson-Robinson, “Photophoresis boosts giant planet formation”, Astronom. and Astro- phys. 555, A98 (2013).