A New, Low Braking Index For the LMC Pulsar B054069
Abstract
We report the results of a 16-month monitoring campaign using the Swift satellite of PSR B054069, a young pulsar in the Large Magellanic Cloud. Phase connection was maintained throughout the campaign so that a reliable ephemeris could be determined, and the length of the campaign is adequate to accurately determine the spin frequency and its first and second derivatives. The braking index is (90% confidence), a value much lower than previously reported for B054069 and almost all other young pulsars. We use data from the extensive monitoring campaign with RXTE to show that timing noise is unlikely to significantly affect the measurement. This is the first measurement of the braking index in the pulsar’s recently discovered high spin-down state. We discuss possible mechanisms for producing the low braking index.
Subject headings:
pulsars: individual (PSR B054069)1. Introduction
Rotation-powered pulsars gradually convert their rotational energy to energetic particles and electromagnetic radiation, which slowly reduces the rate of rotation. A detailed understanding of this process, including the configuration of the pulsar’s magnetosphere and the physical mechanisms therein remains elusive. The evolution of the spin frequency reveals information about the torques acting on the neutron star and thus provides clues about the physical processes at work in the neutron star and its magnetosphere. The gradual evolution of is typically described as a Taylor series of and its time derivatives. For many pulsar models , where is related to properties of the neutron star and is the “braking index”. For constant , . For the idealized case of magnetic dipole radiation from a spinning neutron star in a vacuum, the braking index is 3 (e.g., Ostriker & Gunn 1969). Measurement of the braking index is usually difficult because changes very slowly for old pulsars, and timing noise and sudden changes in the spin rate (“glitches”) can be complications for young pulsars.
B054069 is a remarkable rotation-powered pulsar in the Large Magellanic Cloud (LMC). Its spin-down luminosity () is among the largest for all pulsars (ATNF Pulsar Catalog111http://http://www.atnf.csiro.au/reasearch/pulsar/psrcat, Manchester et al. 2005). It is by far the most luminous pulsar known in gamma-rays (Fermi LAT Collaboration, 2015). B054069 has also been detected in the optical (Mignani et al. 2010 and references therein) and radio (Manchester et al. 1993) bands. The slowdown of B054069 is relatively stable for a young pulsar, and it is one of only 9 young pulsars for which a braking index has been reliably measured (Lyne et al. 2015; Ou et al. 2016; Archibald et al. 2016). Except for J16404631, the braking indices for all 9 pulsars are smaller than that expected for the simple magnetic dipole model. We do not include the young pulsar J05376910, for which Middleditch et al. (2006) presented evidence for by noting the evolution of the minimum and maximum values for during intervals between the numerous glitches. A much higher value for is seen during the phase-connected observations between glitches. B054069 has been extensively studied since its discovery with the Einstein Observatory (Seward et al. 1984). Ferdman et al. (2015) used 15.8 years of data from the Rossi X-ray Timing Explorer (RXTE) to determine a braking index of that was consistent over the entire data span.
Marshall et al. (2015) recently discovered a transition to a new spin-down state for B054069 that had persisted for at least 1349 days. Despite the extensive previous observations of B054069 it appears that this new spin-down state had never been seen before. Rapid transitions between two spin-down states have been seen for other pulsars (e.g., Lyne et al. 2010). “Intermittent pulsars” (Kramer et al. 2006; Young et al. 2013) are extreme examples of such pulsars. They transition from a radio-on state to radio-off state with a simultaneous change in the spin-down rate. More observations are needed to determine whether B054069 should be considered an intermittent pulsar.
In this paper we present and discuss the timing analysis of the continuing monitoring campaign of B054069 with Swift. The new measurements are combined with the earlier observations with Swift reported in Marshall et al. (2015) and compared with results from the extensive monitoring with RXTE. Details of the observations and the results of the temporal analysis are reported in Section 2, and interpretations are given in Section 3. Finally, Section 4 is a summary.
2. Observations and Data Reduction
B054069 has been regularly observed with the X-Ray Telescope (XRT) instrument (Burrows et al. 2005) on the Swift Gamma-Ray Burst Explorer (Gehrels et al. 2004) starting in Feb., 2015. The XRT is a focusing X-ray telescope with a CCD detector with an effective bandpass of keV. The cadence of the observations was chosen to maintain phase information throughout the campaign. We report on observations through June, 2016, and compare our results to those from the earlier 12.5-year monitoring campaign with the RXTE. Results from RXTE observations have been reported by Zhang et al. (2001), Livingstone et al. (2005) and Ferdman et al. (2015).
We followed the same data analysis procedures given in Marshall et al. (2015). X-ray events from each continuous observing interval (a “snapshot”) were screened to maximize the signal from the pulsar, including restricting the energy range to keV. Arrival times were corrected to the solar system barycenter using the Hubble Space Telescope position of , (J2000.0) (Mignani et al. 2010) and the JPL Planetary Ephemeris DE-200. The mean of the start and stop times of the snapshot was used as the epoch of the snapshot. Events were folded on multiple candidate pulsar periods, and a sine wave was fit to the best folded light curve. The peak of the sine wave was used to determine the pulsar phase at the epoch. The one uncertainty in the phase was set to , in which is the relative amplitude of the sine wave and is the total number of counts. The lengths of the snapshots ranged from 213 s to 1796 s because of the complexities of scheduling Swift observations. Typically the pulsar was not detected in the very short snapshots. Table 1 is a log of all the snapshots used in this paper.
Uncertainties quoted in this paper are given at the 90% confidence level unless otherwise noted.
2.1. Swift XRT Timing Analysis
The XRT started observations of B054069 on Feb. 17, 2015, as part of a Target of Opportunity campaign. All observations were made using the Window Timing (WT) mode in which the central 200 CCD columns are continously read out, providing a time resolution of 1.7 ms. The XRT data were reduced with the standard software (xrtpipeline v0.13.2) applying the default filtering and screening criteria (HEASoft 6.19), using the latest updates to the XRT CALDB files and to the clock correction file. The phase and frequency were measured for each snapshot in which the pulsar was detected.
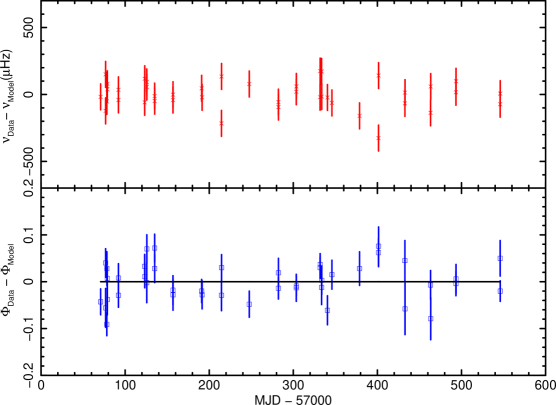
We used the following steps to determine the best-fit ephemeris (Table 2). We started with the ephemeris reported by Marshall et al. (2015) and computed the differences between the predicted frequencies for each snapshot and the observed frequencies. We then fit a linear model to the frequency differences to produce an updated estimate for and . We set to 0.0 because this process is not sensitive to any plausible value for . Fitting the measured frequencies does not suffer from the unavoidable integer-cycle phase ambiguity that affects fitting phases, but it produces much larger uncertainties for the ephemeris parameters. Subsequent steps to determine the best ephemeris used fits to the observed phases (rather than the frequencies). We then did a grid search of possible values for and using the closely spaced observations near MJD 57333, which contain 5 snapshots. The grid was centered near the values obtained from fitting the frequencies and covered more than twice the 90%-confidence error intervals for the parameters. The grid search confirmed that there were no other reasonable values for and . We then gradually extended the observations being fit to earlier and later times and found that the entire data set could be fit after making small adjustments to and and adding a small term. The result was a phase-connected ephemeris for the entire time span of 16 months. The final parameter values for the best-fit ephemeris are given in Table 2, and the residuals to values predicted by the best-fit ephemeris are shown in Figure 1. The value of 1.76 for the reduced for the fit indicates a modest amount of unmodelled phase noise. Because of this extra noise, the uncertainties in Table 2 are determined by noting the change in the parameter corresponding to an increase in of instead of the usual for 90% confidence.
Although the value for is unexpectedly low, we are quite confident that we have determined the correct ephemeris. The procedure for modeling the observed frequencies is not affected by any phase ambiguity, and uniqueness of the best-fit values for and was confirmed with the grid search. Substantially different values for are constrained by the long time span of the observations. For example, a of s-3, as reported by Ferdman et al. (2015), produces a change in phase of where is the time from the epoch time of the ephemeris. If the correct value for is comparable (or larger than) the value reported by Ferdman et al. (2015), then as we expand the time interval being fit beyond s the phase residuals should start deviating from the best-fit ephemeris. No such deviations are seen. All 27 snapshots with s match the predicted phase to within . This is compelling evidence that our best-fit ephemeris is correct.
2.2. Timing Noise in the RXTE and Swift Eras
Pulsar timing noise is quasi-random changes in that can affect the measurement of in ways that are hard to predict. The lack of any glitch in the 16 months of XRT observations and the small phase residuals (Fig. 1) to a third-order polynomial model for this interval suggest that the timing noise for the two spin-down states may be comparable. We examined the RXTE data to determine the effect of timing noise on as determined using time spans of 16 months (the duration of the XRT observations). We used 156 observations spaced over the span of 4560 days, which was easily adequate to maintain phase information. We divided the well sampled observations into nine 16-month intervals, and computed the braking index for each of intervals. We then offset the intervals by 8 months and repeated the analysis. The usual Taylor series expansion including provided a good fit to the observed phases for all the intervals except those containing the two small glitches (at MJD 51349 and 52925) reported by Ferdman et al. (2015). The glitches are readily apparent in the data as gradually growing deviations from the predicted phase over time scales of s. No such glitches are seen in the current campaign with Swift. We eliminated the data affected by the glitches from two of the intervals in each group. A small spread in the braking index is found in each group. The mean value for the first group is 2.115 with a standard deviation of 0.018. The mean for the second group is 2.131 with a standard deviation of 0.050. These results indicate timing noise has a relatively small effect on the determination of the braking index of B054069 when measured over 16-month intervals. If the timing noise during the current campaign is comparable to that seen during the RXTE campaign, then it is very unlikely that the very low braking index measured in the current campaign is significantly affected by timing noise.
3. Discussion
B054069 has been extensively monitored by many observatories in the more than 30 years since its discovery. There have been numerous measurements of and thus the braking index, first by Middleditch et al. (1987) and most recently by Ferdman et al. (2015). Boyd et al. (1995), Deeter et al. (1999), and Ferdman et al. (2015) summarize the many observations and discuss the measurement difficulties. The values for the braking index range from a low of (Zhang et al. 2001) to a high of (Ögelman & Hasinger 1990) for those measurements with small reported uncertainties. The results can be affected by unseen glitches, timing noise, inaccurate positions for the pulsar, and instrumental timing errors, and these effects are likely contributing to the wide range of inconsistent values reported. Using data from RXTE avoids or mitigates these problems. The observations were sufficiently frequent to maintain phase information and identify glitches, an accurate pulsar position was known and could be checked with the pulsar data, instrument time tags were accurate, and the effect of timing noise could be estimated (e.g., Section 2.2). The braking indices determined using the RXTE data by Cusumano et al. (2003) (), Livingstone et al. (2005) (), and Ferdman et al. (2015) () are very similar. Further, Ferdman et al. (2015) report that a consistent braking index is measured for the entire 15.8 years covered. Zhang et al. (2001) also used RXTE data, but their low braking index may be affected by the inaccurate position of the pulsar they used combined with the short data span of only 289 days. All these measurements of the braking index were for times when B054069 was in its low spin-down state. We conclude that the most reliable measurements are from RXTE and that there is no compelling evidence that the braking index has changed since the pulsar was discovered until its transition to a new spin-down state in 2011.
We report the first determination of the braking index for the high spin-down state of B054069. The measured value of is very much lower than and inconsistent with that of any of the previous measurements, which were all done during the low spin-down state. This is compelling evidence that the transition to the new spin-down state caused the change in the braking index.
Such large changes in the braking index are unusual for young pulsars. Previous reports of large changes have been for pulsars with high magnetic fields and the changes are induced by large glitches. Livingstone et al. (2011) reported a reduction in of for J18460258 after magnetar-like behavior in 2006 including a glitch, an X-ray flux increase, and spectral changes. Its magnetic field is . Archibald et al. (2015) confirmed this change with a much longer time span of post-glitch observations. Antonopoulou et al. (2015) reported a possible reduction in by after glitches in 2004 and 2007 for J1119-6127, which has a surface dipole magnetic field of . A large change in was also reported in the high-magnetic-field () pulsar J1718-3718 (Manchester & Hobbs 2011), but the very large negative values for are difficult to interpret. Archibald et al. (2015) suggest that the large magnetic field is responsible for the change in braking index for these pulsars. Since the magnetic fields for these pulsars are much larger than the field for B054069, and the state change for B054069 was not caused by a glitch, these may be different phenomena.
The increase in the spin-down rate of B054069 by 36% suggests the possibility of a new component contributing to the spin-down rate. This situation can be modelled as (c.f., Equation 8 in Lyne et al. 2015) in which and the braking index apply to both the low and high spin-down states and and apply only to the high spin-down state. The values of , , and can be solved for using the values of and the braking index measured for the low and high spin-down states. A braking index of for the low spin-down state leads to . This very unusual value for the braking index indicates that the change in spin-down state is probably not caused by the addition of a new component with the old spin-down mechanism(s) unchanged.
Braking indices have been measured for 9 young pulsars, including B054069. Measured braking indices for young pulsars range from for J17343333 (Espinoza et al. 2011) to for J16404631 (Archibald et al. 2016). The new value for the high spin-down state of B054069 is substantially lower than and inconsistent with the values for these young pulsars. Except for J16404631, all the measured braking indices are less than 3, the value for pure magnetic dipole radiation. A wide range of explanations have been suggested for the low measured braking indices including additional emission components and changing values for the pulsar’s magnetic dipole moment , its moment of inertia , or the inclination angle between the magnetic and rotation axes.
Michel & Tucker (1969) showed that for a pulsar wind model the braking index is 1 rather than 3, and several authors suggested this as an explanation for braking indices . For example, Lyne et al. (2015) estimated the fractional contribution of wind and dipole components for the Crab and Vela pulsars based on their measured braking indices. Kou et al. (2016) predicted the braking index for B054069 in its high spin-down state using a model with both magnetic dipole radiation and a pulsar wind. A value of 1.79 was predicted using the vacuum gap model of Ruderman & Sutherland (1975). Other acceleration models predict similar values for (Table 2 in Kou et al. 2016), all inconsistent with our measured value.
Secular changes in the characteristics of the pulsar, such as , or , could also have a significant effect on the braking index (e.g., Blandford & Romani 1988). Gourgouliatos & Cumming (2015) investigated the evolution of the magnetic field in the crust of the neutron star and concluded that this could explain the low values of seen for young pulsars. Ho (2015) explained the low braking indices of pulsars as the result of a growing surface magnetic field after it is buried at the birth of the neutron star. For both these models, a rapid change in the rate of evolution would also be required to explain the change in seen in the transition to the high spin-down state of B054069. Lyne et al. (2013) measured a steady increase in the separation of the main radio pulse and the interpulse in the Crab pulsar and noted that this could be caused by an increase in . Lyne et al. (2015) suggest that this steady increase could be responsible for the difference in the measured braking index for the Crab of 2.50 and the nominal value of 3.0. If this is the correct interpretation for B054069, then a value of of years is needed for the high spin-down state and years for the low spin-down state. For , the corresponding characteristic time scales for , , and are a factor of , , and (for , Zhang & Cheng 2000) lower than the value for respectively. These time scales only apply to the high spin-down state, and would have to abruptly change at the transition to this state.
Menou et al. (2001) and Chen & Li (2016) investigated pulsar models with torque from a surrounding disk that with plausible assumptions will produce braking indices of and respectively. These models can produce the small measured braking index of by changing the disk accretion rate, but the simplest two-component model described above produces a change in much larger than that observed.
4. Summary
We report the first measurement of the braking index for the high spin-down state of B054069. The measured value of is much lower than any of the numerous previous measurements, all of which were for the low spin-down state of B054069. Using the extensive observing campaign with RXTE , we show that timing noise is unlikely to significantly affect our measurement. This remarkably low braking index is not consistent with models that combine magnetic dipole radiation and wind components. Torque from a surrounding disk could produce the low measured value, but the simplest model does not reproduce the observed change in . Secular changes on a time scale of years in a pulsar parameter, such as the inclination angle or magnetic field strength, might cause such a low braking index.
This work made use of data supplied by the UK Swift Science Data Centre at the University of Leicester and the High Energy Astrophysics Science Archive Research Center, provided by NASA’s Goddard Space Flight Center.
References
- Antonopoulou et al. (2015) Antonopoulou, D., et al. 2015, MNRAS, 447, 3924
- Archibald et al. (2015) Archibald, R. F., et al. 2015, ApJ, 810, 67
- Archibald et al. (2016) Archibald, R. F., et al. 2016, ApJ, 819, L16
- Blandford et al. (1988) Blandford, R. D. & Romani R. W. 1988, MNRAS, 234, 57p
- Boyd et al. (1995) Boyd, P. T., et al. 1995, ApJ, 448, 365
- Burrows et al. (2005) Burrows, D. N., et al. 2005, Space Science Reviews, 120, 165
- Chen et al. (2016) Chen, W. C., & Li, X. D. 2016, MNRAS, 455, L87
- Cusumano et al. (2003) Cusumano, G., Massaro, E. & Mineo, T. 2003, A&A, 402, 647
- Deeter et al. (1999) Deeter, J. E., Nagase, F. & Boynton, P. E. 1999, ApJ, 512, 300
- Espinoza et al. (2011) Espinoza, C. M., et al. 2011, ApJ, 741, L13
- Ferdman et al. (2015) Ferdman, R. D., Archibald, R. F. & Kaspi, V. M. 2015, ApJ, 812, 95
- Fermi LAT Collaboration (2015) Fermi LAT Collaboration, et al. 2015, Science, 350, 801
- Gehrels et al. (2004) Gehrels, N., et al. 2004, ApJ, 611, 1005
- Gourgouliatos et al. (2015) Gourgouliatos, K. N. & Cumming, A. 2015, MNRAS, 446, 1121
- Ho (2015) Ho, W. C. G. 2015, MNRAS, 452, 845
- Kou et al. (2016) Kou, F. F., Ou, Z. W. & Tong, H. 2016, RAA (Research in Astronomy & Astrophysics), 16, 79
- Kramer et al. (2006) Kramer, M., et al. 2006, Science, 312, 549
- Livingstone et al. (2005) Livingstone, M. A., et al. 2005, ApJ, 633, 1100
- Livingstone et al. (2011) Livingstone, M. A., et al. 2011, ApJ, 730, 66
- Lyne et al. (2010) Lyne, A. G. et al. 2010, Science, 329, 408
- Lyne et al. (2013) Lyne, A. G. et al. 2013, Science, 342, 598
- Lyne et al. (2015) Lyne, A. G. et al. 2015, MNRAS, 446, 857
- Manchester et al. (1993) Manchester, R. N., et al. 1993, ApJ, 403, L29
- Manchester et al. (2005) Manchester, R. N., Hobbs, G. B., Teoh, A. & Hobbs, M., 2005 AJ, 129, 1993
- Manchester & Hobbs (2005) Manchester, R. N., & Hobbs, G. 2011 ApJ, 736, L31
- Marshall et al. (2015) Marshall, F. E., et al. 2015, ApJ, 807, L27
- Menou et al. (2001) Menou, K., Perna, R. & Hernquist, L. 2001, ApJ, 554, L63
- Michel et al. (1969) Michel, F. C., & Tucker, W. H. 1975, Nature, 223, 227
- Middleditch et al. (1987) Middleditch, J., Pennypacker, C. R. & Burns, M. S. 1987, ApJ, 315, 182
- Middleditch et al. (2006) Middleditch, J., Marshall, F. E., Wang, Q. D., Gotthelf, E. V., & Zhang, M. 2006, ApJ, 652, 1531
- Mignani et al. (2010) Mignani, R. P., et al. 2010, A&A, 515, 110
- Ogelman et al. (1990) Ögelman, H., & Hasinger, G. 1990, ApJ, 353, L21
- Ostriker et al. (1969) Ostriker, J. P., & Gunn, J. E. 1990, ApJ, 157, 1395
- Ou et al. (2016) Ou, Z. W., Tong, H., Kou, F. F. & Ding, G. Q. 2016, MNRAS, 457, 3922
- Ruderman et al. (1975) Ruderman, M. A., & Sutherland, P. G. 1975, ApJ, 196, 51
- Seward et al. (1984) Seward, F. D., Harnden, F. R. & Helfand, D. J. 1984, ApJ, 287, L19
- Young et al. (2013) Young, N. J., et al. 2013, MNRAS, 429, 2569
- Zhang et al. (2000) Zhang, L., & Cheng, K. S. 2000, A&A, 363, 575
- Zhang et al. (2001) Zhang, W., et al. 2001, ApJ, 554, L177
| Satellite | Obs. ID | Date | MJD | |
|---|---|---|---|---|
| (1) | (1) | (2) | ||
| Swift | 00033603002 | 2015 Feb 17 | ||
| Swift | 00033603004 | 2015 Feb 23 | ||
| Swift | 00033603004 | 2015 Feb 23 | ||
| Swift | 00033603005 | 2015 Feb 25 | ||
| Swift | 00033603005 | 2015 Feb 25 | ||
| Swift | 00033603006 | 2015 Feb 25 | ||
| Swift | 00033603006 | 2015 Feb 25 | ||
| Swift | 00033603007 | 2015 Mar 11 | ||
| Swift | 00033603007 | 2015 Mar 11 | ||
| Swift | 00033603008 | 2015 Apr 11 | ||
| Swift | 00033603008 | 2015 Apr 11 | ||
| Swift | 00033603009 | 2015 Apr 13 | ||
| Swift | 00033603009 | 2015 Apr 13 | ||
| Swift | 00033603010 | 2015 Apr 23 | ||
| Swift | 00033603010 | 2015 Apr 23 | ||
| Swift | 00033603011 | 2015 May 14 | ||
| Swift | 00033603011 | 2015 May 14 | ||
| Swift | 00033603012 | 2015 Jun 18 | ||
| Swift | 00033603013 | 2015 Jun 18 | ||
| Swift | 00033603014 | 2015 Jul 11 | ||
| Swift | 00033603014 | 2015 Jul 11 | ||
| Swift | 00033603015 | 2015 Aug 13 | ||
| Swift | 00033603016 | 2015 Sep 17 | ||
| Swift | 00033603016 | 2015 Sep 17 | ||
| Swift | 00033603017 | 2015 Oct 08 | ||
| Swift | 00033603017 | 2015 Oct 08 | ||
| Swift | 00033603018 | 2015 Nov 05 | ||
| Swift | 00033603018 | 2015 Nov 05 | ||
| Swift | 00033603019 | 2015 Nov 07 | ||
| Swift | 00033603019 | 2015 Nov 07 | ||
| Swift | 00033603020 | 2015 Nov 14 | ||
| Swift | 00033603021 | 2015 Nov 19 | ||
| Swift | 00033603022 | 2015 Dec 22 | ||
| Swift | 00033603023 | 2016 Jan 14 | ||
| Swift | 00033603023 | 2016 Jan 14 | ||
| Swift | 00033603024 | 2016 Feb 14 | ||
| Swift | 00033603024 | 2016 Feb 14 | ||
| Swift | 00033603025 | 2016 Mar 16 | ||
| Swift | 00033603025 | 2016 Mar 16 | ||
| Swift | 00033603026 | 2016 Apr 15 | ||
| Swift | 00033603026 | 2016 Apr 15 | ||
| Swift | 00033603030 | 2016 Jun 06 | ||
| Swift | 00033603030 | 2016 Jun 06 |
Note. — (1) At the start of the snapshot; (2) Exposure time in ks
| Parameter | 2015 - 2016 |
|---|---|
| (1) | |
| Epoch (Modified Julian Date) | 57281.24147641701 TDB |
| Phase | 0.000 (15) |
| (Hz) | 19.6963233901 (22) |
| () | -2.5286507 (15) |
| () | 0.104 (41) |
Note. — (1) The numbers in parentheses are the 90% confidence errors quoted in the last digit.