Contribution of Neutron Star Mergers to the R-process Chemical Evolution in the Hierarchical Galaxy Formation
Abstract
The main astronomical source of r-process elements has not yet been identified. One plausible site is neutron star mergers (NSMs), but from perspective of the Galactic chemical evolution, it has been pointed out that NSMs cannot reproduce the observed r-process abundance distribution of metal-poor stars at . Recently, Tsujimoto & Shigeyama (2014) pointed out that NSM ejecta can spread into much larger volume than ejecta from a supernova. We re-examine the enrichment of r-process elements by NSMs considering this difference in propagation using the chemical evolution model under the hierarchical galaxy formation. The observed r-process enhanced stars around are reproduced if the star formation efficiency is lower for low-mass galaxies under a realistic delay time distribution for NSMs. We show that a significant fraction of NSM ejecta escape from its host proto-galaxy to pollute intergalactic matter and other proto-galaxies. The propagation of r-process elements over proto-galaxies changes the abundance distribution at and obtains distribution compatible with observations of the Milky Way halo stars. In particular, the pre-enrichment of intergalactic medium explains the observed scarcity of EMP stars without Ba and abundance distribution of r-process elements at .
Subject headings:
stars: abundances – stars: Population II – nuclear reactions, nucleosynthesis, abundances – stars: neutron – early universe – Galaxy: evolution – Galaxy: halo1. Introduction
The rapid neutron capture process (r-process) is one of main processes to synthesize elements heavier than the iron group. The dominant r-process element source in the universe is still matter of debate. Two possible sites have been proposed; core-collapse supernovae (CCSNe, e.g., Sato 1974; Woosley & Hoffman 1992), and coalescence of binaries of double neutron star (NS-NS) and black hole-neutron star (BH-NS) systems (e.g., Lattimer & Schramm 1974; Rosswog et al. 1999). We refer to scenarios based on chemical evolution models of r-process elements exclusively supplied from binary neutron star mergers (NSMs) as the NSM scenarios in the following.
One promising way to understand the enrichment history of heavy elements in the universe is observations of extremely metal-poor (EMP) stars. These stars are the living fossils born in the early universe and can be probes for the Galactic chemical evolution. Europium (Eu) is commonly used as an element representative of r-process elements but we also discuss with barium (Ba) abundance as another representative element since it is more easily observed in EMP stars than Eu. Though Ba in the solar system is mainly produced by s-process in intermediate mass stars on the asymptotic giant branch (AGB), the contribution from s-process is thought to be negligible for EMP stars since their formation epoch is in prior to the period when the first intermediate mass stars in the universe evolve to AGB stars. We note that the measured abundance ratios between Eu and Ba in EMP stars are similar to the ratio of the r-process components of these elements in the solar system, except for carbon-enhanced EMP stars, of which the surface abundances have probably been changed by binary mass transfer.
It is known that the r-process abundances of EMP stars with show a very large star-to-star scatter of (e.g., Burris et al. 2000; Honda et al. 2004). The average abundance of Ba shows a decreasing trend as metallicity decreases in the metallicity range of , while it seems to reach a plateau at (Andrievsky et al. 2009). Based on this trend, Roederer (2013) and Komiya et al. (2014) pointed out that we can detect Ba on almost all the EMP stars.
It has been pointed out from the viewpoint of chemical evolution that r-process elements originating from neutron star mergers (NSMs) have difficulties in realizing the observed abundance features in EMP stars. Argast et al. (2004) argued that the model with NSM as the dominant r-process source predicts too large abundance scatter since NSMs have a very low event rate ( in the Milky Way (MW), Belczynski et al. 2002) and very large r-process yield (, e.g., Rosswog et al. 1999) per event. In addition, it has been argued that the long delay-time of NSM (yr) is incompatible with the presence of r-process enhanced stars at .
On the other hand, from other points of view, there is growing evidence that the NSMs are major r-process sources. Theoretical studies of nucleosynthesis in CCSNe show difficulties in synthesizing elements of the second and third r-process peaks, in the framework of neutrino driven explosion (e.g., Wanajo et al. 2011; Wanajo 2013), while these elements are successfully synthesized in the NSM ejecta (e.g., Bauswein et al. 2013; Wanajo et al. 2014). Observationally, a short gamma-ray burst GRB 130603B showed enhancement of infrared radiation in its afterglow (Tanvir et al. 2013; Berger et al. 2013). This event agrees with the predicted properties of a “kilonova”, radiation from matter heated by radioactive decay of r-process ejecta from a NSM (Tanaka & Hotokezaka 2013; Barnes & Kasen 2013). Hotokezaka et al. (2015) pointed out that the discrepancy in abundances of the radioactive r-process element 244Pu between the early solar system and the current solar vicinity may indicate a very low event rate for the r-process source. The discovery of an r-process rich ultra-faint dwarf galaxy (Ji et al. 2016; Roederer et al. 2016) also favors the r-process source with a large yield and rare event rate.
Recently, Tsujimoto & Shigeyama (2014) pointed out that the ejecta from a NSM can spread into very large volume since the NSM ejecta expand at very large velocities of of the speed of light (e.g., Goriely et al. 2011; Hotokezaka et al. 2013). The stopping length, , of 153Eu with speed of 0.2 is kpc, which can be larger than the radius of a dwarf spheroidal galaxy. (See Section 2.3.1 for the derivation of . Note that Tsujimoto & Shigeyama (2014) evaluate this value as , which is in error by a factor of 153.) We investigate effects of this large-scale spreading of the NSM ejecta on the Galactic chemical evolution.
Recent chemical evolution studies confirmed that the emergence of Eu around cannot be explained by the NSM scenario, unless binary NSs coalesce on very short timescales of 10 Myr or less (Matteucci et al. 2014; Cescutti et al. 2015; Wehmeyer et al. 2015), while both observations of binary pulsars (Lorimer 2008) and models of binary population synthesis (Dominik et al. 2012; Kinugawa et al. 2014) indicate average coalescence timescales beyond 100 Myr. In addition, even with the short delay time, the secondary r-process source such as CCSNe is invoked to reproduce the abundance distribution at (Cescutti et al. 2015; Wehmeyer et al. 2015). Ishimaru et al. (2015) show that the appearance of r-process elements at can be explained by the combination with the coalescence timescale of 100 Myr for the majority (95%) of NSMs and 1 Myr for the rest (5%), if the star formation efficiencies are lower for less-massive sub-halos. But they use a one-zone model and do not account for the scatter of . Hirai et al. (2015) follow the enrichment history of r-process elements by chemo-dynamical simulations but only for a dwarf galaxy. van de Voort et al. (2015) and Shen et al. (2015) compute the formation of the MW by chemo-dynamical simulations but their models lack the resolution to correctly follow the formation of Pop III and early Pop II stars. We note that the results of these simulation studies are dependent on assumptions about the sub-grid mixing process and numerical resolution.
All these previous studies do not take into account the difference of the propagation process between NSM ejecta and SN ejecta. In our previous study, we investigated the enrichment of r-process elements using a chemical evolution model with merging history of proto-galaxies, but without considering a difference in propagation (Komiya et al. 2014). We pointed out that the observed very low frequency of Ba lacking stars is in contradiction with the NSM scenario even when we assume a significant surface pollution. In this paper, we revisit this problem by considering the possibility that NSM ejecta can escape from its host proto-galaxy and pollute neighboring proto-galaxies and intergalactic medium (IGM).
2. Model description
We use the hierarchical chemical evolution model presented in Komiya et al. (2014, 2015). In the following, we give a brief summary of the model and changes from the previous works.
2.1. The hierarchical chemical evolution model
Our model treats individual metal poor stars in the framework of the hierarchical galaxy formation. This model also considers gas infall and outflow, metal pre-enrichment in IGM, and surface pollution of stars by accretion of interstellar matter (ISM).
2.1.1 Merger Tree
We build merger trees of dark-matter halos based on the extended Press-Schechter theory (Somerville & Kolatt 1999). The first stars are formed in halos with , where is the virial temperature, and corresponds to the halo mass of at a redshift of . We refer to the baryonic component in the branches of the merger tree as proto-galaxies, which are low-mass galaxies as building blocks of the Milky Way.
Each halo hosts one proto-galaxy at the beginning. We assume that when two dark halos merge, the proto-galaxy in the more massive halo is placed at the center of the newly formed halo and the proto-galaxy in the smaller halo becomes a satellite in a sub-halo and that the mass of the smaller halo remains unchanged. We neglect tidal stripping and ram pressure stripping. The orbital energy of the satellite decays through dynamical friction (Lacey & Cole 1993). The satellite merges with the central galaxy on the dynamical friction timescale, , given by the standard Chandrasekhar formula, and stars in the satellite are added to the stellar halo of the central galaxy (e.g., Cole et al. 2000).
2.1.2 Star Formation, Metal Enrichment and Gas Outflow
The star formation rate, , is expressed as the product of the gas mass, , and the star formation efficiency (SFE), . The masses of individual stars are set randomly following the initial mass function (IMF) described in section 2.1.3.
Metal yields of supernovae (SNe) are adopted from theoretical results of Kobayashi et al. (2006) for type II SNe and Nomoto et al. (1984) for type Ia SNe. We assume homogeneous mixing of metal in each proto-galaxy.
We consider gas outflow triggered by individual SNe. The first SN in a proto-galaxy form a galactic wind, and subsequent SNe add gas and energy to the wind. For the outflow energy, , we use the following formula as a function of the SN kinetic energy, , and the gas binding energy, , of a proto-galaxy,
| (1) |
which supposes that the outflow carries away all the SN kinetic energy if but a fraction, , of the kinetic energy turns to the outflow if . We compute inhomogeneous metal enrichment in the IGM by following the evolution of the winds from proto-galaxies assuming the momentum conserving snow-plow shell model.
In the fiducial model, we adopt the star formation efficiency depending on the mass of a halo, , motivated by the observational mass-metallicity relation, while a constant efficiency was adopted in our previous studies. The observed correlation between stellar masses, , and average metallicities, , of galaxies is expressed as (Kirby et al. 2013), and may indicate a lower star formation efficiency in a lower mass galaxy (Ishimaru et al. 2015). We use instead of to avoid at the beginning. Measurements of rotation curves of low mass star forming galaxies showed that the halo mass is almost proportional to the stellar mass (Miller et al. 2014) .
We also present results of the model with a constant SFE but with a higher outflow rate. We adopt in the constant SFE model rather than as the fiducial value in our previous study. This model yields a slope of mass-metallicity relation very similar to the fiducial model with and .
We evaluate the proportional constant of the SFE to yield the solar metallicity in the current MW, in the fiducial model and in the constant SFE model.
2.1.3 Initial Mass Function
For the initial mass function (IMF), , we use the log-normal function with a power-law tail at higher mass part as Chabrier (2003) adopted,
| (2) |
Chabrier (2003) yielded , , and for the Galactic spheroid. For EMP stars, however, we have shown that the low-mass peaked IMF obtains a much smaller frequency of carbon enhanced stars and more numerous EMP stars than observed by the HES survey (Komiya et al. 2009a, b, 2015). A high or intermediate-mass peaked IMF shows a better consistency with observations. Here, we compute models with the IMFs peaked at , and ( is also shifted in proportion to ). The binary fraction is set to be 0.5, and we adopt the flat mass ratio distribution. We note that the predicted r-process abundance distribution is not sensitive to the choice of the peak mass. ( In previous studies, we may have overestimated the volume observed by the HES survey due to the assumption of for giant stars and applying an incorrect limiting magnitude. The correction slightly lower the estimated value of but it still remains in the intermediate mass range. )
2.1.4 Surface Pollution of Stars
2.1.5 Enrichment History of Fe and Mg

The top panel of Figure 1 shows the metal enrichment history in our fiducial model. We plot of sampled proto-galaxies against redshift. Color denotes the gas mass of proto-galaxies. In our model, can decrease when a proto-galaxy merges with a more metal deficient proto-galaxy. Most of stars with are formed at , and stars with are formed at .
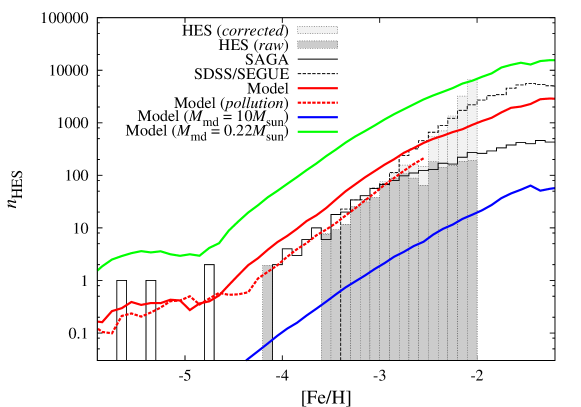
We show the resultant metallicity distribution functions (MDFs) in the bottom panel. The green, red, and blue lines show the predicted MDFs in the cases of , respectively. The solid and dashed red lines are the intrinsic metallicity and the surface metallicity after pollution, respectively. Shaded histograms show the raw (dark-shaded) and bias-corrected (light-shaded) MDFs of the HES sample (Schörck et al. 2009). We scale the predicted MDFs considering the field of view () and the magnitude limit () of the HES survey (Christlieb et al. 2008). Since most of the sample stars in Schörck et al. (2009) are around the base of the red giant branch, we count the predicted number of giant stars in the survey volume assuming that the typical luminosity is . We employ the de Vaucouleur density profile for the MW halo. We also show the MDF of the SDSS/SEGUE sample (Carollo et al. 2010, dashed black line) scaled to match the HES data and the MDF by the SAGA database (solid black line), which collects stellar abundances by high-resolution spectroscopy of metal-poor stars from literatures (Suda et al. 2008).
As seen in the bottom panel, though all the three IMFs lead to a similar form of the MDF, the IMF with solely reproduces the total number. The IMF with a higher produces a fewer number of low-mass stars which can survive to date, and at the same time form more numerous massive stars producing iron to shorten the timescale for low-metallicity star formation. We show results of the models with in section 3. The main results about r-process elements remain true for the other two . The MDF with slightly underestimates the number of stars at . It may be due to the change of the IMF to the low-mass peaked one (Suda et al. 2013; Yamada et al. 2013).
Our model obtains the abundance distribution of alpha elements consistent with observations. We present the correlation of the abundance ratios of magnesium to iron with metallicity in Figure 2, and oxygen and silicon shows the similar abundance distributions.

2.2. Neutron Star Merger
The mass range for progenitor stars of NSs is . We assume that of binary systems in this mass range form NS binaries which coalesce within the age of the universe. This yields one coalescing NS binary out of 1000 massive stars. We adopt the delay time distribution of the NSM,
| (3) |
for following results of binary population synthesis by Dominik et al. (2012). In this case, the averaged delay time is . The NSM event rate is proportional to the following integration,
| (4) |
The ejecta mass of a NSM is assumed to be , based on the estimation of ejecta mass of the observed kilonova candidate GRB 130603B (Tanvir et al. 2013; Berger et al. 2013). We assume the scaled solar r-process abundance pattern (Arlandini et al. 1999) for NSM ejecta. The elemental yields of Ba and Eu are and , respectively.
We do not distinguish NS-NS mergers and BH-NS mergers in our computation, while recent numerical studies show that a BH-NS merger can eject lager mass than a NS-NS merger (Hotokezaka et al. 2013). In this paper, we do not consider other heavy element sources such as s-process in intermediate massive stars or r-process in SNe II.
2.3. Propagation of NSM ejecta
A significant fraction of the NSM ejecta can escape from proto-galaxies. Nearby proto-galaxies can capture the escaped r-process elements. The rest of r-process ejecta travel away into the intergalactic space with high velocities. The r-process elements cool and are coupled with IGM, and are incorporated into galaxies along gas infall as described in the following.
2.3.1 Escape from a Proto-Galaxy
R-process elements from a NSM propagate until they lose kinetic energies by interaction with ISM. The dominant energy deposition process is the ionization of neutral hydrogen in HI gas, and the Coulomb scattering in the ionized gas. The energy loss rate is
| (5) | |||||
in the neutral gas and
| (6) |
in the ionized plasma (Schlickeiser 2002), where and is the number density of neutral hydrogen and free electron, respectively, is the velocity in units of the speed of light and set at in this study, and is the atomic number. The stopping length,
| (7) |
for in the neutral gas, where is the proton mass, is the mass number, and is the Lorentz factor.
We assume that r-process elements ejected from an NSM travel the stopping length of on a straight line at a constant velocity. The ejected particles stop rather suddenly once they travels the stopping length since the energy loss rate increases as the energy decreases. The fraction, , of NSM ejecta escaping from the proto-galaxy is estimated as
| (8) |
where is the radius of the host proto-galaxy. For simplicity, we assume that a proto-galaxy is a homogeneous sphere of neutral gas, and an NSM takes place at the center of the proto-galaxy.
We give the gas density and radius of proto-galaxies assuming isobaric cooling of the virialized gas (Komiya et al. 2015), i.e., , and , where is the averaged density of the virialized dark-matter halos as a function of redshift, is the mean molecular weight, is the virial radius of the host halo. Gas can be cooled to K in the MW but K in the primordial mini-halo, and K in relic HII regions without metal. The gas temperature, , is set at the maximum of the temperature of the cosmic microwave background or . These assumptions yield and pc for the primordial proto-galaxy with at , and and kpc for the current MW ().
2.3.2 Capture by Other Proto-galaxies
In this study, we assume isotropic mass ejection from a NSM (Hotokezaka et al. 2013). The fraction of escaped NSM ejecta encountering with a proto-galaxy with radius is , where is the distance to the proto-galaxy.
For a particle which runs into a spherical proto-galaxy with an impact parameter of , the length of the pass crossing the proto-galaxy is . Under the same assumptions as in eq. (8), the fraction of particles that are not captured by the proto-galaxy is . The fraction of captured high-energy r-process elements out of all particles encountering the proto-galaxy is
| (9) | |||||
We mention that, in the limit of , the capture rate approaches to and the total amount of captured particles is proportional to since (eq. 7), i.e., the capture rate is simply proportional to the gas mass but independent of radius and density.
We estimate the distance between the -th and the -th proto-galaxies using the following equation,
| (10a) | |||||
| (10b) | |||||
| (10c) | |||||
| (two satellites). |
In the case of two proto-galaxies in different dark halos (eq. 10a), we estimate the distance between them under the spherical collapse approximation of halos following Komiya et al. (2016). Here two halos are supposed to merge at time to become a single halo with the mass of , and is the distance between the two halos (see section 4.1 in Komiya et al. (2016) for details). After the two dark halos merge (eq. 10b), the proto-galaxy in the more massive halo (labeled ) is placed at the center of the merged halo and the other one (labeled ) becomes a satellite. The satellite galaxy is assumed to approach the center as the distance, , from the center linearly decreases as a function of time. is the merger timescale by the dynamical friction and we use the formula given in Cole et al. (2000). At , the satellite merges to the central galaxy. In the case of two satellites in the same dark halo (eq. 10c), we estimate the distance assuming the random distribution for the orbital angles, , between the satellite galaxies.
2.3.3 In the Intergalactic Space
The energy loss timescale, , of 153Eu propagating in the IGM is given as
| (11) |
where we use the energy loss rate for neutral gas (eq. 5) before reionization and one for ionized gas (eq. 6) after that. We assume the reionization redshift . Since the stopping length in the IGM, , is larger than the computation box, we assume homogeneous mixing of the escaped r-process elements in the intergalactic space, while we follow the inhomogeneous metal pollution of the IGM for elements provided by SNe as mentioned above.
R-process elements having escaped from the host galaxy lose their kinetic energies on the timescale of unless they are captured by another proto-galaxy. Such r-process elements are eventually settled in the IGM and some of them are attracted by the gravity of proto-galaxies and accreted onto them along with gas infall.
We can describe the evolution of mass of the high-energy particle in the intergalactic space and the abundance, , of element in the IGM as follows,
| (12) |
| (13) |
where is the elemental yields from one NSM event, is the time when the -th NSM event takes place in the -th proto-galaxy. The second term in the right hand side of eq. (2.3.3) describes capture of particles incoming from outside of the computation box, and is the volume of the box, which is a comoving sphere enclosing the total mass of . is the gas accretion rate onto the -th proto-galaxy.
Here, we assume that the escaping of the high energy r-process elements from the simulation box balances the incoming from galaxies outside the box. We discuss the validity of this assumption in Appendix.
2.3.4 Evolution of the R-process Abundances
In summary, evolution of r-process abundances of a proto-galaxy is described as follows,
| (14) |
where the first term on the right-hand side is the contribution from NSMs in the proto-galaxy, the second term is the increment by capturing ejecta from NSM events in other proto-galaxies in the simulation box, the third term is high-energy r-process background from galaxies outside the computation box, and the fourth term is the infall of IGM.
3. Results and Discussion
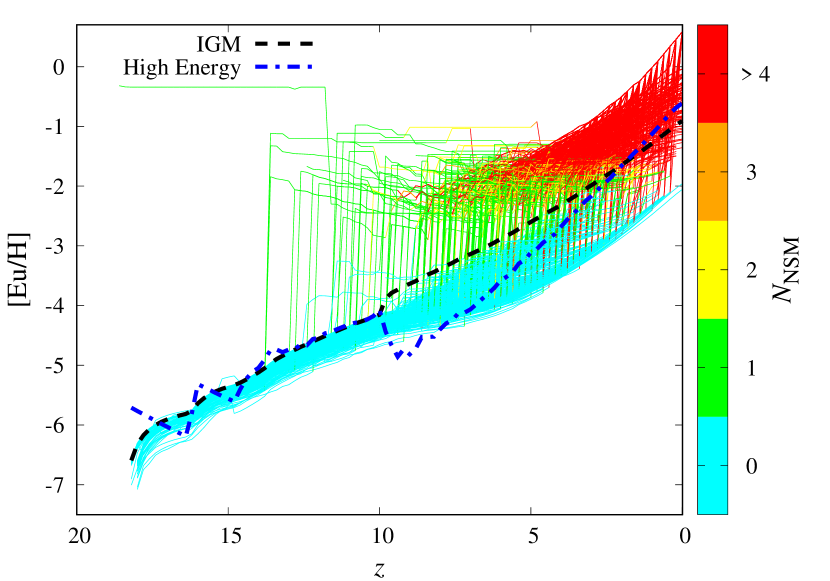
Figure 3 shows the enrichment history of Eu abundances for sampled proto-galaxies and the IGM (dashed black line). The number of NSM events in each proto-galaxy is color coded. The dash-dotted blue line denotes the abundance of high energy r-process elements in intergalactic space, .
The first NSM in this computation run takes place at . Most of the r-process ejecta escape from its host proto-galaxy to enhance to
| (15) |
where is the solar Eu abundance (Grevesse et al. 1996), and and are densities of matter and baryon relative to the critical density, respectively. In the limit of , the capture rate of high energy r-process particles is proportional to the total gas mass and independent of the density as mentioned, i.e., the capture rate per unit mass is almost the same for all proto-galaxies with and for the IGM. [Eu/H] of the IGM (black line) and proto-galaxies (cyan lines) increase in a similar way by capturing high-energy r-process elements at . At such a high redshift, majority of baryon is still in the IGM, and most of the escaped NSM ejecta are mixed with the IGM on the timescale of .
At , suddenly decreases because the energy loss rate in the IGM increases due to cosmic reionization. The capture rate per unit mass by the ionized IGM becomes several tens of times higher than the one by neutral proto-galaxies. Therefore, the abundance of proto-galaxies without NSM events (cyan lines) is dex or more smaller than the IGM abundance at . After the reionization, pre-enrichment of IGM is mainly responsible for the Eu abundance of proto-galaxies without NSM events. At , overwhelms because the energy loss timescale in the IGM increases as the IGM density decreases.
A single NSM event enriches its host proto-galaxy with r-process elements to
| (16) | |||||
in the limit of (). When we adopt assumptions for and in section 2.3.1, we can describe this equation as a function of and the cosmological parameters as follows,
| (17) |
where is the overdensity of the virialized halo relative to the critical density, and is the dimensionless Hubble parameter. These proto-galaxies become much more r-process rich than the intergalactic space, and the contribution from other proto-galaxies is negligible for them. At , the most massive photo-galaxy shows the highest r-process abundance because of a large event rate and a small escape probability.
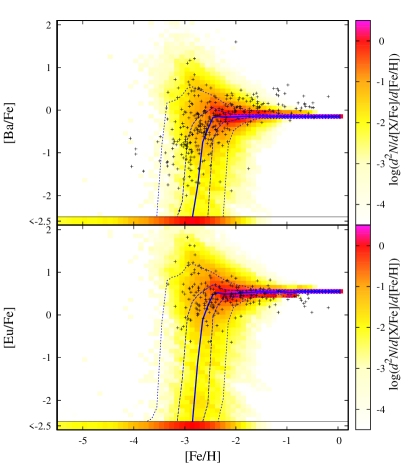
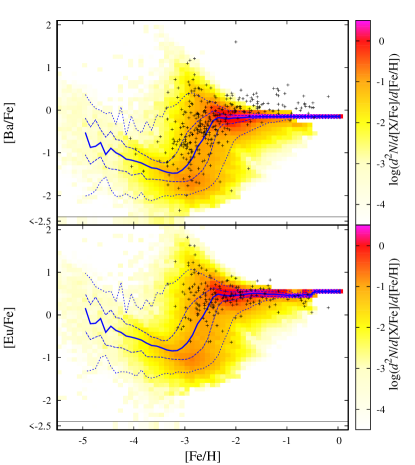

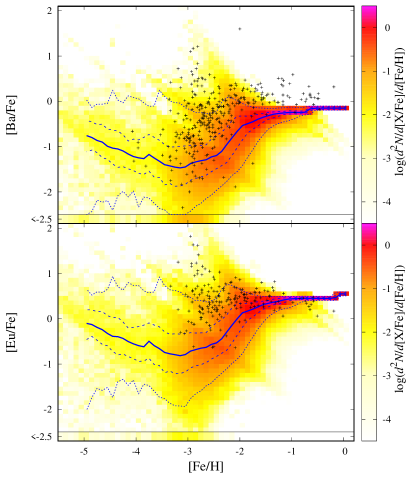
Figures 4 and 5 show the r-process abundance of stars against metallicity for the fiducial model and the constant SFE model, respectively. The left and right panels denote results without escape of NSM ejecta () and with escape, respectively.
The constant SFE significantly delays the enrichment of r-process elements compared to iron and the predicted abundances of EMP stars do not match observational results, as mentioned in previous chemical evolution studies. The predicted abundances of r-process elements are significantly lower than observations at , and r-II stars with around is not reproduced. On the other hand, if the SFE is lower at lower mass proto-galaxies, r-process elements emerge at , even with the long average delay time ( yr). This is because that enrichment timescale of iron is longer for low-mass proto-galaxies in which EMP stars were formed and some NSMs can take place within the formation epoch of EMP stars. These are consistent with the result of the one zone model by Ishimaru et al. (2015).
When we do not consider the escape of NSM ejecta from the host proto-galaxies, however, the majority of stars with show very low r-process abundances with [Ba/Fe] , which is apparently at odds with observations (see the top left panel of Fig. 3). On the other hand, our escape model predicts or for the majority of stars at , and well reproduces observations of halo stars, as shown in the right top panel.
Proto-galaxies lacking NSM events are polluted by r-process elements ejected from NSMs in other proto-galaxies. As mentioned, IGM pre-enrichment is mostly responsible for the r-process elements in these stars, and capture of high-energy r-process elements also contribute at . Stars in proto-galaxies without a NSM are distributed at . NSM events of short delay time, , are the dominant sources of r-process elements for these stars. On the other hand, proto-galaxies in which NSM events take place form stars with .
Surface pollution can play an important role for stars in proto-galaxies without a NSM. Without surface pollution, there emerges a depression in the number density of stars at in the range of where the first NSM occurs. The surface pollution alleviates the gap. In the model with , the surfaces of most EMP stars have a tiny amount of Ba such as even after surface pollution.
At , the r-process abundance is averaged. The predicted Ba abundance is lower than observations since we neglect the s-process contribution.
At , while we can see a clear decreasing trend of as metallicity increases, we do not see a similar “knee” in the predicted r-process abundance distributions. This is because the increase of the NSM rate due to the long delay time compensates the increasing production rate of iron enhanced by SNe Ia. One possible explanation for the observed depression of is a lower frequency of NSMs with high metallicity progenitor stars, although we assume constant frequency in the computation for simplicity.

The event rate of NSMs in this model is in the current MW, as shown in Figure 6. It is also slightly higher than the estimation based on the observations of binary pulsars in the MW (, Kim et al. 2015). Both the binary pulsars and the abundances of the metal rich stars indicate a factor of smaller NSM fraction than used in this paper at . At the right axis of Figure 6, the event rate in the MW is converted into the expected detection rate of the gravitational waves (GWs) by the advanced LIGO-Virgo network. Ongoing observations of GWs will provide better constraints on the NSM rate.
For the metallicity dependence of the NSM rate, studies of binary population synthesis predict a lower NS-NS merger rate for lower metallicity stars (Dominik et al. 2012; Kinugawa et al. 2014). For the BH-NS merger rate, on the other hand, Dominik et al. (2012) predict that a rate for stars with the metallicity of is higher than the Population I (Pop I) stars while Kinugawa et al. (2014) predict that a rate for Pop III stars is lower than that for Pop I stars. Further studies are required for the event rate, delay time distribution, and r-process yield of NSMs, and their metallicity dependences.
In this paper, we assume that high-energy r-process elements go straight until they lose energies by interaction with gas particles. If proto-galaxies have magnetic field, however, particles can travel along a winding path, which decreases the escape probability and increases the capture rate. On the other hand, the escape probability can be higher in a disk-like gas density profile than in a gas sphere assumed in this work. In addition, NSM events at the outer region of a proto-galaxy will effectively transfer r-process elements into intergalactic space, although we only consider NSM events at the center of proto-galaxies. Furthermore, a NS binary itself can go away from a proto-galaxy if it can get enough velocity from SN explosions. The velocity of a NS binary is depending on its binary orbit and SN kick. Although we still have no reliable estimation for the velocity distribution of NS binaries, two observed binary pulsars show a proper motion of more than km/s (Beniamini & Piran 2016), which exceeds the typical escape velocity of a proto-galaxy hosting EMP stars. The IGM pre-enrichment and transfer of r-process elements between proto-galaxies are depending on these details, but a model taking them into account is beyond the scope of this paper.
4. Summary
Coalescence of NS binaries is one of the most plausible sites for r-process nucleosynthesis but results of previous chemical evolution models with NSMs as major r-process sources is inconsistent with the observed r-process abundances of metal-poor stars. We revisit the Galactic chemical evolution of r-process elements following the NSM scenario.
The novelty of this paper is in considering the effect of propagation of NSM ejecta across proto-galaxies. As pointed out by Tsujimoto & Shigeyama (2014), r-process elements from NSMs have very large stopping lengths due to their high velocities. We compute the escape of r-process elements from proto-galaxies, pre-enrichment of IGM, and capture of the escaped elements by other proto-galaxies in the chemical evolution model based on the framework of the hierarchical galaxy formation.
We have confirmed that the NSM scenario can reproduce the emergence of r-process elements at in the case of lower SFE for less massive proto-galaxies, while the constant SFE delays the enrichment of r-process elements, which results in abundance correlations incompatible with observations.
While previous chemical evolution models with the NSM scenario predict many stars lacking r-process elements at very low metallicities, our model with the long-distance propagation of NSM ejecta predicts for stars formed in proto-galaxies without a NSM. Our model succeeds in reproducing the r-process abundance distribution of EMP stars. This result indicates that the NSM scenario is not rejected by the Galactic chemical evolution, when we consider the propagation of NSM ejecta beyond the proto-galaxies.
Our current model predicts a slightly higher event rate of NSMs and results in higher than observations in the current MW while the good consistency with observations at very low metallicity. It may indicate the metallicity dependence of the NSM rate. Future observations of GWs and their electromagnetic counterparts will give us information about the NSM rate and its contribution to the Galactic chemical evolution.
Appendix A Boundary Condition
We adopt a periodic boundary condition which assumes that the high energy r-process elements incoming from outside the simulation box balance the elements escaping from the box. This seems to be a reasonable assumption at very high redshift since large scale density fluctuation tends to grow at low redshift. For example, at , only fluctuation of collapses, and the box size is much larger. On the other hand, it is not a good approximation at low redshift since the environment around the current MW is significantly different from the average of the universe.
In the current universe, there are MW equivalent galaxies (MWEGs) on average (Abadie et al. 2010), but the number density in our computation box corresponds to (). It may indicate that the production rate of high energy r-process elements (the first term of eq. 2.3.3) may be overestimated by factor at . The capture rate by proto-galaxies (the second term of eq. 2.3.3) may also be overestimated since the capture rate in this computation box is dominated by the MW at low redshift. In order to mimic this difference, we compute the chemical evolution model with replacing the eq. (2.3.3) to the following equation,
| (A1) |
where is the relative number density of MWEGs.

Figure 7 show the result. The predicted abundance distribution is indistinguishable from the fiducial model at high metallicity or high r-process abundance (). This is because r-process elements of proto-galaxies in which these stars are formed are dominated by their own NSMs. On the other hand, the abundance of proto-galaxies without NSM events decreases since the r-process element abundances of the IGM decrease. The abundance of EMP stars at formed before the first NSM in their host proto-galaxies decreases by dex. We note that the difference can be overestimated at low metallicity since the region around the MW should be more similar to the average of the universe at high redshift.
References
- Abadie et al. (2010) Abadie, J., Abbott, B. P., Abbott, R., et al., 2010, CQGra, 27, 3001
- Andrievsky et al. (2009) Andrievsky, S. M., Spite, M., Korotin, S. A., 2009, A&A, 494, 1083
- Arlandini et al. (1999) Arlandini, C., Kappeler, F., Wisshak, K., Gallino, R., Lugaro, M., Busso, M., & Straniero, O. 1999, ApJ, 525, 886
- Argast et al. (2004) Argast, D., Samland, M, Thielemann, F.-K., & Qian, Y.-Z. 2004, A&A, 416, 997
- Bauswein et al. (2013) Bauswein, A., Goriely, S., & Janka, H.-T., 2013, ApJ, 773, 78
- Barnes & Kasen (2013) Barnes, J., & Kasen, D., 2013, ApJ, 775, 18
- Beniamini & Piran (2016) Beniamini, P., & Piran, T. 2016, MNRAS, 456, 4089
- Belczynski et al. (2002) Belczynski, K., Kalogera, V., & Bulik, T. 2002, ApJ, 572, 407
- Berger et al. (2013) Berger, E., Fong, W., Chornock, R. 2013, ApJ, 774, L23
- Burris et al. (2000) Burris, D. L., Pilachowski, C. A., Armandroff, T. E., Sneden, C., Cowan, J. J., & Roe, H. 2000, ApJ, 544, 302
- Carollo et al. (2010) Carollo, D., Beers, T. C., Chiba, M., et al. 2010, ApJ, 712, 692
- Cescutti et al. (2015) Cescutti, G., Romano, D., Matteucci, F., Chiappini, C., & Hirschi, R. 2015, A&A, 577, 139
- Chabrier (2003) Chabrier, G. 2003, PASP, 115, 763
- Christlieb et al. (2008) Christlieb, N., Schörck, T., Frebel, A., et al. 2008, A&A, 484, 721
- Cole et al. (2000) Cole, S., Lacey, C. G., Baugh, C. M., & Frenk, C. S. ApJ, 319, 1
- Dominik et al. (2012) Dominik, M., Belczynski, K., Fryer, C., et al. 2012, ApJ, 759, 52
- Goriely et al. (2011) Goriely, S., Bauswein, A., & Janka, H.-T. 2011, ApJ, 738, L32
- Grevesse et al. (1996) Grevesse, N., Noels, A., & Sauval, A. J. 1996, ASPC, 99, 117
- Hirai et al. (2015) Hirai, Y., Ishimaru, Y., Saitoh, T. R., Fujii, M. S., Hidaka, J., & Kajino, T. 2015, ApJ, 814, 41
- Honda et al. (2004) Honda, S., Aoki, W., Kajino, T., Ando, H., Beers, T. C., Izumiura, H., Sadakane, K., Takada-Hida, M. 2004, ApJ, 607, 474
- Hotokezaka et al. (2013) Hotokezaka, K., Kiuchi, K., Kyutoku, K., et al. 2013, PhRvD, 87, 4001
- Hotokezaka et al. (2013b) Hotokezaka, K., Kyutoku, K., Tanaka, M., et al. 2013, ApJ, 778, L16
- Hotokezaka et al. (2015) Hotokezaka, K., Piran, T., & Paul, M. NatPh, 11, 1042
- Lacey & Cole (1993) Lacey, C., & Cole, S. 1993, MNRAS, 262, 627
- Ishimaru et al. (2015) Ishimaru, Y., Wanajo, S., & Prantzos, N., 2015, ApJ, 804, L35
- Ji et al. (2016) Ji, A. P., Frebel, A., Chiti, A., & Simon, J. D. , Nature, 531, 610
- Kim et al. (2015) Kim, C., Perera, B. B. P., McLaughlin, M. A., 2015, MNRAS, 448, 928
- Kinugawa et al. (2014) Kinugawa, T., Inayoshi, K., Hotokezaka, K., et al. 2014, MNRAS, 442, 2963
- Kirby et al. (2013) Kirby, E. N., Cohen, J. G., Guhathakurta, P., Cheng, L., Bullock, J. S., & Gallazzi, A. 2013, ApJ, 779, 102
- Kobayashi et al. (2006) Kobayashi, C., Umeda, H., Nomoto, K., Tominaga, N., & Ohkubo, T. 2006, ApJ, 653, 1145
- Komiya et al. (2009b) Komiya, Y., Habe, A., Suda, T., & Fujimoto, Y. M. 2009, ApJ, 696L, 79
- Komiya et al. (2009a) Komiya, Y., Suda, T., & Fujimoto, Y. M. 2009, ApJ, 694, 1577
- Komiya et al. (2014) Komiya, Y., Yamada, S., Suda, T., & Fujimoto, M. Y. 2014, ApJ, 783, 132
- Komiya et al. (2015) Komiya, Y., Suda, T., & Fujimoto, Y. M. 2015, ApJ, 808, L47
- Komiya et al. (2016) Komiya, Y., Suda, T., & Fujimoto, Y. M. 2015, ApJ, accepted.
- Lattimer & Schramm (1974) Lattimer, J. M., & Schramm, D. N., 1974, ApJ, 192, 145
- Lorimer (2008) Lorimer, D. R. 2008, LLR, 11, 8
- Matteucci et al. (2014) Matteucci, F., Romano, D., Arcones, A., Korobkin, O., & Rosswog, S. 2014, MNRAS, 438, 2177
- Miller et al. (2014) Miller, S. H., Ellis, R. S., Newman, A. B., & Benson, A. 2014, ApJ, 782, 115
- Nomoto et al. (1984) Nomoto, K., Thielemann, F.-K., Yokoi, K. 1984, ApJ, 286, 644
- Roederer (2013) Roederer, I. U. 2013, AJ, 145, 26
- Roederer et al. (2016) Roederer, I. U., Karakas, A. I., Pignatari, & Herwig, F., 2016, AJ, 821, 37
- Rosswog et al. (1999) Rosswog, S., Liebendörfer, M., Thielemann, F.-K., Davies, M. B., Benz, W., & Piran, T. 1999, A&A, 341, 499
- Sato (1974) Sato, K., 1974, PThPh, 51, 726
- Schlickeiser (2002) Schlickeiser, R. 2002, Cosmic ray astrophysics (Berlin: Springer)
- Schörck et al. (2009) Schörck, T., Christlieb, N., et al. 2009, A&A, 507, 817
- Shen et al. (2015) Shen, S., Cooke, R. J., Ramirez-Ruiz, E., Madau, P., Mayer, L., Guedes, J. 2015, ApJ, 807, 115
- Somerville & Kolatt (1999) Somerville, R. S., & Kolatt, T. S. 1999, MNRAS, 305, 1
- Suda et al. (2008) Suda, T., et al. 2008, PASJ, 60, 1159
- Suda et al. (2013) Suda, T., et al. 2013, MNRAS, 432, L46
- Tanaka & Hotokezaka (2013) Tanaka, M., & Hotokezaka, K., ApJ, 775, 113
- Tanvir et al. (2013) Tanvir, N. R., Levan, A. J., Fruchter, A. S., et al. 2013, Nature, 500, 547
- Tsujimoto & Shigeyama (2014) Tsujimoto, T., & Shigeyama, T. 1999, ApJ, 565, L5
- van de Voort et al. (2015) van de Voort,F., Quataert, E., Hopkins, P. F., Keres, D., & Faucher-Gigure, C-A., 2015, MNRAS, 447, 140
- Wanajo (2013) Wanajo, S., 2013, ApJ, 770, L22
- Wanajo et al. (2014) Wanajo, S., Sekiguchi, Y., Nishimura, N., et al. 2014, ApJ, 789, L39
- Wanajo et al. (2011) Wanajo, S., Janka, H-T., & Müller, B. 2011, ApJ, 726, L15
- Wehmeyer et al. (2015) Wehmeyer, B., Pignatari, M., & Thielemann, F.-K., 2015, MNRAS, 452, 1970
- Woosley & Hoffman (1992) Woosley, S. E. & Hoffman, R. D. 1992, ApJ, 395, 202
- Yamada et al. (2013) Yamada, S., Suda, T., Komiya, Y., Aoki, W., & Fujimoto, M. Y., MNRAS, 436, 1362