Absorption of Very High Energy Gamma Rays in the Milky Way
Abstract
Galactic gamma ray astronomy at very high energy ( TeV) is a vital tool in the study of the nonthermal universe. The interpretation of the observations in this energy region requires the precise modeling of the attenuation of photons due to pair production interactions () where the targets are the radiation fields present in interstellar space. For gamma rays with energy TeV the attenuation is mostly due to the photons of the cosmic microwave background radiation. At lower energy the most important targets are infrared photons with wavelengths in the range –500 m emitted by dust. The evaluation of the attenuation requires a good knowledge of the density, and energy and angular distributions of the target photons for all positions in the Galaxy. In this work we discuss a simple model for the infrared radiation that depends on only few parameters associated to the space and temperature distributions of the emitting dust. The model allows to compute with good accuracy the effects of absorption for any space and energy distribution of the diffuse Galactic gamma ray emission. The absorption probability due to the Galactic infrared radiation is maximum for TeV, and can be as large as for distant sources on lines of sight that pass close to the Galactic center. The systematic uncertainties on the absorption probability are estimated as .
pacs:
98.38Cp,98.70Rz,95.85PwI Introduction
The past two–three decades have seen the remarkable development of high energy gamma ray astronomy with important results obtained by telescopes, in space and at ground level, observing in the energy range from 1 MeV to almost 100 TeV Hinton:2009zz ; Funk:2015anl . The astrophysical photon fluxes fall rapidly with energy, and only few photons have been detected with TeV. On the other hand the exploration of the gamma ray sky in the region – TeV is a natural and important extension for high energy astrophysics studies, with clear and strong scientific interest.
A new generation of ground–based gamma ray telescopes, such as the Cherenkov Telescope Array (CTA) cta , the extensive air shower array LHAASO lhaaso and the nonimaging Cherenkov detector HiSCORE hiscore will soon begin to explore the energy range beyond 100 TeV. These instruments will extend the measured spectra of known gamma ray emitters, and have the potential to discover new classes of sources. Besides the studies of pointlike and quasi–point–like sources, future detectors with a large field of view (as LHAASO and HiSCORE) will have the potential to measure diffuse gamma ray fluxes, such as those produced by the interactions of Galactic cosmic rays in interstellar space, or generated by an ensemble of unresolved weak sources, or perhaps, more speculatively, by the decay of Dark Matter particles in our Galaxy. Of particular interest is the search for gamma ray counterparts to the astrophysical neutrino signal recently observed by IceCube in the range –2000 TeV icecube1 ; icecube2 .
Gamma rays in the energy range we are discussing ( TeV) suffer non–negligible absorption during their propagation from the emission point to the Earth. The mechanism that generates the absorption is the creation of electron–positron pairs in photon–photon interactions (), where the target is provided by the radiation fields present in interstellar and intergalactic space. Additional absorption can also occur in the source itself and/or in the circum–source environment.
The largest source of target photons is the cosmic microwave background radiation (CMBR) with a homogeneous number density of approximately 410 cm-3. The extragalactic background light (EBL), generated by the emission of all radiation sources in the universe, also fills uniformly space with an average density of approximately 1.5 cm-3 of higher energy photons. Absorption by the CMBR and EBL essentially precludes extragalactic gamma astronomy above 30 TeV, on the other hand Galactic astronomy remains possible, but the interpretation of the observations requires taking into account the effects of photon absorption.
The main source of target photons for the propagation of gamma rays in the Galaxy (together with the accurately known CMBR) is the infrared emission of dust, heated by stellar light. The radiation field generated by the dust emission has nontrivial energy, space and angular distributions that must be carefully modeled to compute the absorption effects. Starlight photons have a smaller number density and their effects on gamma ray absorption are in good approximation negligible.
The calculation of the interstellar radiation field (ISRF) is a difficult tasks that requires: (a) the description of the spatial distribution of stars (for all spectral types) in the different Galactic structures (disk, halo, spiral arms, bar and bulge), (b) the description of the space distribution and properties (composition, shape and dimensions of the grains) of interstellar dust, and finally (c) the modeling of the physical processes (scattering, emission and absorption) that occur in the interactions between radiation of different wavelength and the dust.
A detailed model of the ISRF, constructed following the points listed above has been constructed by Strong, Moskalenko and Reimer strong2000 . The model was later revised by Porter and Strong porter2005 , and used to evaluate the gamma ray absorption in the Galaxy by Zhang et al. zhang2006 . More recently Moskalenko, Porter and Strong (hereafter MPS) moska2006 , have presented a new more precise calculation of the ISRF and of gamma ray attenuation in the Galaxy.
The numerical code for the propagation of relativistic particles in the Milky Way GALPROP galprop ; Strong:2007nh ; Grenier:2015egx also implements the model of the ISRF of porter2005 . The publicly available version of the GALPROP code has been recently used by Esmaili and Serpico (hereafter ES) esma2015 to obtain the radiation density in different points of the Galaxy, and the results have been used to evaluate the absorption of high energy Galactic gamma rays (with the approximation of an isotropic angular distribution of the target photons). The work of Esmaili and Serpico discusses a particular model for the emission of high energy gamma rays in the Galaxy (the decay of a very massive particle that forms the galactic matter).
In this paper we perform an independent evaluation of the absorption probability for gamma rays propagating in the Galaxy. The crucial element in the calculation is the estimate of the Galactic dust emission, which is performed following the work of Misiriotis et al. misi2006 , who have constructed an emission model that depends on only few parameters, associated to the space and temperature distributions of the interstellar dust. This dust emission model can describe well the main features of the spectral data of COBE–FIRAS Wright:1991zz ; Reach:1995fy ; firas1999 and the sky maps of COBE–DIRBE Arendt:1998aj . Our approach allows to compute rapidly and with good accuracy the effects of absorption for any space distribution of the high energy gamma ray emission.
This work is organized as follows: in the next section we describe the mechanism of gamma ray absorption, and discuss the order of magnitude of the effect. In Sec. III we outline our model for the interstellar radiation fields in the Galaxy. In Sec. IV we use the results to compute the absorption probability for gamma rays propagating in the Galaxy. Finally, in the last section we summarize and discuss the accuracy and the limits of our calculation.
II Attenuation of gamma rays
II.1 Pair production cross section
Given a gamma ray of energy and a target photon of energy , the cross section for pair production can be expressed as a function of the adimensional variable , where is the square of the center of mass energy, is the electron mass, and is the angle between the directions of the interacting photons. The velocity of the in the center of mass frame is and the cross section can be written as a function of as
| (1) |
where is the Thomson cross section.
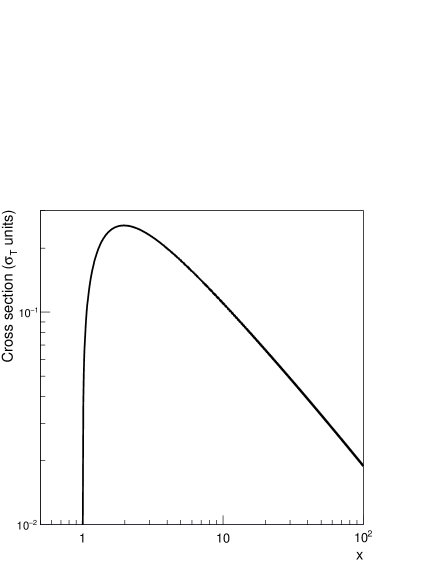
Figure 1 shows as a function of . The cross section vanishes below the threshold that corresponds to the center of mass energy . Above threshold the cross section increases very rapidly reaching a maximum at ( cm2). Increasing the cross section decreases monotonically, and for large it takes the asymptotic behavior (or more exactly ).
From the shape of the energy dependence of it follows that target photons of a given energy are important for the absorption of gamma rays in a relatively narrow range of energy around . For a fixed value of the gamma ray energy threshold for pair production is
| (2) |
where is the target photon energy in electronvolts. Increasing (for a fixed ) the cross section grows rapidly reaching the maximum value for , it is reduced to half the maximum value at energy and then decreases approximately .
The absorption probability per unit path length (or absorption coefficient) for a gamma ray of energy and direction at the space point can be calculated integrating the interaction probability over the energy and angular distributions of the target photons:
| (3) | |||||
In this equation is the number density of photons of energy and direction at the point , and the integration is extended to all energies and the entire solid angle. The factor accounts for the relative velocity of the interacting particles.
The survival (absorption) probability for photons of energy traveling between points and can be written as
| (4) | |||||
and the optical depth can be calculated integrating the absorption coefficient along the trajectory:
| (5) |
where is the versor parallel to . For the simple case where the target radiation field is homogeneous and isotropic, the absorption coefficient is independent from the position and direction of the gamma ray, and increases linearly with distance: .
According to equation (3), the calculation of the survival probability requires the knowledge of the number density, energy spectrum and angular distribution of the target photons at all points on the gamma ray trajectory.
II.2 Radiation fields in the solar neighborhood
The radiation field in our Galaxy can be decomposed as the sum of four components:
| (6) |
The first two terms in this equation describe extragalactic components that permeate uniformly the Galaxy and the entire universe and have to very good approximation an isotropic angular distribution. The cosmic microwave background radiation (CMBR) is the well–known relic of the Big Bang, while the extragalactic background light (EBL) has been formed by the emission of all extragalactic sources during the history of the universe. The other two terms in Eq. (6) are of Galactic origin and describe the radiation emitted by stars and by dust (heated by starlight). Both Galactic components have nontrivial space and angular distributions, the densities are larger near the Galactic center (GC) and close to the Galactic plane, and the photon angular distributions trace the shape of the Galactic disk.
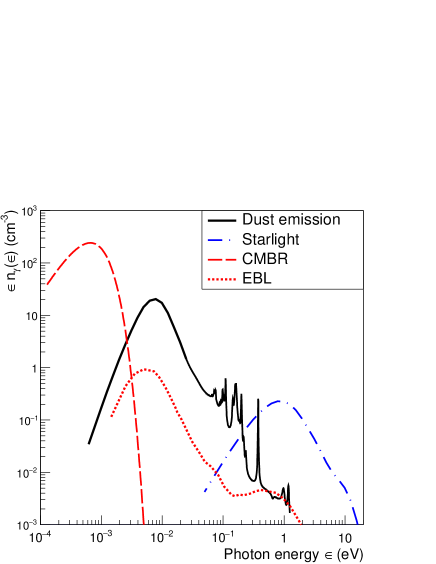
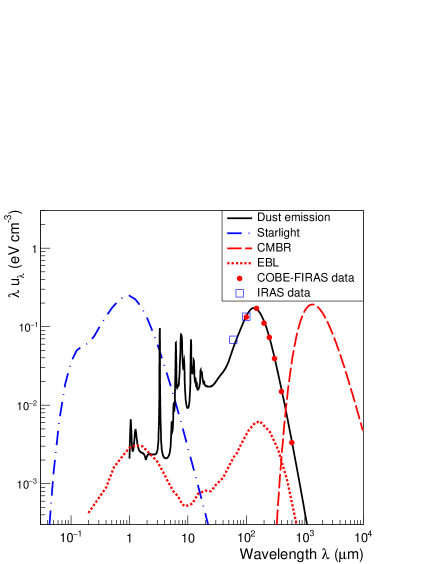
The spectrum of the radiation in the solar neighborhood and the contribution of the different components is shown in Figs. 2 and 3. In Fig. 2 the spectrum is shown as the angle integrated number density of photons versus the photon energy . In Fig. 3 the same spectrum is shown in the form of the energy density versus the wavelength . Inspecting the figures one can see that three radiation components (CMBR, dust emission and starlight) have spectra with similar shape but maxima in different energy (wavelength) ranges and different normalizations. The fourth component (the EBL) has a shape similar to the sum of the Galactic star and dust emission, reflecting the fact that it is formed by the emission of all galaxies in the universe.
The largest component (in terms of number of photons per unit volume) of the target radiation field is the CMBR that, in a very good approximation, is a blackbody spectrum of temperature Kelvin Fixsen:2009ug . This corresponds to a photon density of 410.7 cm-3 with isotropic angular distribution and average photon energy
| (7) |
( is the Boltzmann constant and is the Riemann Zeta function).
The second component in order of importance is the radiation emitted by Galactic interstellar dust heated by stellar light. This emission has been the object of several studies and reviews Draine:2003if ; draine_li ; Compiegne:2010na . Most of the energy radiated by dust is emitted in the far infrared to millimeter range of wavelength by the largest grains that in good approximation are in thermal equilibrium with the local radiation field. Accordingly the wavelength distribution of the emission (for a uniform population of grains) is well described by a modified blackbody spectrum:
| (8) |
In this equation is the power emitted per unit volume, unit solid angle and unit wavelength by the dust, is the mass density of the dust,
| (9) |
is the Planck function for temperature , and is the wavelength dependent dust emissivity cross section per unit mass that modifies the blackbody shape of the emission. Empirically the emissivity cross section has often been described as a power law:
| (10) |
Recently the Planck collaboration planck1 has parametrized its observations at frequencies , 545 and 857 GHz, together with the 100 m measurements of IRAS as reanalyzed in MivilleDeschenes:2004ci using the simple form
| (11) |
where is the energy flux at the frequency . This three–parameter form for the observable energy flux follows from Eqs. (8) and (10) when absorption is negligible, as in fact is the case for infrared wavelengths and Galactic distances. The average of the spectral shape parameters for fits performed for all lines of sight in the sky are K and , where the uncertainties are the dispersions of the best fit parameters for different sky regions planck1 . These results indicate that the energy distribution of the dust emission (in the range of frequency considered) is well described by a modified backbody spectrum, and that the temperature of the emitting dust has only small variations in different points of the Galaxy. For the modified blackbody spectrum, the average photon energy
| (12) |
scales linearly with , and has a weaker dependence on . The numerical value in the last equality in Eq. (12) is calculated for .
Integrating in frequency and solid angle the expression of Eq. (11) one obtains the energy (number) density 0.19 eV/cm3 (24.9 cm-3). These are in fact underestimates of the energy and number density of the radiation emitted by dust, because the spectral form of Eq. (11) is not valid for wavelength shorter than m (or photon energy eV). For short wavelengths, the emission is dominated by the contribution of small dust grains, that are not in thermal equilibrium. This emission depends on the grain size distribution, and exhibits prominent lines (clearly visible in Fig. 2). We have estimated that the nonthermal contribution to the dust emission introduces a large correction (approximately 45%) to the energy density of the radiation, but a much smaller correction to the number density of photons of order 5%–7%.
The emission of stars in the Galaxy forms an important component of the radiation field in the solar neighborhood. This emission can be described as the superposition of blackbody spectra with a range of temperatures that reflects the mass and age distributions of stars in Galaxy. The energy distribution of starlight shown in Fig. 2 is the model of Mathis, Mezger and Panagia mezger1 ; Mathis:1983fx who have fitted the (angle integrated) energy distribution of starlight as the sum of three diluted blackbody spectra at temperatures of 3000, 4000 and 7500 Kelvin, estimating the energy density in the solar neighborhood as 0.43 eV/cm-3, with a number density of approximately 0.42 photons/cm3 with average energy eV. The contribution of young hot stars emitting in the ultraviolet gives an additional small contribution of approximately 0.07 photons/cm3 with average energy 5.4 eV.
The fourth component of the radiation field is the extra galactic background light. The calculation of the EBL is a difficult task that requires a description of the injection of radiation from all galaxies during the entire history of the universe. Several models exist in the literature Franceschini:2008tp ; Finke:2009xi ; Kneiske:2010pt ; Gilmore:2011ks ; Stecker:2016fsg , with results that can differ by a factor as large as in the infrared region. When gamma rays propagate for extragalactic distances, one has to consider the cosmological evolution of the EBL and CMBR (see for example Batista:2016yrx ). In the case of the CMBR the redshift evolution is exactly known, for the EBL it depends on the modeling of the injection. For propagation in the Galaxy, the time scale is sufficiently short, so that the redshift evolution of EBL and CMBR can be safely neglected.
The curve shown in Fig. 2 shows the EBL model of Franceschini et al. Franceschini:2008tp calculated at redshift . The EBL angle integrated number density is small, of order 1.5 cm-3. This has the consequence that this component, while very important for extragalactic gamma rays, has a negligible effect for the propagation of photons inside our Galaxy.
II.3 Gamma ray absorption coefficient in the solar neighborhood
The absorption coefficient for the solar neighborhood can be calculated from Eq. (3) using the energy spectra of the target photons described above and shown in Fig. 2, and a model for the angular distribution of these photons. Using the decomposition of the target photon field of Eq. (6) the absorption coefficient can be written as the sum of the contributions of the different components:
| (13) | |||||
The components associated to the CMBR and the EBL are independent from and from the photon direction . To estimate the angular distribution of the radiation emitted by dust we have used the IRAS map of the 100 m radiation given in MivilleDeschenes:2004ci and made the assumption that the distribution in energy and angle of the photons factorizes in the form , where the angular distribution is independent from and equal to the (normalized to unity) distribution at 100 m. Comparing the angular distributions of the radiation measured at different wavelengths planck1 ; MivilleDeschenes:2004ci one can see that the factorization hypothesis is a very good approximation.
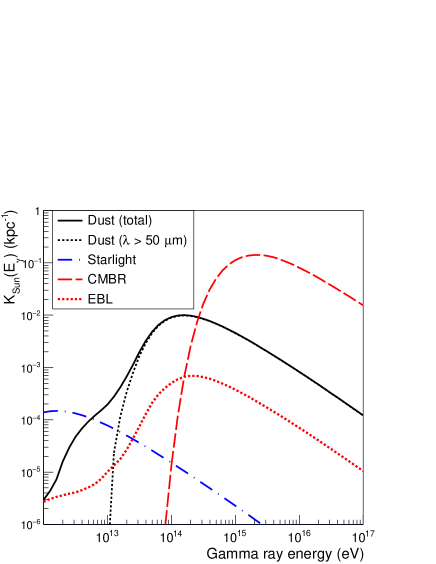
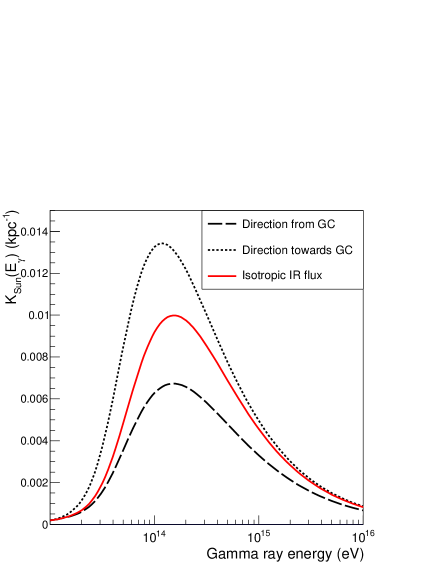
The absorption coefficient in the solar neighborhood (averaged over direction) is shown in Fig. 4. It is instructive to briefly discuss the results. The contribution of the CMBR has a maximum for a gamma ray energy PeV, where the absorption coefficient has the value kpc-1. These numerical results are easy to understand qualitatively. The energy of maximum absorption is approximately equal (it is larger by a factor 1.34) to where the average energy of the CMBR photons, and corresponds to the gamma ray energy that is best matched to the distribution of the target photons to maximize the pair production cross section. The maximum value of the absorption coefficient is approximately equal to (a factor 0.76 of difference to) to the quantity , which is the product of the pair production at maximum () and the total number density of CMBR photons. For the absorption coefficient falls very rapidly reflecting the spectral shape of the CMBR photon distribution, while for the absorption coefficient falls reflecting the dependence of the pair production cross section at large .
This pattern for the energy dependence of the absorption coefficient is repeated for the components associated to the target radiation generated by dust and star emission. In these three cases (CMBR, dust emission and star emission) the energy spectrum of the radiations has (exactly in the case of the CMBR, and approximately in the other two cases) a blackbody shape, characterized by temperatures of approximately 2.7 Kelvin for the CMBR, 20 Kelvin for the dust emission and 3000–7500 Kelvin for starlight. Accordingly, the average energies of the photons associated to the three components are significantly different: (, and 0.97 eV for CMBR, dust and star emission, respectively). This implies that the critical energy where the absorption effects are largest is 2.2 PeV for the CMBR, 150 TeV for the dust emission and 1.6 TeV for the star emission. The three components contribute approximately the same energy density to the target radiation field in the solar neighborhood (, 0.25 and 0.42 eV/cm3), (see Fig. 3) however since the average photon energies are different, the (energy and angle integrated) number densities for the three components are also significantly different (, 25.0 and 0.43 cm-3). The maximum absorption coefficient is proportional to the total number density and is therefore very different for the three components (, and kpc-1).
For an estimate of the importance of the angular distribution of the target radiation one can inspect Fig. 5 that shows the absorption coefficient calculated at the position of the Sun for the lines of sight that point towards the center and anticenter of the Galaxy. The figure also shows for comparison the absorption coefficient calculated assuming an isotropic angular distribution for the photons. For the line of sight towards the Galactic center (anticenter) most of the target photons are parallel (antiparallel) to the gamma ray direction, and this gives a lower (higher) absorption, with deviations of order % with respect to the result for an isotropic distribution.
As discussed above, the EBL has in first approximation the same energy distribution of the sum of the Galactic dust and star emission components, but it has a smaller density, reduced by a factor of approximately 20 with respect to the Galactic radiation field in the vicinity of the Sun. It follows that (for the near universe at ) is approximately equal to the sum of the Galactic reduced by an order of magnitude. This results in a negligible absorption effect for gamma rays that propagate for Galactic distances.
II.4 Order of magnitude of gamma attenuation effects
The calculation of the gamma ray attenuation requires a numerical integration of the absorption coefficient along the gamma ray trajectory. It is however possible and instructive to obtain a first order estimate of the size of the effect with some simple considerations.
The order of magnitude of the optical depth due to starlight along a line of sight of length can be estimated as:
| (14) |
In this equation is the absorption coefficient at the sun, is the density of starlight photons averaged for all points along the line of sight and is density in the solar neighborhood. In Eq. (14 the optical depth is proportional to the absorption coefficient at the Sun position, and to an effective length that takes into account the average radiation density along the trajectory.
The maximum absorption coefficient due to starlight in the solar neighborhood is of order kpc-1. Since the linear size of the Galaxy is of order 10–30 kpc, even if the density of starlight near the Galactic center is 1 order of magnitude larger than what we observe near the Sun, one can robustly conclude that the optical depth for any Galactic source is at most of order a few , with a small attenuation effect.
An estimate of the optical depth due to the radiation created by dust can be obtained from the analogous of Eq. (14). In this case the maximum of the absorption coefficient in the solar neighborhood (obtained for TeV) is of order 0.0098 kpc-1. The calculation of the density of infrared radiation in different points in the Galaxy is very much simplified by the fact that the Galaxy is transparent to infrared radiation, and it is therefore relatively straightforward (this will be discussed more carefully in the following) to determine the space distribution of the emission from the angular distribution of the radiation observed at the Earth, and therefore the density and angular distribution at any point in the Galaxy. It is also straightforward to see that the quantity converges to a finite result (that depends on the line of sight) in the limit (because the density of photons vanishes sufficiently rapidly at large distances from the Galactic center). In fact most of the gamma ray absorption happens near the GC. For lines of sight that pass near the GC the value of is of order 40–50 kpc, while the effective distance to the Galactic center is of order 20 kpc. The absorption due to the dust emitted radiation corresponds therefore (for an energy of order 100–150 TeV, where the effect is most important) to a maximum optical depth of order 0.4–0.5 for objects in the halo of the Galaxy seen via a line of sight that crosses the GC, and to an optical depth of order 0.2 for the GC itself. A more accurate modeling of gamma ray attenuation due to the radiation emitted by dust will be discussed in the following.
The discussion of absorption due to the CMBR is straightforward. The maximum absorption coefficient (for PeV) is 0.1415 kpc-1, and optical depth equal to unity corresponds to the distance kpc. This implies that PeV gamma astronomy is only possible in a sphere that encompasses a fraction of our Galaxy. At the energy of 2.2 PeV, photons emitted from the Galactic center arrive at the Earth with approximately 0.30 survival probability.
The absorption of each high energy gamma ray generates one electron positron pair with the constraint that the sum is to a very good approximation equal to the initial . The high energy created in the interaction rapidly lose energy via synchrotron radiation (because of the Galactic magnetic field) and inverse Compton scattering (where the target is again the ISRF). Photons created by these processes have in good approximation no angular correlation with the initial direction of the gamma ray. As an illustration, an with an energy of 100 TeV in a magnetic field of 3 Gauss (a typical value for the Galactic disk) has a Larmor radius of order 0.036 pc, while the energy loss length (the distance for which the particle loses half its energy) is of order of 1 kpc, more than 4 orders of magnitude longer. The radiation of the created by gamma ray absorption in the Galaxy is part of the Milky Way diffuse emission, but their contribution is very likely negligible.
III Interstellar Radiation Fields in the Galaxy
III.1 Model for infrared emission
Since the absorption probability of infrared photons traveling Galactic distances is negligible, the flux that reaches the point from the direction can be calculated simply integrating the emission along the line of sight. Assuming isotropic emission, one has:
| (15) |
with the versor in the direction , and the emission power density per unit wavelength at the point .
A model for the far–infrared emission for interstellar dust in the Galaxy, which is based on only a small number of parameters, has been developed by Misiriotis et al.misi2006 , fitting the spectra and angular distributions reported by COBE–FIRAS Wright:1991zz ; Reach:1995fy ; firas1999 and COBE–DIRBE Arendt:1998aj in the 60–1000 m wavelength range.
In the model the interstellar dust is described as the sum of two components: “cold” and “warm” dust, that both have a spatial distribution parametrized by the functional form:
| (16) |
In this equation () is the mass density of the cold (warm) dust, and are cylindrical coordinates in the Galaxy, the pairs of parameters and are the exponential scale height and scale length of the dust distributions, and is the dust mass density at the Galactic center. The total mass of the Galactic interstellar dust is estimated as , with the warm dust constituting only a fraction of order 0.31%.
The dust is assumed to be in local thermal equilibrium, and therefore to have a well-defined temperature. For the cold dust, heated by the diffuse Galactic starlight, the temperature has an exponential space dependence:
| (17) |
where (with a best fit value of 19.2 Kelvin) is the temperature at the Galaxy Center, is the temperature at infinity, and and are parameters that give the scale length and scale height of the distribution.
The warm dust is present in star forming regions, and most of the energy it absorbs is generated by near, young, hot stars. This results in a constant temperature K pope2000 .
The dust emission for wavelength m is described as a modified blackbody spectrum according to Eq. (8) summing the contributions of cold and warm components:
| (18) |
To describe the dust emissivity , following Misiriotis et at. misi2006 we have used the results given by Weingartner and Draine wein2001 , assuming for the dust a constant parameter (with the ratio of visual extinction to reddening for visible light) 111Tables of numerical values for as a function of wavelength are available at https://www.astro.princeton.edu/ ~draine/dust/dustmix.html.
| Parameter | Value | Units |
|---|---|---|
| 1.51 10-25 | g cm-3 | |
| 1.22 10-27 | g cm-3 | |
| 5 | kpc | |
| 3.3 | kpc | |
| 0.1 | kpc | |
| 0.09 | kpc | |
| 19.2 | K | |
| 48 | kpc | |
| 500 | kpc | |
| 35.0 | K |
The model of dust emission described above is therefore defined by a total of ten parameters: , , , , , and . The set of best fit parameters obtained by Misiriotis et al. misi2006 is reported in Tab.1, and are those also used by us to describe the radiation.
The dust emission at shorter wavelength (1–50 m)
is dominated by the nonthermal contribution of small grains, and
the spectrum is characterized by strong emission lines.
To extend the model to this wavelength region
we have used the work of Draine and Li draine_li
who have calculated the dust emission
for different compositions of the dust grains
and for different models (in intensity and spectral shape)
of the starlight radiation that heats the dust.
We have made the simplifying assumption that the shape of the
dust emission in the short wavelength region is equal for all
points in the Galaxy, and described by a single
Draine and Li model, the one where the
polycyclic aromatic hydrocarbons (the main source of the line emission)
account for 0.47% of the dust mass density,
and where the dust is heated by a starlight with the
same spectrum and intensity observed in the solar neighborhood 222
This corresponds to the model
U1.00/U1.00_1.00_MW3.1_00 in the tabulated results made available
in draine_li . .
The intensity of infrared radiation for any direction and position in the Galaxy can be calculated from the emission model making use of Eq. (15). The energy density of the radiation at a certain point can be obtained integrating the flux over all directions:
| (19) | |||||
The density of infrared photons as a function of the energy can be obtained transforming these distributions using the relation . The model described here has cylindrical symmetry for rotations around an axis that passes through the Galactic center, and up–down symmetry for reflections of the axis, so that the density of the radiation depends only on and ; and the angular distributions of the radiation at points (such as the solar system) that are on the () Galactic plane have the properties
| (20) |
with () the Galactic latitude (longitude) angle.
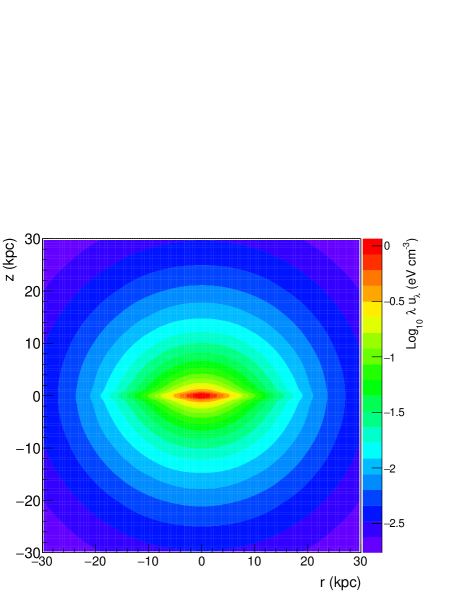
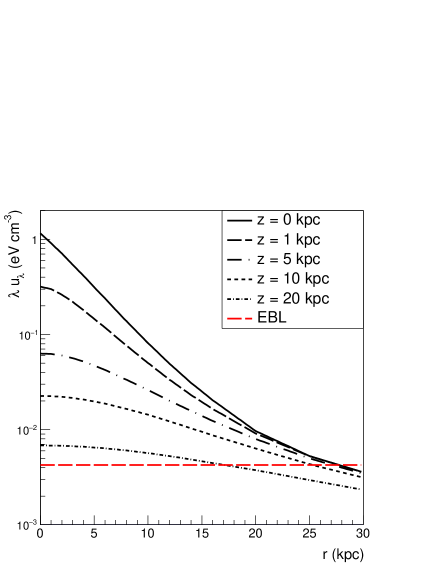
The space dependence of the energy density of infrared radiation is illustrated in Figs. 6 and 7. Figure 6 shows the energy density as a function of the Galactic cylindrical coordinates and , for the wavelength m (that is close to the maximum of the infrared spectrum) while Fig. 7 shows the dependence of the energy density (for the same wavelength) for different fixed values of . Most of the infrared flux is concentrated in the region kpc and kpc.
In this model the space and energy dependence of the radiation field are approximately factorized, and therefore Figs. 6 and 7 describe well the shape of the space distribution of the dust emission radiation in a broad range of wavelength.

III.2 Comparison of model with data
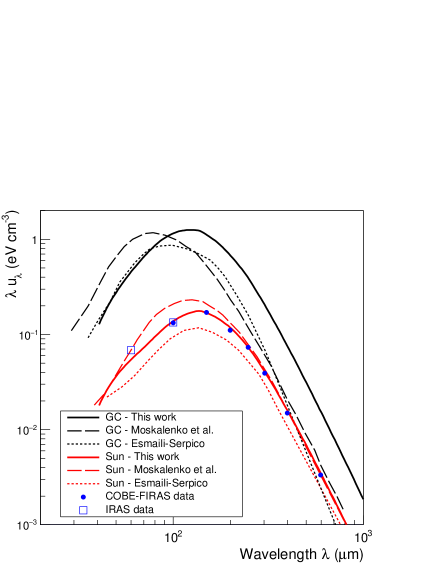
The (angle integrated) energy spectrum of the dust emitted radiation in the vicinity of the Sun is shown in Fig. 8, where it is plotted as a function of wavelength and compared to the measurements of COBE/FIRAS Reach:1995fy and IRAS MivilleDeschenes:2004ci that cover well the wavelength range where the radiation is brightest. The agreement between model and data is very good. In the figure we also show the radiation spectrum in the solar neighborhood calculated by MPS moska2006 and the one obtained using the GALPROP code by ES esma2015 . These results have a spectral shape similar to the one calculated in our model, but with normalizations that differ by approximately % (in opposite directions for the two cases).
Figure 8 also shows the infrared spectrum at the Galactic center. In the model discussed here the spectral shape of the radiation is only weakly dependent on the position in the Galaxy.
In Sec. II.2 we have noted that the Planck collaboration has observed that the spectra measured in the wavelength region between 100 and 850 m along different lines of sights have shapes that are approximately independent from the direction. This result is consistent with what we obtain in our model, and it is the consequence of the fact that most of the interstellar dust in the Galaxy has only a narrow range of temperatures (around 20 Kelvin), with the warm dust, which is only 0.31% of the total dust mass, giving a measurable contribution only at shorter wavelengths.
In the approximation where the dust has a single temperature in the entire Galaxy (and therefore the emission spectrum is independent from position), and using the fact that the absorption of infrared radiation is negligible, one has that the spectrum of the dust emitted radiation in different points of the Galaxy has a factorized form. The factorization can be written as
| (21) |
where (without loss of generality) one can take as the angle integrated spectrum at the Sun position, and is independent from the photon energy (or wavelength). In the model discussed here the factorization of Eq. (21) is not exactly valid. The (angle integrated) spectra measured near the Galactic center are a little harder than the spectra measured at large distance from the center, and similarly for a fixed point in the Galaxy, the spectra in the direction of the GC are a little harder than the spectra in the opposite direction; however the factorization remains a reasonable first approximation that can be useful as a guide to estimate the absorption effects (as in our discussion in Sec. II.4).
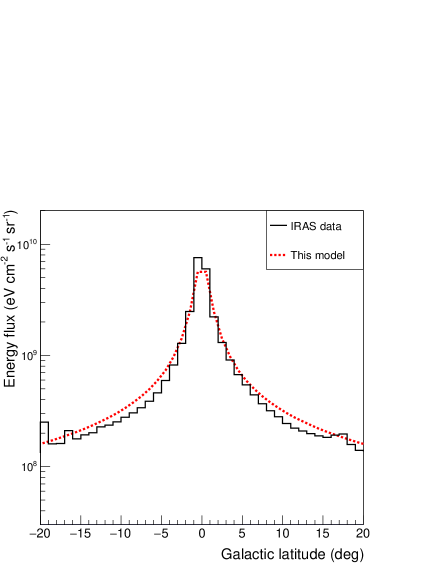
An example of the angular distribution of the dust emitted radiation in our model is given in Figs. 9 and 10 that show the Galactic latitude and Galactic longitude distributions in the solar neighborhood for the wavelength m. The distributions are compared to the map obtained by IRAS MivilleDeschenes:2004ci for the same wavelength. The infrared photons have a very anisotropic distribution, with most flux arriving in a narrow range of latitude around the Galactic equator (approximately 50% of the flux is contained in the region ), there is also a significant asymmetry in longitude, with the flux from the direction of the Galactic center approximately 4 times larger than the flux in the opposite direction. The comparison of the model with the observations shows that the main features of the data (the width of the latitude distribution, and the asymmetry between the directions toward the Galactic center and anticenter) are reasonably well described, but on smaller angular scales the model cannot describe accurately the structures associated to the irregular distributions of stars and dust.
III.3 Starlight
To complete the description of the ISRF in the Galaxy it is necessary to have a model also for the starlight component. In Sec. II.2 we have already discussed the angle integrated spectrum in the solar neighborhood estimated by Mathis, Mezger and Panagia mezger1 ; Mathis:1983fx . To model the starlight spectrum for other points in the Galaxy we have used the results of the same authors Mathis:1983fx that give tables of the starlight spectra for points on the Galactic equatorial plane () at different distances from the Galactic center, and the results on the starlight distribution shown in the publications of MPS and ES. The distribution of the starlight energy density in the Galaxy has been described with the cylindrically symmetric and factorized form:
| (22) |
The parameters have been fitted as kpc (4.07 kpc) for kpc, ( kpc) and kpc; the energy density at the Galactic center is obtained imposing that the ISRF at the Sun position coincides with the estimate of Mathis, Mezger and Panagia. For the angular distribution of the starlight photons we have assumed isotropy. Our model for starlight in the Galaxy should be considered as a simple first order approximation, but it is adequate for the purpose of estimating the absorption of gamma rays, because starlight represents only a very small correction to the contributions of the CMBR and the infrared dust emission.
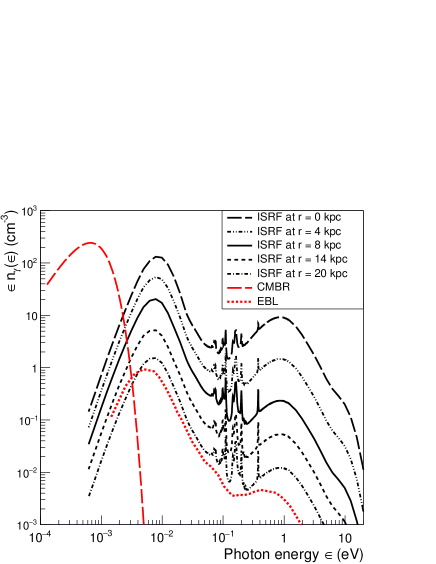
The energy spectra of the ISRF for points on the Galactic equator at different distances from the Galactic center are shown in Fig. 11 plotted in the form versus the photon energy . Inspecting the figure one can see that the CMBR is always the largest source of photons, followed by the infrared radiation emitted by dust, with starlight contributing only a small fraction of the total number of target photons.
IV Absorption probability for Gamma Rays in the Galaxy
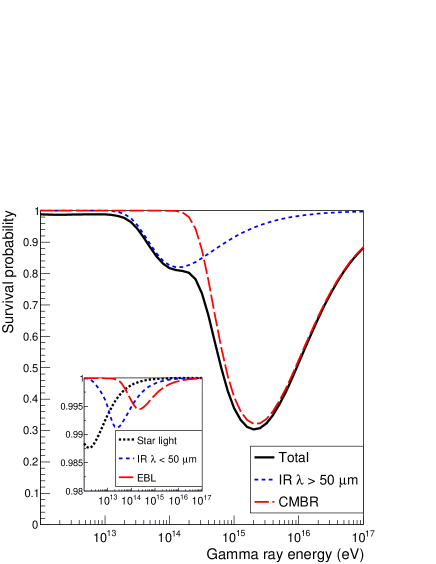
Using the model for the ISRF described in the previous section, it is straightforward to compute the survival probability for gamma rays that travel different paths in the Galaxy using Eq. (4). Figure 12 shows the survival probability for gamma rays arriving to the Sun from a source in the Galactic center as a function of the gamma ray energy. In the figure the probability is shown together with the contributions from the different components of the radiation field. Most of the absorption is due to the CMBR and to the thermal emission from the dust (with wavelength m). The other components of the ISRF give smaller contributions that are visible in the inset of the figure. The survival probability has a deeper minimum for PeV that is due to the CMBR, and a second minimum at TeV. This structure can be understood from the fact that the dominant sources of gamma ray absorption are the CMBR and the infrared emission that have spectra in different regions of . The other components of the radiation give small corrections to the absorption, indicating that the approximate treatments of the starlight and line emissions from dust do not introduce significant errors. The contribution of the EBL is a correction of order % for a gamma ray energy TeV, where its effects are most important.
Recently deep gamma ray observations by the Cherenkov telescope H.E.S.S. HESS-GC in an annulus around the Galactic center region have shown a spectrum that extends as a power law up to energies of tens of TeV without indications of a break of cutoff, strongly suggesting the existence of a proton “PeVatron” in the central 10 pc of our Galaxy, probably associated to the supermassive black hole Sagittarius (Sgr) A*. The study of this source with very high energy ( TeV) gamma rays is clearly a crucial test, and a precise description of the absorption effects is necessary. The study of the GC with neutrinos is also of great interest (see for example Celli:2016uon ).
Gamma rays coming from different directions and distances have similar absorption patterns, with the maximum attenuation due to CMBR at PeV, and a secondary absorption peak at TeV due to the infrared light, that produces a “shoulder” in the total absorption spectrum. The amount of the two effects and their relative contributions depend on the gamma ray path.
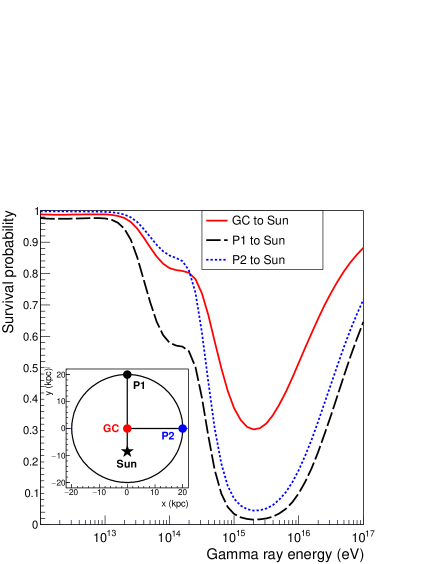
Figure 13 shows the survival probability for three different source positions: the Galactic center, the points P1 (, kpc, ) and P2 ( kpc, , ) (for the coordinate definition, see the inset of the figure). The infrared absorption is maximum when the gamma rays arrive from P1, crossing the Galactic center. Gamma rays arriving from P2 do not pass close to the GC and the absorption effects due to infrared radiation are smaller.
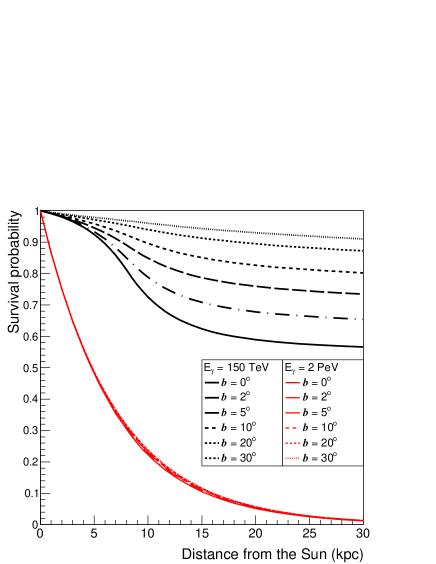
Figure 14 shows the gamma ray survival probability for different directions in the Galactic equatorial plane, as a function of the source distance, for gamma ray energies TeV and 2 PeV. The absorption of gamma ray with PeV is mostly due to the homogeneous CMBR, and is therefore to a good approximation independent from the photon trajectory and described by a simple exponential. Gamma rays of 150 TeV are mostly absorbed by the infrared light, and for a fixed source distance, the absorption probability has a strong dependence on the gamma ray path in the Galaxy, with the attenuation largest for trajectories that cross the Galactic center.
The dependence of the absorption effect on the direction of the gamma ray path, is also strong for lines of sight that go out of the Galactic plane (), as the density of infrared radiation is concentrated near the Galactic plane. The absorption of gamma rays for trajectories outside the Galactic plane is illustrated in Fig. 15 which shows the survival probability (for the same energies TeV and 2 PeV) as function of distance for a set of lines of sight with different Galactic latitude.
The gamma ray absorption probability , for a fixed value of the energy , and a fixed line of sight (determined by the angles and ) grows monotonically with the source distance . Inspecting Figs. 14 and 15 one can see that for large the probability associated to the Galactic radiation fields becomes approximately constant, taking an asymptotic value that is a function only of , and . This is the consequence of the fact that the density of Galactic photons falls rapidly () at large distances from the center of the Galaxy, and the absorption coefficient associated to Galactic photons vanishes for . The asymptotic value of the Galactic absorption probability is appropriate for gamma ray sources located in the Galactic halo at large distances from the Sun. This asymptotic probability is also necessary to compute the total absorption of photons from extragalactic sources combining this effect with the absorption in extragalactic space.
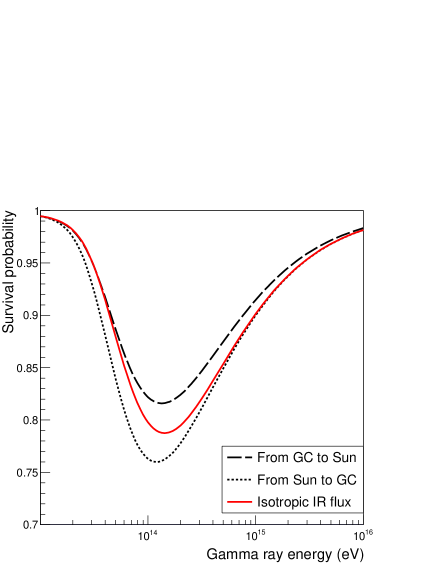
As already discussed, infrared radiation has a very strong anisotropy, and the calculation of the survival probability has to include the correct angular distribution of the target photons. To illustrate the importance of this effect, Fig. 16 shows the survival probability of a gamma ray traveling from the Galaxy center to the Sun compared to that of a gamma ray traveling in the opposite direction taking into account only the contribution of the dust emitted radiation, compared with a calculation that assumes an isotropic angular distribution for the target photons. As it is intuitive, the calculation with the assumption of isotropy overestimates the absorption for gamma rays that travels outward from the center to the periphery of the Galaxy (when most of the target photons are parallel to the gamma ray direction) and underestimates the absorption for gamma rays traveling in the opposite direction. The effect is significant, but it represents only a modest correction. For TeV, the absorption probability is for gamma rays traveling from the GC to the Sun, and for gamma rays traveling in the opposite direction, while the isotropic calculation is approximately equal to the average.
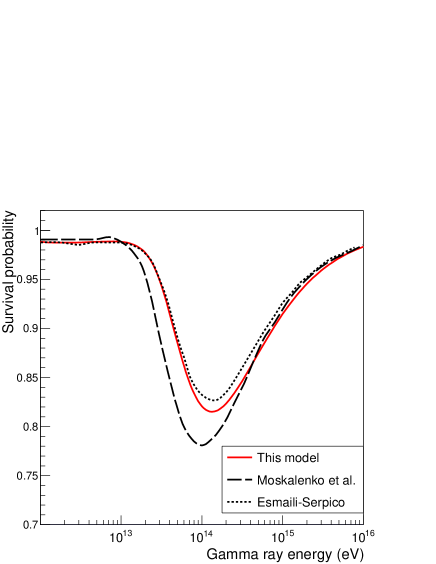
In Fig. 17 we compare the survival probability calculated with our model for gamma rays that arrive from the Galactic center with the results of MPS moska2006 and ES esma2015 . All calculations consider only the effects of the radiation emitted by dust and stars. The amounts of absorption are comparable in all three calculations, however some differences can be seen. The calculation of MPS has a larger absorption, which can be probably traced to the larger density of infrared radiation estimated in the solar neighborhood (see Fig. 3). The results of the ES calculation are similar to ours. This is likely due to a cancellation effect: ES give a smaller estimate of the density of infrared radiation near the Sun, but also assume that the radiation is isotropic, overestimating the absorption for photons that travel from the GC to the Sun.

IV.1 Systematic uncertainties
The crucial step in the construction of a model for the infrared radiation in the Galaxy is the estimate of the infrared emission density from the observations of spectrum and angular distributions of infrared photons at the Earth. This can be performed “inverting” Eq. (15) that gives the observed flux as an integral over the emission density. Such an inversion is clearly a nontrivial problem. Following Misiriotis et at. misi2006 we have used very simple and smooth (exponential) expressions for the space and temperature distributions of interstellar dust, which describes reasonably well the main features of the data. It is however clear that this simplified treatment has its limitations.
One source of error derives from the fact that the dust space distribution is more irregular and has much more structure than a simple exponential. The density of the radiation is smoother than the emission, because each point in space receives photons from the entire Galaxy, but some “granularity” in the density distribution of infrared radiation remains. This has the consequence that the true optical depth along a particular line of sight can differ from the smoothed out estimate calculated in the model by as much as 20%–30%.
In addition it also possible that the exponential functional forms that we have used do not capture exactly the average space and temperature distributions of the interstellar dust, especially in the inner part of the Galaxy. For example in Wright:1991zz , the authors discuss a model for the space distribution of the dust that has a (dominant) exponential term together with a Gaussian, which enhances the dust mass density near the GC, and also a narrow “ring” of dust of radius kpc. Our model also neglects the spiral structures in the Galactic disk.
Numerical experiments performed along these lines suggest that without spoiling (or in fact also improving) the agreement between data and model, it is possible to change the optical depth for trajectories that traverse the inner part of the Galaxy by something that can be as large as 30%.
In our model the optical depth due to the infrared radiation for a gamma ray source at the GC has a maximum value of order (), while the optical depth for a source on the far side of the Galaxy is of order (). A variation of % of the optical depth results for the first (second) case in a difference in the absorption probability ().
V Outlook and Conclusions
In this work we have calculated the attenuation of very high energy gamma rays propagating in the Galactic and extragalactic radiation fields. The model for the Galactic infrared radiation field that is the crucial element in the estimate of the absorption probabilities is based on a simple analytic description of the interstellar dust, and has been described in a self–contained form. It is therefore straightforward to replicate the calculations performed here 333To obtain tables of the gamma ray absorption probabilities it is possible to contact the authors..
The CMBR is the most important source of target photons, and with a spectrum that peaks at eV, is most effective for absorption at gamma ray energy PeV, where the absorption length is 7.07 kpc. This implies that in the PeV energy range the Galactic center is visible with an optical depth of order unity, and galactic sources beyond the Galactic center are very strongly attenuated. At lower energy the effects of the CMBR are much less significant. As an illustration, the absorption length at 300 TeV is 72 kpc, and the effects decrease exponentially for decreasing .
For TeV, the absorption of gamma rays is dominated by target photons generated inside the Galaxy. This radiation has two main components, starlight and dust emission, which contribute an approximately equal energy density in all points of the Galaxy. The spectra of the two components are however well separated, with starlight photons having an average energy of order eV, and dust emitted photons having an average energy eV. It follows that starlight photons are most effective in the absorptions of gamma rays with energy TeV, while infrared, dust emitted photons are mostly effective for TeV. The number densities of the target photons for the two components differ by a factor of order 50, and therefore the largest optical depths generated by the two components differ by a factor of the same order.
The infrared radiation can generate optical depths as large as (or absorption probabilities of order ) for lines of sight that traverse the entire Galaxy passing close to the center. This is clearly an important effect, but the entire Galaxy and its halo can be observed also in the energy range where the absorption due to infrared radiation is most important. Absorption due to starlight remains always smaller than 1%–2% for gamma rays created in any point of the Galaxy, and is in practice of negligible importance.
In this paper we have discussed a simple model, constructed following very closely the work of Misioriotis et al. misi2006 , to compute the dust emitted radiation field using only few parameters. The model describes well the main features (in energy, space and angle) of the radiation. The original work of Misiriotis et al. considered only the wavelength range m, where the dust emission is well described as a thermal process with a modified blackbody spectral shape. The emission at shorter wavelength is more difficult to describe, and more dependent on the (only poorly known) composition of the dust grains. Extending the work of Misiriotis et al. we have included in the model a simplified description of dust emission in the short wavelength range –50 m that is however adequate for the purpose of computing gamma ray absorption probabilities.
We have applied our model of the dust emitted radiation, together with a simplified description of starlight, and models of the CMBR and EBL to compute the absorption probability for different gamma ray trajectories in the Galaxy. Some examples of these calculations are shown in this work and compared with results already existing in the literature. The agreement is reasonably good.
A limitation of our model (that is also in common with previous calculations) is that the interstellar dust spatial distribution is modeled as a smooth exponential with cylindrical symmetry, while the true distribution has a much more complex and irregular form. It follows that our model cannot claim to determine exactly the precise absorption for any individual gamma ray source, however the results can be considered valid for an ensemble of sources, or for the study of a diffuse flux.
The main source of systematic uncertainty in the modeling of the infrared radiation is probably the description of the dust space distribution. We have estimated the uncertainty for the optical depth due to infrared radiation in the directions where it is largest (when the line of sight passes close the GC) as of order –30%. This corresponds to an uncertainty on the absorption probability .
A comment is in order about the effects of the angular distribution of the photons that form the ISRF. The angular distribution of these photons is strongly anisotropic, with the flux concentrated in a narrow band of Galactic latitude, and a significant flow of the radiation outward from the Galactic center. For gamma rays arriving from the Galactic center neglecting the correct angular distributions of the target photons results in an error for the absorption probability of .
In conclusion, the absorption of very high energy gamma rays with TeV by pair production interactions effectively precludes extragalactic observations, but Galactic astronomy remains possible and very promising. The pair production absorption effects can be calculated with an excellent (for the CMBR), or reasonably good (for the dust emitted radiation) accuracy.
References
- (1) J. A. Hinton and W. Hofmann, Ann. Rev. Astron. Astrophys. 47, 523 (2009).
- (2) S. Funk, Ann. Rev. Nucl. Part. Sci. 65, 245 (2015).
- (3) B.S.Acharya et al., Astroparticle Physics 43, 3 (2013)
- (4) S.W.Cui, Y.Liu, Y.J.Liu and X.H. Ma., Astroparticle Physics 54, 86 (2014)
- (5) M.Tluczykont et al., Astroparticle Physics 56, 42 (2014)
- (6) M. G. Aartsen et al. [IceCube Collaboration], Science 342, 1242856 (2013) [arXiv:1311.5238 [astro-ph.HE]].
- (7) M. G. Aartsen et al. [IceCube Collaboration], Phys. Rev. Lett. 113, 101101 (2014) [arXiv:1405.5303 [astro-ph.HE]].
- (8) A.W. Strong, I.V. Moskalenko, O.Reimer, ApJ 537, 763 (2000)
- (9) T.A.Porter & A.W. Strong, Proc. 29th International Cosmic Ray Conference, arXiv:Astro-ph/0507119 (2005)
- (10) J.L.Zhang, X.J.Bi & H.B.Hu, A&A 449, 641 (2006)
- (11) I. V. Moskalenko, T. A. Porter and A. W. Strong, Astrophys. J. 640, L155 (2006) [astro-ph/0511149].
-
(12)
A. E. Vladimirov et al.,
Comput. Phys. Commun. 182, 1156 (2011)
[arXiv:1008.3642 [astro-ph.HE]].
The most recent version of the GALPROP code is available at
https://sourceforge.net/projects/galprop - (13) A. W. Strong, I. V. Moskalenko and V. S. Ptuskin, Ann. Rev. Nucl. Part. Sci. 57, 285 (2007) doi:10.1146/annurev.nucl.57.090506.123011 [astro-ph/0701517].
- (14) I. A. Grenier, J. H. Black and A. W. Strong, Ann. Rev. Astron. Astrophys. 53, 199 (2015). doi:10.1146/annurev-astro-082214-122457
- (15) A. Esmaili & P.D.Serpico, JCAP 10, 014 (2015)
- (16) A. Misiriotis, E. M. Xilouris, J. Papamastorakis, P. Boumis and C. D. Goudis, Astron. Astrophys. 459, 113 (2006) [astro-ph/0607638].
- (17) E. L. Wright et al., Astrophys. J. 381, 200 (1991).
- (18) W. T. Reach et al., Astrophys. J. 451, 188 (1995) [astro-ph/9504056].
- (19) D.Finkbeiner, M.Davis & D.J. Schlegel, ApJ 524, 867 (1999)
- (20) R. G. Arendt et al., Astrophys. J. 508, 74 (1998) [astro-ph/9805323].
- (21) D. J. Fixsen, Astrophys. J. 707, 916 (2009) [arXiv:0911.1955 [astro-ph.CO]].
- (22) B. T. Draine, Ann. Rev. Astron. Astrophys. 41, 241 (2003) [astro-ph/0304489].
- (23) B. T. Draine and A. Li, Astrophys. J. 657, 810 (2007)
- (24) M. Compiegne et al., Astron. Astrophys. 525, A103 (2011) [arXiv:1010.2769 [astro-ph.GA]].
- (25) A. Abergel et al. [Planck Collaboration], Astron. Astrophys. 571, A11 (2014) [arXiv:1312.1300 [astro-ph.GA]].
- (26) M. A. Miville-Deschenes and G. Lagache, Astrophys. J. Suppl. 157, 302 (2005) [astro-ph/0412216].
- (27) P. G. Mezger, J. S. Mathis and N. Panagia, Astron. Astrophys. 105, 372 (1982).
- (28) J. S. Mathis, P. G. Mezger and N. Panagia, Astron. Astrophys. 128, 212 (1983).
- (29) Abramowski et al., Nature 531, 476 (2016) [arXiv:1603.07730 [astro-ph.HE]].
- (30) S. Celli, A. Palladino and F. Vissani, arXiv:1604.08791 [astro-ph.HE].
- (31) A. Franceschini, G. Rodighiero and M. Vaccari, Astron. Astrophys. 487, 837 (2008) [arXiv:0805.1841 [astro-ph]].
- (32) J. D. Finke, S. Razzaque and C. D. Dermer, Astrophys. J. 712, 238 (2010) [arXiv:0905.1115 [astro-ph.HE]].
- (33) T. M. Kneiske and H. Dole, Astron. Astrophys. 515, A19 (2010) [arXiv:1001.2132 [astro-ph.CO]].
- (34) R. C. Gilmore, R. S. Somerville, J. R. Primack and A. Dominguez, Mon. Not. Roy. Astron. Soc. 422, 3189 (2012) [arXiv:1104.0671 [astro-ph.CO]].
- (35) F. W. Stecker, S. T. Scully and M. A. Malkan, Astrophys. J. 827, no. 1, 6 (2016) [arXiv:1605.01382 [astro-ph.HE]].
- (36) R. Alves Batista et al., JCAP 1605, no. 05, 038 (2016) [arXiv:1603.07142 [astro-ph.IM]].
- (37) C. C. Popescu, A. Misiriotis, N. D. Kylafis, R. J. Tuffs and J. Fischera, A&A, 362, 138 (2000)
- (38) J.C.Weingartner, B.T. Draine, ApJ, 548, 296-309 (2001)