Adsorption geometry and the interface states: The relaxed and compressed phases of NTCDA/Ag(111)
Abstract
The theoretical modelling of metal-organic interfaces represents a formidable challenge, especially in consideration of the delicate balance of various interaction mechanisms and the large size of involved molecular species. In the present study, the energies of interface states, which are known to display a high sensitivity to the adsorption geometry and electronic structure of the deposited molecular species, have been used to test the suitability and reliability of current theoretical approaches. Two well-ordered overlayer structures (relaxed and compressed monolayer) of NTCDA on Ag(111) have been investigated using two-photon-photoemission to derive precise interface state energies for these closely related systems. The experimental values are reproduced by our DFT calculations using different treatments of dispersion interactions (optB88, PBE-D3) and basis set approaches (localized numerical atomic orbitals, plane waves) with remarkable accuracy. Our results underline the trustworthiness, and some of the limitations, of current DFT based methods regarding the description of geometric and electronic properties of metal-organic interfaces.
pacs:
73.20.-r, 79.60.Dp 78.47.-p,.1 Introduction
Electronic devices based on organic thin films contain a number of functional units which are crucial for their proper operation. The interface to the metallic leads is one of them, as it constitutes the link between two electronic sub-units with very different properties; discrete molecular levels, on the one hand, meet the continuum band structure of an inorganic solid, on the other. The layer in direct contact to the substrate (contact primer layer) thereby plays a decisive role, determining the electronic structure at these interfaces, and it has been found that distinct interface states (IS) may form as a result of the nearby molecular layer Temirov et al. (2006); Schwalb et al. (2008); Dyer and Persson (2010); Zaitsev et al. (2010); Marks et al. (2011).
Based on Scanning Tunnelling Microscopy (STM) and Spectroscopy (STS) data for PTCDA/Ag(111) Temirov et al. (2006) it was invoked that this electronic state, which is found to display free-electron-like dispersion, derives from an unoccupied molecular orbital (LUMO+1) which has broadened and shifted down in energy due to the interaction with the Ag(111) substrate Dyer and Persson (2010). Dispersion then arises as a consequence of mixing with delocalized metallic states (substrate-mediated intermolecular coupling). Alternatively, on the basis of the observed short life time of this interface state Schwalb et al. Schwalb et al. (2008) argued that this state represents a modified surface state (SS) band that has been shifted upwards by the interaction with the molecular layer. Hybridization with unoccupied molecular orbitals may occur in addition, but this is not a prerequisite for a delocalized interface state to occur.
Model calculations by Dyer and M.Persson Dyer and Persson (2010), as well as Zaitsev et al. Zaitsev et al. (2010) support the ’upshifted surface state’ model by Schwalb et al. and, for the particular system PTCDA/Ag(111), confirm mixing with the LUMO+1 band of PTCDA, which has shifted down in energy upon contact with Ag(111). In particular, calculations in ref. Dyer and Persson (2010) reveal that outside the surface, where STM and STS are measured, the IS indeed exhibits a density distribution that clearly reflects its hybridization with the molecular orbitals. Moreover, Marks et al. Marks et al. (2011) find that, in agreement with the original conjecture of ref. Temirov et al. (2006), the bending of the carboxylic oxygen atoms towards the Ag(111) surface enhances the molecular overlap with the up-shifted surface state. Note that the nature of the IS as an upshifted SS quite naturally explains its free-electron-like dispersion. More detailed calculations Zaitsev et al. (2012); Tsirkin et al. (2015) have been conducted to illuminate the dependence of the IS energy () on the specific arrangement and adsorption geometry (vertical bonding distance , bending of the molecular framework, etc.) of the adsorbed species, the surface coverage, as well as to study the expected life times of the IS for various molecule-metal systems Tsirkin et al. (2015).
The energy position of the interface state depends most sensitively on the vertical bonding distance of the molecules. For the well studied PTCDA system decreases from 3.27 Å for PTCDA/Au(111) Henze et al. (2007) to 2.86 Å for PTCDA/Ag(111) Hauschild et al. (2005); Bauer et al. (2012) and to 2.81 Å for PTCDA/Ag(100) Bauer et al. (2012). At the same time the upshift of the Shockley state increases from 0.16 eV Ziroff et al. (2009) to 0.66 eV Schwalb et al. (2008), and to 0.95 eV Galbraith et al. (2014), respectively, resulting in an inverse scaling of = -(1.2 - 1.7) eV/Å -1.5 eV/Å Marks et al. (2014). This high sensitivity of on the adsorption geometry makes it an ideal model to test electronic structure calculations by comparing the results of different approaches and approximations with accurate experimental data. Despite current improvements in the description of surface and interface properties of molecular layers, the correct description of interface state energies is by no means trivial.
Here, in a combined experimental and theoretical approach, we investigate the well-known metal-organic model system NTCDA on Ag(111) to examine the dependence of interface state energies on the molecule-substrate binding geometry. NTCDA adsorbed on Ag(111) has been studied by various experimental techniques in the past Stahl et al. (1998); Kilian et al. (2008); Stanzel et al. (2004); Stadler et al. (2007); Bendounan et al. (2007); Marks et al. (2011); Braatz et al. (2012); Tonner et al. (2016); Braatz et al. (2015). Two long range ordered monolayer phases (relaxed and compressed monolayers - denoted as r-ML and c-ML in the following) have been identified Stahl et al. (1998); Kilian et al. (2008); Braatz et al. (2012, 2015). A moderate interaction strength of NTCDA with Ag(111) has been concluded based on the observed downward shift of molecular orbitals upon adsorption Bendounan et al. (2007); vibrational frequency shifts are particularly strong for the carboxyl group located at the corners of the molecule, which has been attributed to a chemical interaction with the silver substrate, in addition to the ubiquitous van der Waals (vdW) interactions Braatz et al. (2012); Tonner et al. (2016).
Using the normal incidence x-ray standing wave technique (NIXSW), values have been determined for the relaxed and the compressed NTCDA monolayer phases on Ag(111) Stanzel et al. (2004); Stadler et al. (2007). The molecular arrangements of both long range ordered overlayers have only very recently been resolved on the basis of low temperature STM data Braatz et al. (2015). For r-ML the parallel oriented NTCDA molecules are arranged in a brickwall-type fashion and two inequivalent molecules within the rectangular unit cell can be distinguished. Unlike r-ML with all NTCDA aligned identically (long molecular axis oriented along Ag(111) atom rows), the c-ML phase comprises two different azimuthal orientations of NTCDA. More precisely, the flat lying molecules are forming a herringbone structure with four inequivalent NTCDA within the unit cell.
In this context, we stress that the structural details regarding the lateral ordering are crucial to derive meaningful quantities for the vertical bonding distances, molecular deformations, adsorption energies and electronic levels of the molecular layer from calculations, and thereby allow us to establish a correlation between and .
The intriguing role of NTCDA/Ag(111) as a model system not only refers to the comprehensive knowledge base regarding its electronic and structural properties, but additionally relies on the fact that two layers with almost identical composition (coverage, molecular orientation) exist. Specifically, the two long range ordered NTCDA monolayer phases differ in their coverages by only 10% ( = 1.0 monolayers (ML) for c-ML, versus 0.9 ML for r-ML). As we will show here, these two phases exhibit interface states at well-defined but distinctly different positions, with the r-ML IS located at a higher energy. This counter-intuitive result seems to stem from the balance between the effect of the molecular adsorption distance and the different coverages. Therefore, NTCDA/Ag(111) represents an ideal playground to gauge the ability of current theoretical methods based on density-functional theory (DFT) to predict the molecular binding geometries and the relation between those geometries and . This is particular important since, in general, to obtain valid structural information of the molecular adsorption configuration represents an experimental challenge and the adsorption height is known from experiments only for a few selected systems (sometimes with sizeable error bars). For NTCDA/Ag(111) the accumulated experimental knowledge in the literature, plus the data presented here for the surface electronic structure using two-photon-photoemission (2PPE) measurements, pose a well-defined and stringent test to the predictive capabilities of existing DFT methods. Eventually, theory may provide trustworthy structures (via dispersion corrected DFT) and reliable even in cases where e.g. the experimental adsorption height is not known.
.2 Experimental Methods
The 2PPE experiments and the preparation of the sample was performed in the same ultra high vacuum (UHV) chamber at a base pressure below mbar. The Ag(111) crystal was cleaned by Ar-sputtering cycles (3 A, 700 V, 15 min. 373 K) and subsequent annealing (773 K, 5 min). The NTCDA layers were grown at a sample temperature of 90 K and a rate of 0.4 ML per minute. After deposition of 1.5 ML, we prepared the c-ML and r-ML phases according to the recipe of Braatz et al. Braatz et al. (2012), i.e., by thermal annealing to either 360 - 370 K (c-ML) or 400 K (r-ML) and using a temperature ramp K/s. The long range order and purity of the film was checked by low energy electron diffraction (LEED) and X-ray photo-electron spectroscopy (XPS).
We used the laser setup described by Sachs et al. Sachs et al. (2009) (PE-I) with a pump laser energy of eV, (pulse width 68 fs) and a probe energy of eV, (pulse width 77 fs). The incident beams were focused onto the sample at an angle of 75∘ with respect to the surface normal; the spectra reported here refer to a sample temperature of 90 K and were recorded in normal emission, i.e., at the -point. Special care has been taken to avoid space-charge effects, which might adversely influence the precisely measured energetic positions. The UV beam photon energy, which was very close to the work function of the clean sample, has been reduced to a pulse energy below 0.05 nJ to avoid detrimental effects due to a low-energy one-photon background. The time delay has been set to zero to maximize signals.
The prominent Shockley surface state of the Ag(111) surface has been used to calibrate the energy scale of our experimental setup. According to Reinert et al. Reinert et al. (2001) it has a binding energy of 63 meV at 30 K (-point). Panagio et al. derived a somewhat less precise value of 26 meV at 300 K and, more importantly, they examined the temperature dependence of this state in the temperature range 50 - 550 K Paniago et al. (1995). Using the precise low T value of Reinert et al., and applying the observed T-dependency (Figure 5b of ref. Paniago et al. (1995)), the surface state for clean Ag(111) is expected at 59 meV below the Fermi level at our sample temperature of 90 K.
.3 Calculation details
First-principles electronic structure calculations were performed in the framework of density functional theory (DFT) using the SIESTA code Sánchez-Portal et al. (1997); Soler et al. (2002), with localized numerical atomic orbitals as a basis set, and the VASP code Kresse and Furthmüller (1996), where a plane-wave expansion is used to represent the electronic wave-functions. In the SIESTA code core electrons are replaced by norm-conserving Troullier-Martins type pseudopotentials Troullier and Martins (1991), while in VASP the so-called projector-augmented wave (PAW) method is applied Blöchl (1994); Kresse and Joubert (1999).
Since local and semilocal density functionals are known to provide a poor description of the adsorption geometry of metal-organic interfaces, here we use exchange-correlation (xc) functionals that explicitly account for long range, non-local dispersion interactions (vdW-DF2). In particular, we chose the optB88 functional by Klimes et al. Klimes et al. (2010, 2011), providing the best equilibrium lattice constant and bulk modulus for bulk silver (respectively, 4.172 Å and 119 GPa in our SIESTA calculations) among the vdW-DF2 functionals we tested. Additionally we performed calculations within the PBE-D3(BJ) scheme Grimme et al. (2010, 2011), that incorporates an empirical correction to include dispersion forces on top of the generalized gradient approximation PBE functional Perdew et al. (1996).
A scheme of periodically repeated slabs was used to describe the Ag(111) surface. To avoid direct interaction between the periodic images of the system a vacuum layer of 11 Å was included in the direction perpendicular to the surface (-direction). In order to get the final geometric structures, we allowed full relaxation of the NTCDA molecular monolayer and the two underlying Ag layers of the four-layer silver slab until the maximum force becomes less than 0.01 eV/Å. For the calculation of interface states we took slabs comprising 12 layers. According to our tests, with this increased number of layers, the energy of the IS is converged within 10 meV with respect to the slab thickness. Notice that both the SS and the IS are located within the projected band gap of Ag(111), but still rather close to the bulk bands and, thus, extend far into the substrate, requiring the use of rather thick slabs. The surface Brillouin zone was sampled using a Monkhorst-Pack scheme with 8 and 6 k-points for the relaxed and compressed phase, respectively.
For SIESTA calculations, we used a double- polarized (DZP) basis generated within the soft-confinement scheme. Silver orbital radii corresponded to an energy shift Soler et al. (2002) of 180 meV, providing 3.72 Å for the 5 orbital. For a better description of the Ag(111) surface Garcia-Gil et al. (2009) we used an enlarged range of Ag pseudoatomic orbitals for atoms in the surface (uppermost and lowermost) layers of the slab. We explicitly checked that the position of the Ag(111) surface state ceases changing when the radius of the 5 orbitals of Ag reaches a value of 5.15 Å, which corresponds to 10 meV of energy shift. The same energy shift value was used to produce the basis functions of all molecular atoms. Note that usage of extended orbitals for all the Ag atoms in the slab results in an insignificant change of the electronic properties.
A uniform mesh for numerical integration and solution of the Poisson equation was specified by an energy cutoff of 250 Ry; for structure optimization (to avoid numerical noise in the forces) this value was increased to 400 Ry. For VASP calculations, the plane-wave cut-off was fixed at 350 eV.
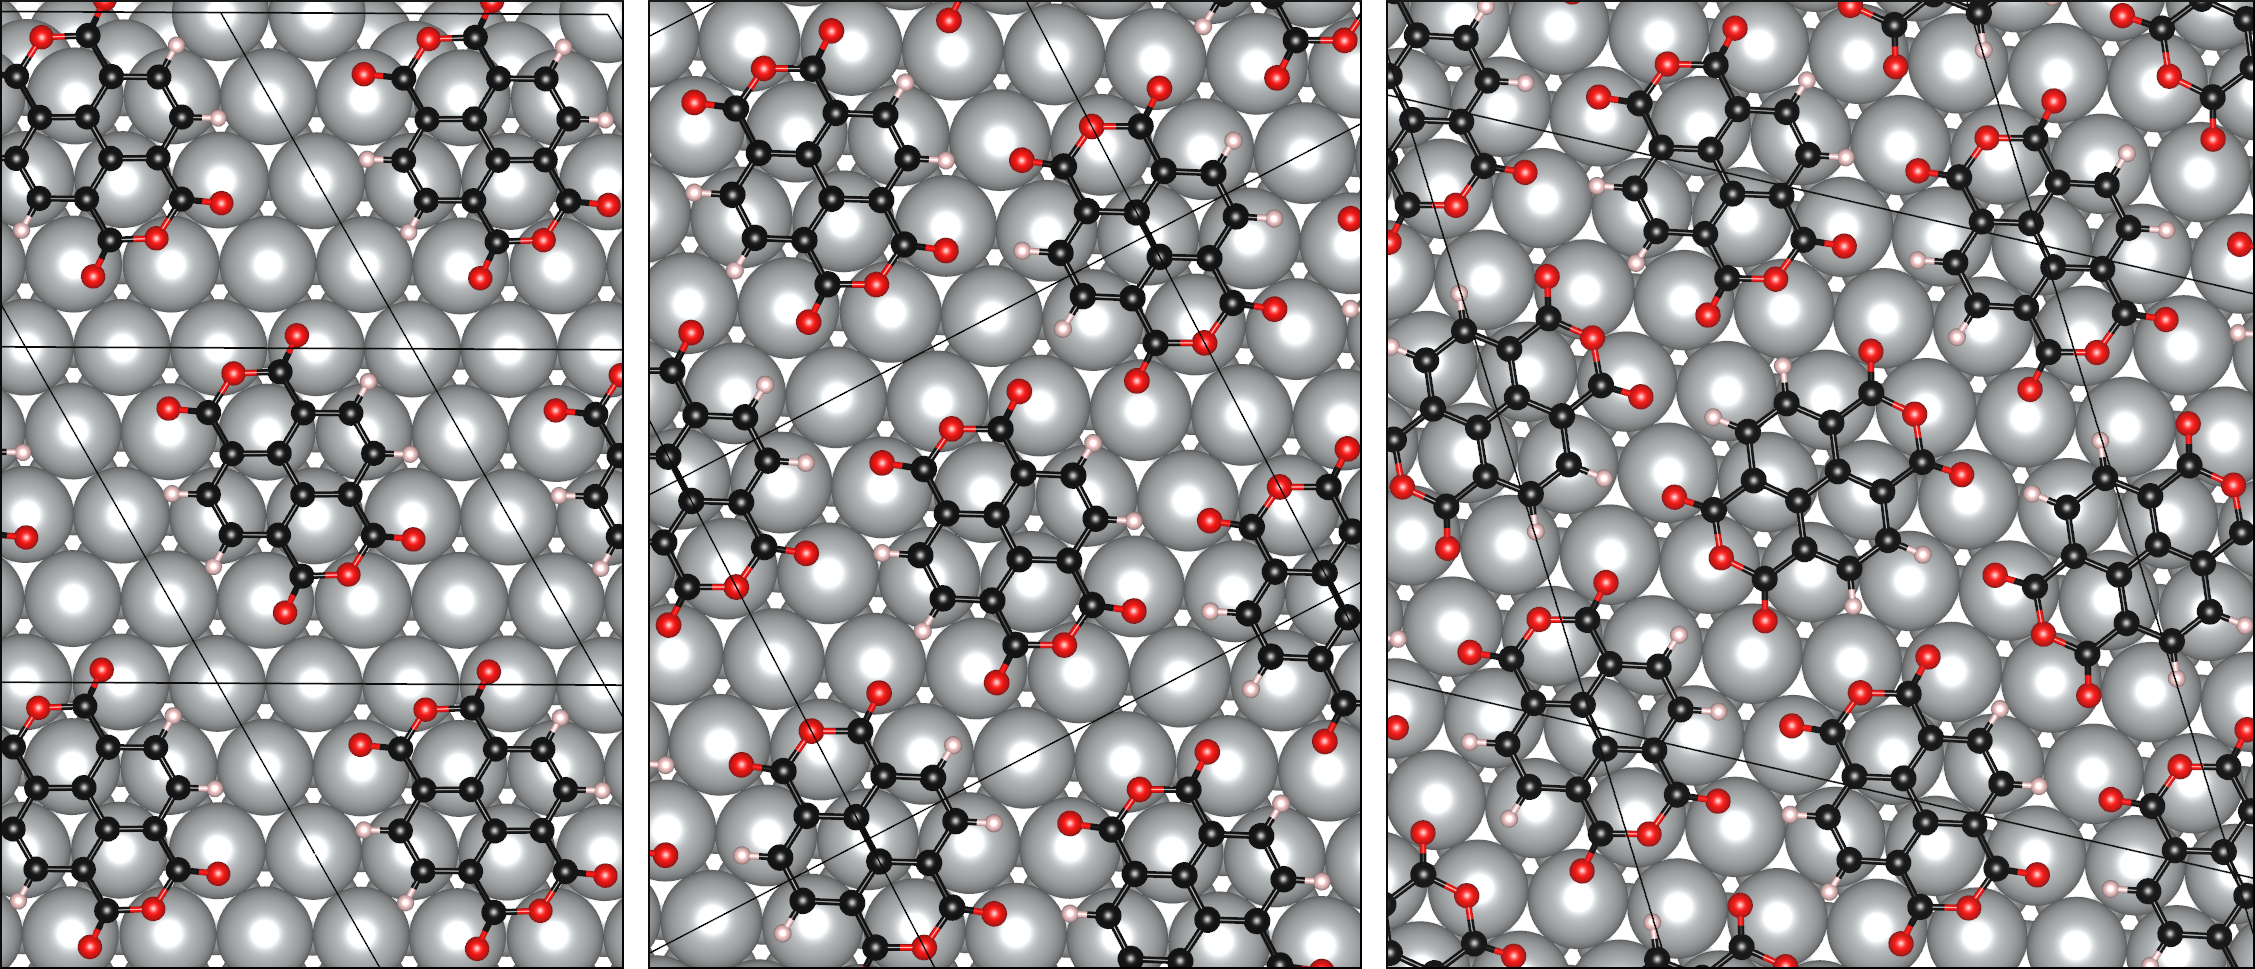
The unit cells and arrangements of the molecules within them are depicted in Figure 1. The artificially diluted (4x4) structure contains one molecule per unit cell which is located above bridge site positions of the silver substrate (molecule center), and with the central C-C bond aligned along Ag atom rows (Fig. 1 left). There are two molecules in the unit cell of r-ML. One molecule occupies a bridge site, the other one the on-top position. The unit cell of c-ML contains four molecules, two of them occupy the same adsorption sites as for the relaxed monolayer phase. The remaining two molecules are rotated by about degrees with respect to first ones and sit on bridge sites. The arrangements of the molecules in the r-ML and c-ML phases were deduced from high resolution STM images Braatz et al. (2015). The analyzed structures refer to different coverages 0.672 ML, 0.896 ML and 1 ML for the dilute (4 4), r-ML and c-ML phases, respectively; one ML is thereby defined as the maximum amount of parallel oriented NTCDA, which can be accomodated on Ag(111), i.e. for the compressed monolayer.
.4 Results
.4.1 Experimental Results
In Figure 2, 2PPE spectra of c-ML and r-ML are displayed. The NTCDA/Ag(111) sample has been prepared by NTCDA deposition at low T 80 K (for details, see the experimental section) and annealing to successively higher temperatures (and recooling thereafter for data collection); due to desorption of NTCDA in the temperature range 370 - 400 K the complete monolayer (c-ML phase) gradually transforms to the less dense r-ML phase. The image potential states of the NTCDA monolayer thereby serve as an indicator for the quality and integrity of the layers. Specifically, discrete bands associated with the two phases are observed at distinctly different energies. The n = 1, 2 image potential states of c-ML are located at 3.71 eV and 4.33 eV, and those of r-ML at 3.84 eV and 4.46 eV above , respectively (see Fig. 2). The spectrum of the clean silver is added on top of the figure for comparison. In contrast to the emission of the unpopulated interface and image potential states, the populated Shockley surface state (SS), which was used for the energetic calibration, can only be emitted by a two photon process. It appears at the final state energy positions of 6.1 eV or 7.64 eV, depending on whether the emission is induced by absorption of two blue photons eV, or one blue and one UV photon eV, respectively.
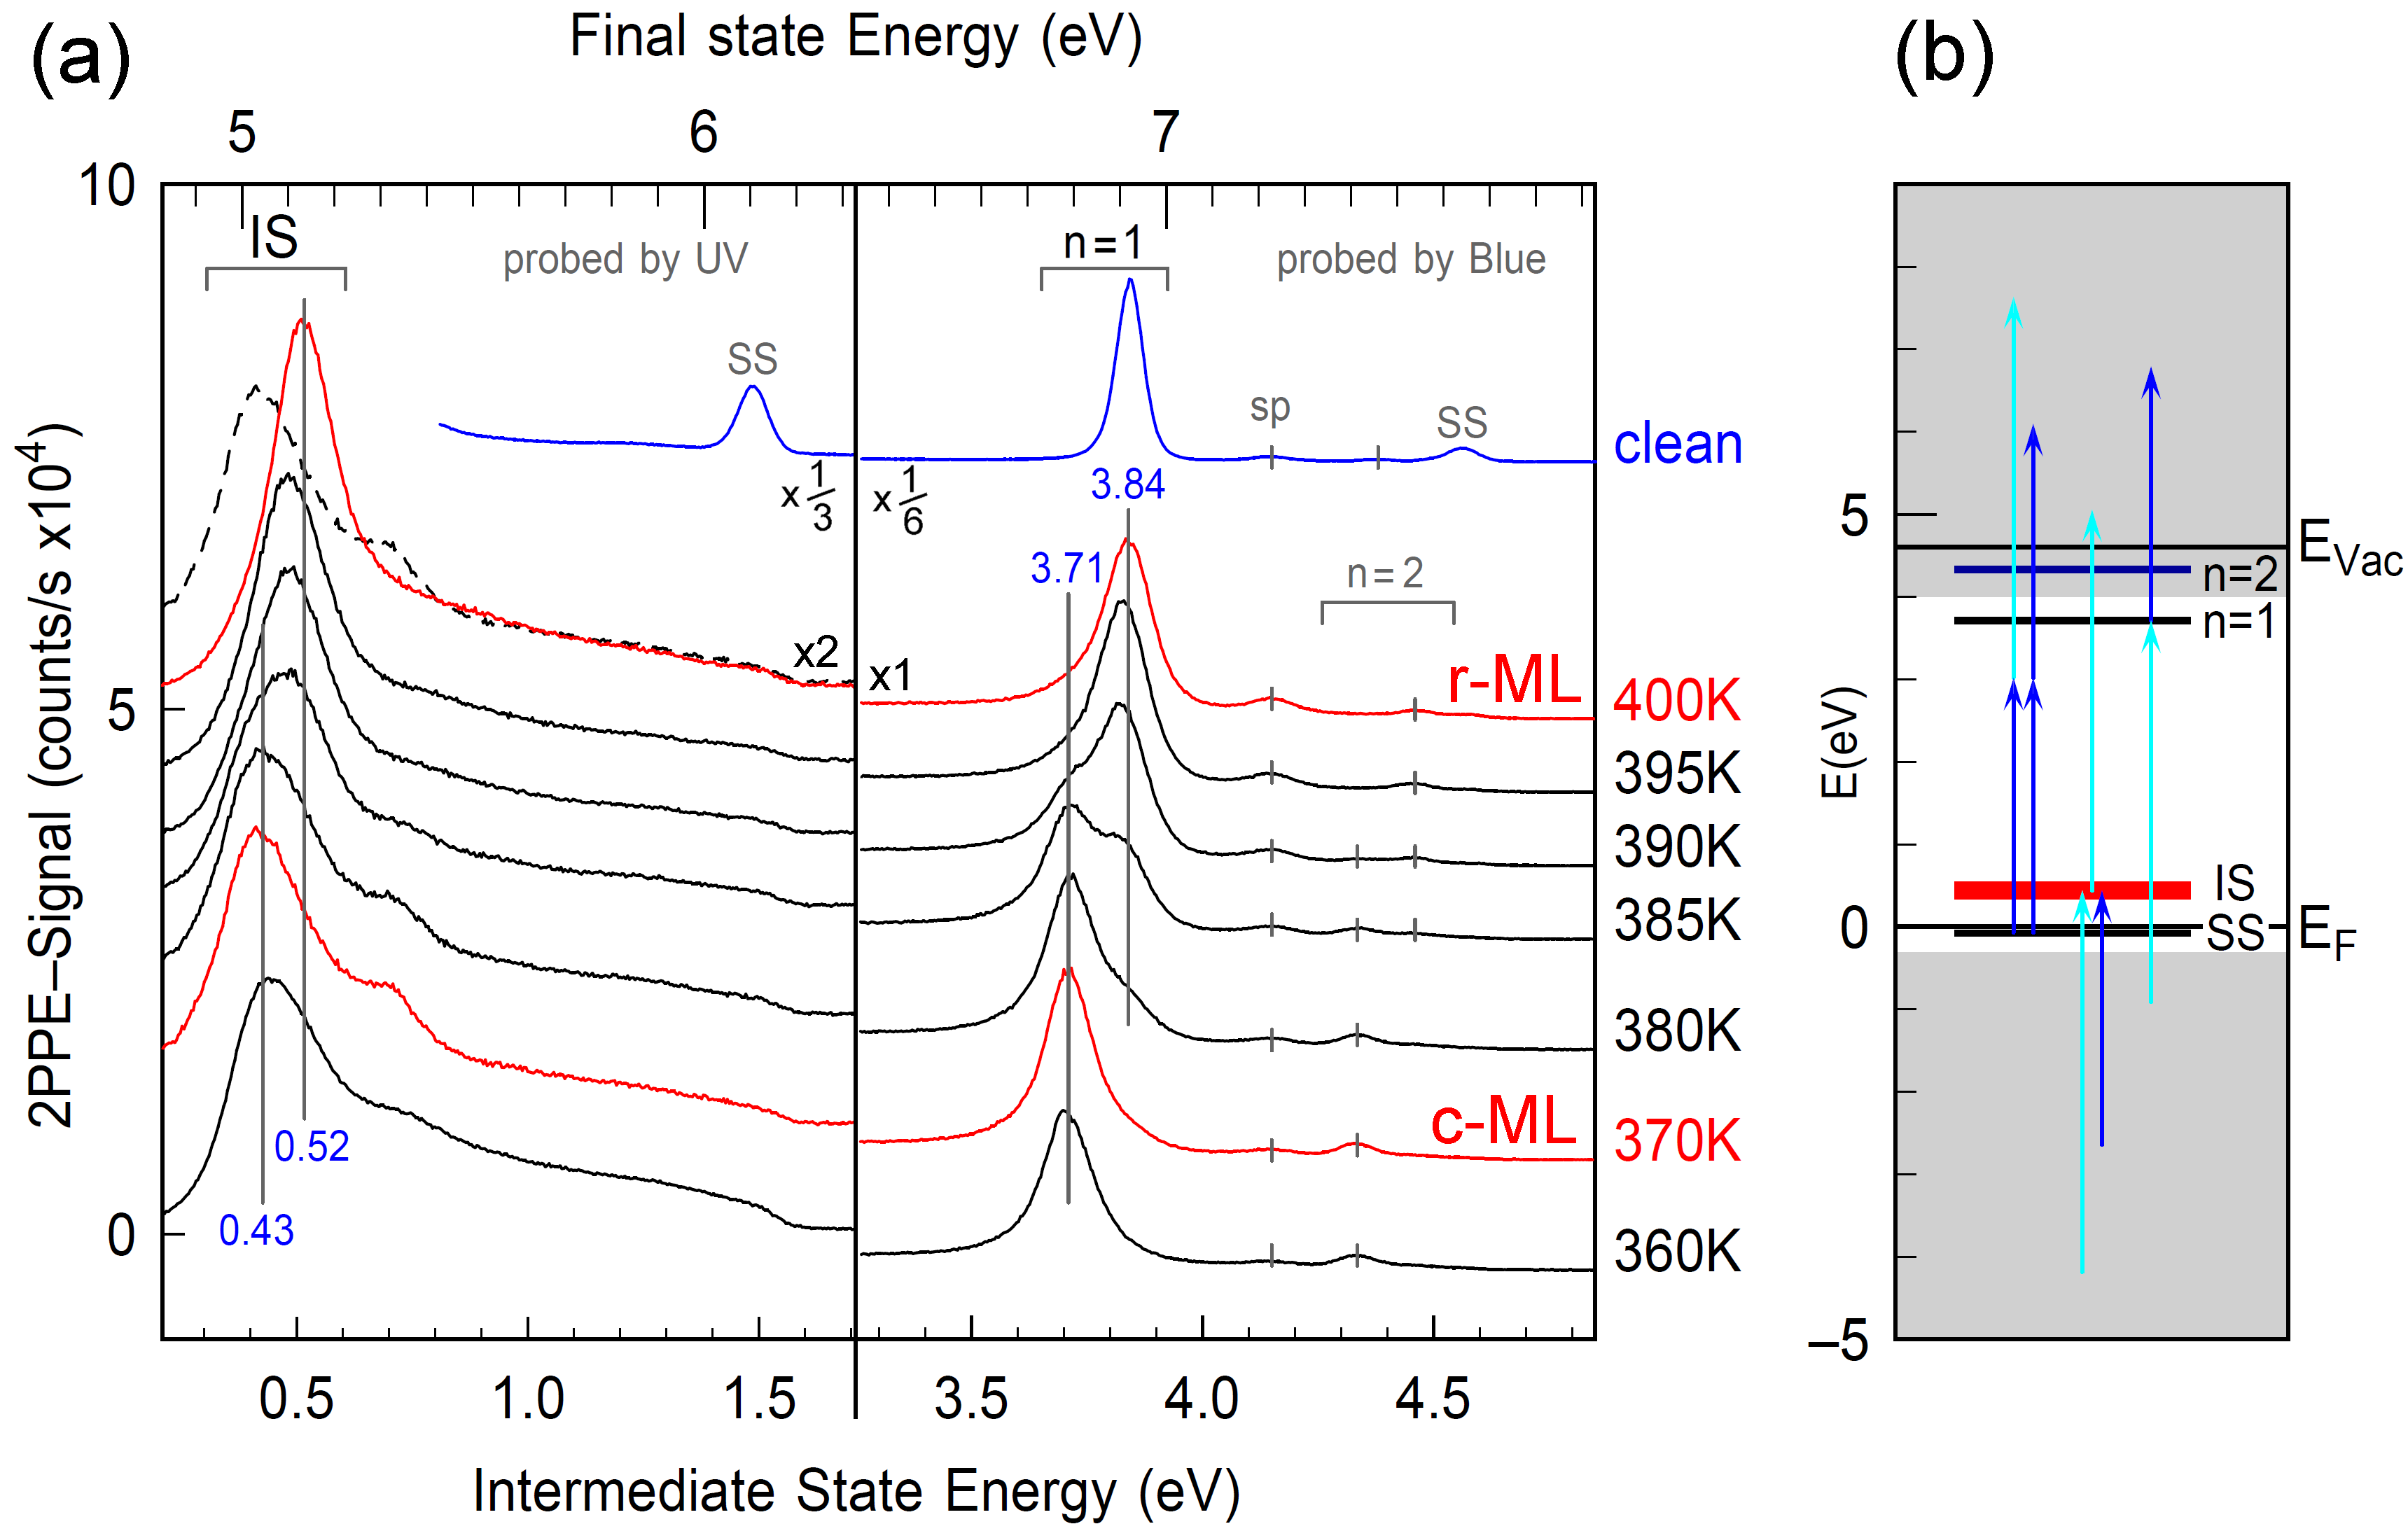
The absence of any unwanted sidebands or shoulders for n = 1, as well as the absence of the prominent Ag(111) surface state are taken as proof for the excellent quality and homogeneity of the prepared phases. Moreover, their narrow line shapes support the idea that this transition proceeds by a gradual shift of the boundary separating both phases as has been suggested by Stahl et al. Stahl et al. (1998) based on STM data.
In the region of the interface state, i.e. 0-1 eV above we identify distinct spectral features at 0.43 eV (c-ML) and 0.52 eV (r-ML). For both bands the read-out proceeds exclusively via UV absorption; excitation of electrons in this unoccupied electronic level may be achieved by means of either blue or UV light.
Comparison of the IS energies for c-ML and r-ML thus reveals a notably lower value for c-ML, which may indicate a larger vertical bonding distance of NTCDA for this phase as compared to r-ML. Since the NTCDA coverage is about 10% less for r-ML, an extrapolation to coverages equal to the c-ML phase would cause an extra upshift of the r-ML interface state energy, implying an accordingly larger difference in vertical bonding distance between the c-ML and r-ML phases.
We note that for less dense layers () empty spaces between molecules cause leakage of the IS wave function into the vacuum, leading to a lowering of . The effect of an incomplete molecular layer has been examined theoretically for an idealized, planar layer of NTCDA on Ag(111) and will be discussed in more detail below. An estimate based on these findings (extrapolation to full saturation of the monolayer) would produce a 20 - 40 meV upshift of the interface state, assuming a vertical bonding distance of 2.9 - 3.0 Å. According to the projected shift of versus vertical bonding distance of about 1.5 eV/Å Marks et al. (2014), the observed (90 meV), plus extrapolated (20-40 meV), difference in interface state energy of (110 - 130) meV for r-ML with respect to c-ML would translate into a Å closer average height of NTCDA above Ag(111) for r-ML as compared to c-ML.
This value may be compared to NIXSW literature data which have been obtained for both ordered phases of NTCDA/Ag(111) Stanzel et al. (2004); Stadler et al. (2007). For r-ML and c-ML, and data have been analyzed to derive adsorption heights (averaged over all C-atoms) of 3.02±0.02 Å for r-ML and 3.09±0.04 Å for c-ML Stanzel et al. (2004). Later on more precise values have been derived for r-ML (see Table 1). These values are notably lower than expected for pure van der Waals interacting molecular species and underline the significance of chemical interactions for NTCDA on Ag(111). This finding is also in accordance with a marked chemical shift in XPS binding energies Schöll et al. (2004) and the partial filling of the former LUMO of adsorbed NTCDA Bendounan et al. (2007). According to NIXSW findings for and core levels the planar molecular structure of NTCDA becomes warped when adsorbed on Ag(111). This has been attributed to covalent bonding of NTCDA to substrate atoms via the four carboxyl groups, in accordance with similar findings for PTCDA on Ag(111) Hauschild et al. (2005). Such covalent bonding and the accompanying downward bending of carboxyl oxygens agree favorably with the pronounced redshift of respective C=O stretching modes for NTCDA on Ag(111) Braatz et al. (2012); Tonner et al. (2016); Braatz et al. (2015).
In NIXSW data, as well as in our theoretical calculations, the extrapolated bulk positions of Ag(111) surface atoms have been used as the reference frame (). True spacings between molecule and metal then additionally comprise surface relaxation effects which may add up to values of about 0.1 Å and additionally depend crucially on the type of adsorbed species. For NTCDA/Ag(111) the difference between the extrapolated bulk position of Ag(111) and the calculated average position of Ag surface atoms amounts to 0.02 Å at most for all structures considered in this study.
Analysis of adsorbed PTCDA or NTCDA on Ag(111) Bauer et al. (2012); Tonner et al. (2016) provided clear evidence of a non-negligible relaxation of Ag surface atoms which did comprise not only an overall contraction of the vertical bonding distance but also introduced an extra corrugation of surface atoms underneath of PTCDA or NTCDA. As shown below, our calculations confirm that this is the case also for the NTCDA c-ML and r-ML phases discussed here.
To conclude this section, our observed IS energies for c-ML and r-ML are fully consistent with existing NIXSW data. The next step is therefore to use DFT to derive a model of both parallel oriented NTCDA/Ag(111) phases including their detailed adsorption geometries and, moreover, to determine the corresponding molecular electronic structure and interface state energies.
.4.2 Theoretical Results
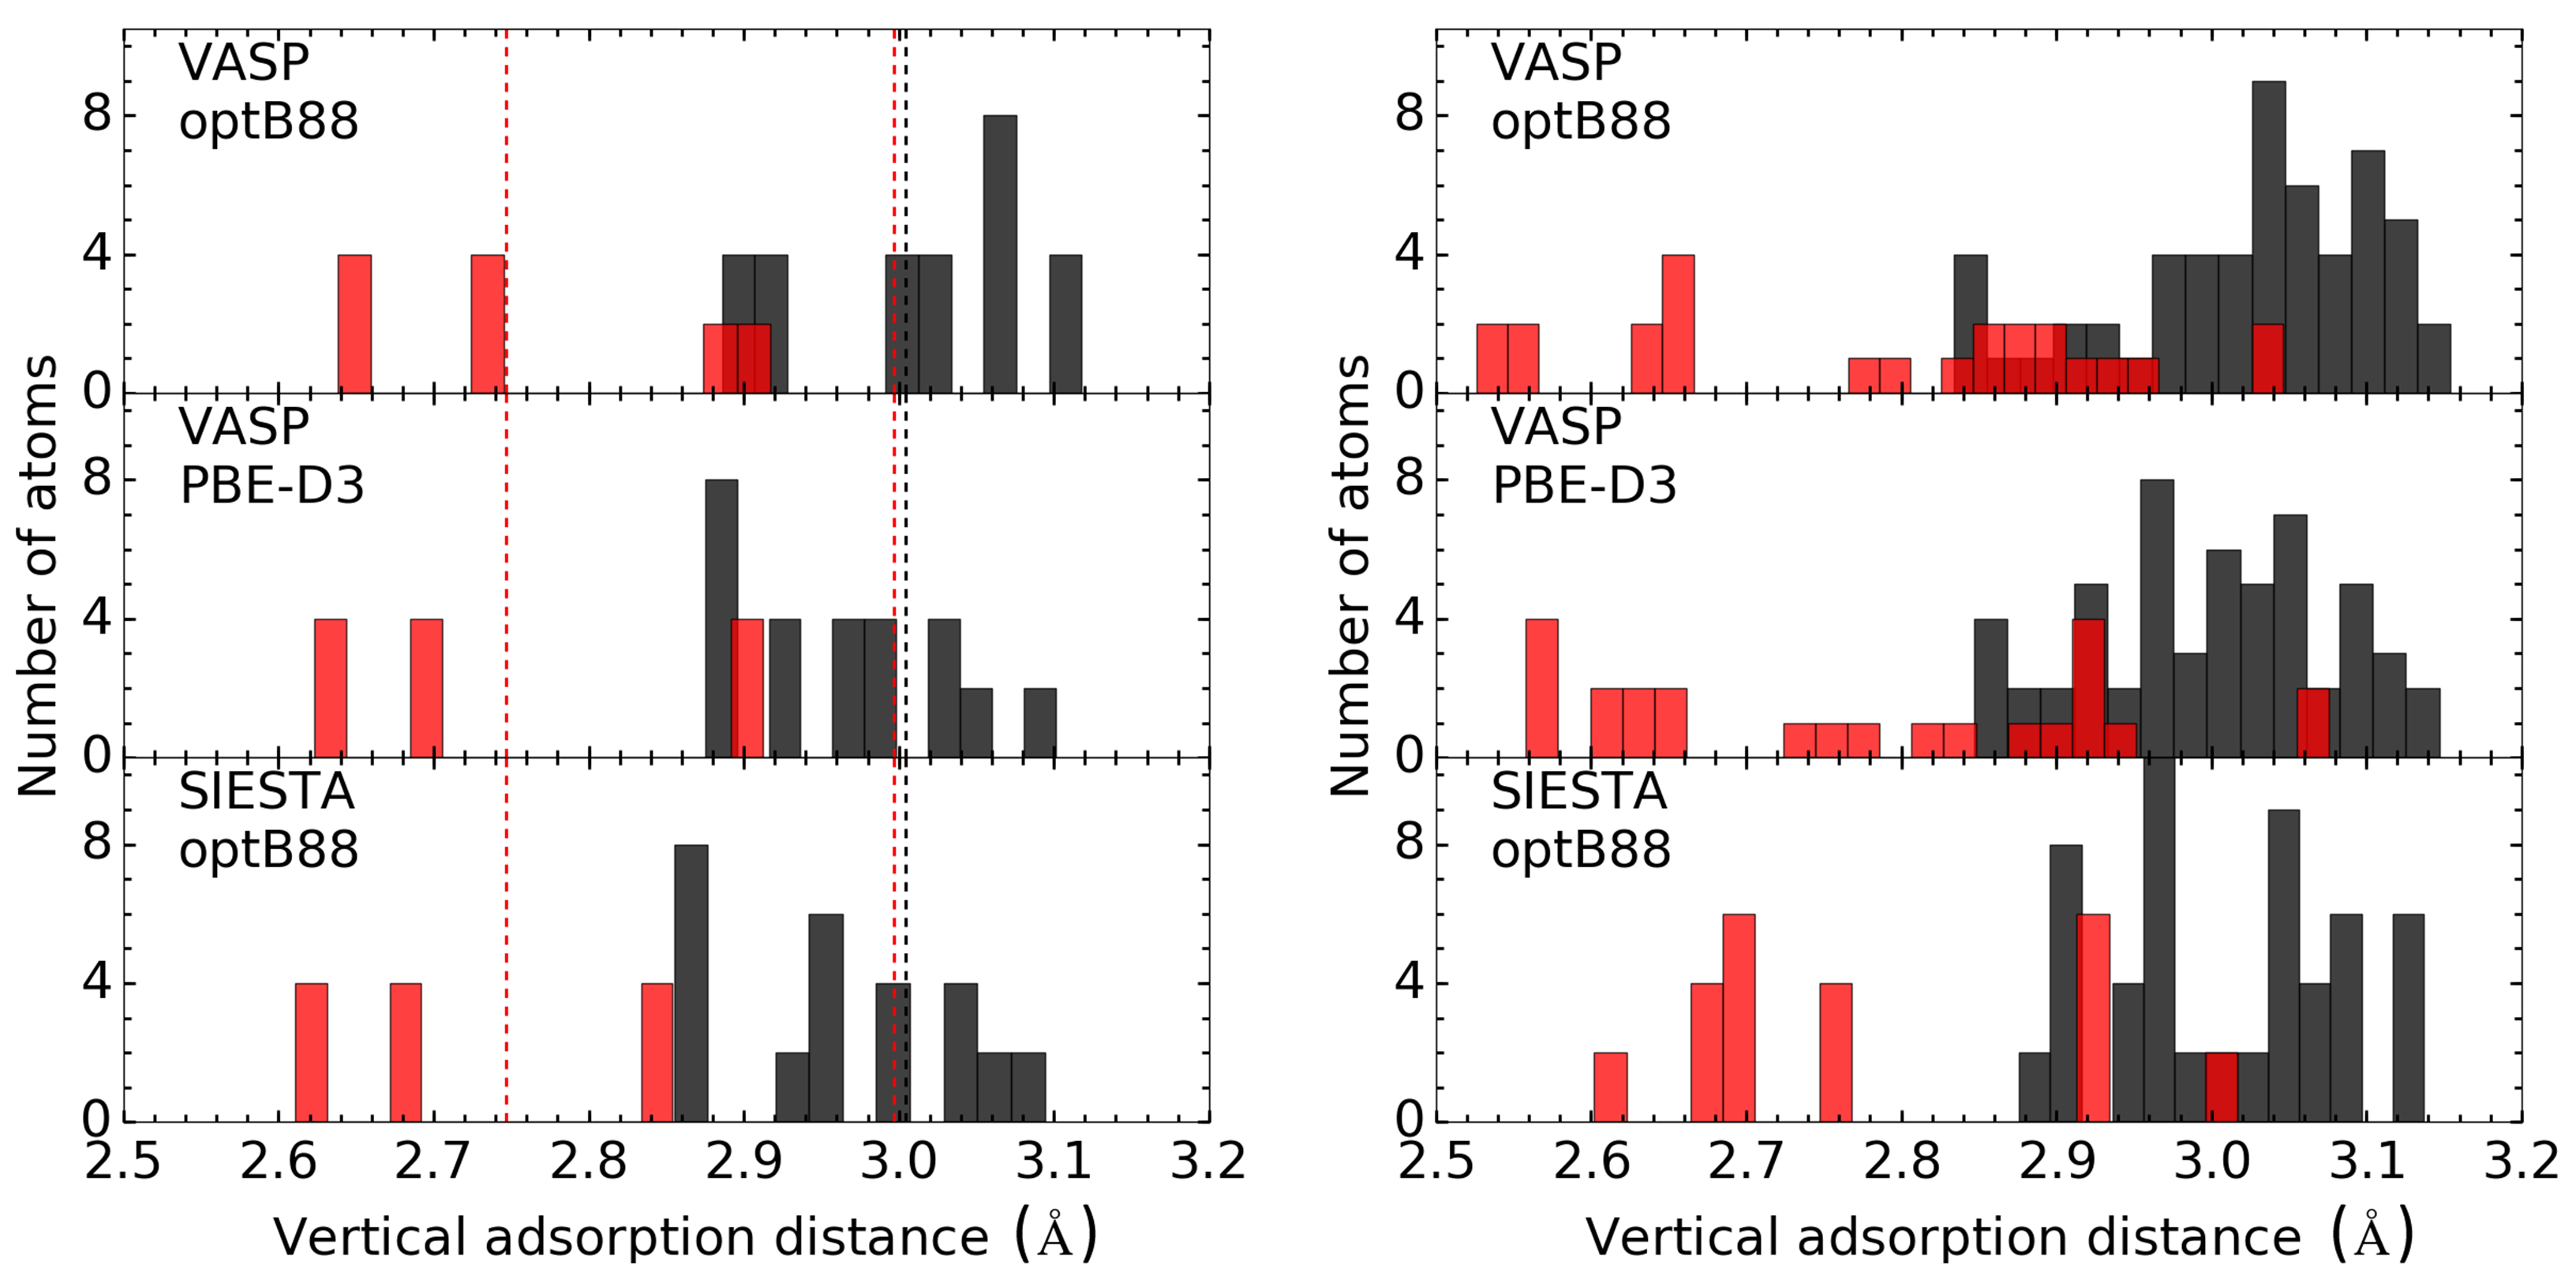
We found optimized geometries for the r-ML and c-ML phases of NTCDA on Ag(111) by means of VASP (plane waves) and SIESTA (numerical pseudoatomic orbitals) calculations performed with different schemes to take into account vdW interactions, the optB88 functional and the PBE functional plus D3 empirical dispersion corrections. Although these approximations provide slightly different bulk properties (e.g. the optB88 functional overestimates the equilibrium lattice constant) the final adsorption geometries are quite similar (Table 1).
The calculated optimal structures of the relaxed phase are in good agreement with experimental measurements (see Table 1). In accordance with NIXSW data Stanzel et al. (2004); Stadler et al. (2007) we find that the position is shifted down with respect to the carbon core, while resides at the same plane with . The vertical bonding distance of the C backbone for the bridge molecule is 0.02 Å higher than for the one at on-top sites. The (vertical) distortion along the long axis of NTCDA, i.e. , is about 0.15 Å, while the distortion along the short axis, i.e , amounts to 0.1 Å for both type of molecules. In general, the overall bending of the on-top molecule is somewhat smaller than that of bridge bonded NTCDA by 0.1 Å (see Table 1), and the respective values seem largely independent of the choice of the xc-functional. As we are not sure how the averaging of individual signals is contributing to the experimental values of carbon vertical distances we should not be overly concerned regarding residual differences, since the overall agreement is very good.
| Siesta: optB88 | Vasp: optB88 | Vasp: PBE-D3 | exp111NIXSWStadler et al. (2007) | |||||||
| Å | Å | Å | Å222Experimental value corrected for zero-point energy effects Csonka et al. (2009) | |||||||
| top | bridge | top | bridge | top | bridge | |||||
| 3.06 | 3.09 | 3.11 | 3.12 | 3.05 | 3.10 | |||||
| 3.01 | 3.03 | 3.06 | 3.06 | 3.00 | 3.04 | 2.997 | ||||
| 2.94 | 2.96 | 3.02 | 3.01 | 2.93 | 2.96 | |||||
| 2.86 | 2.87 | 2.92 | 2.89 | 2.88 | 2.88 | |||||
| 2.69 | 2.61 | 2.73 | 2.64 | 2.69 | 2.63 | 2.747 | ||||
| 2.85 | 2.85 | 2.92 | 2.89 | 2.91 | 2.90 | 3.004 | ||||
| 2.91 | 2.93 | 3.0 | 2.99 | 2.91 | 2.94 | |||||
| 0.32 | 0.42 | 0.33 | 0.42 | 0.31 | 0.41 | |||||
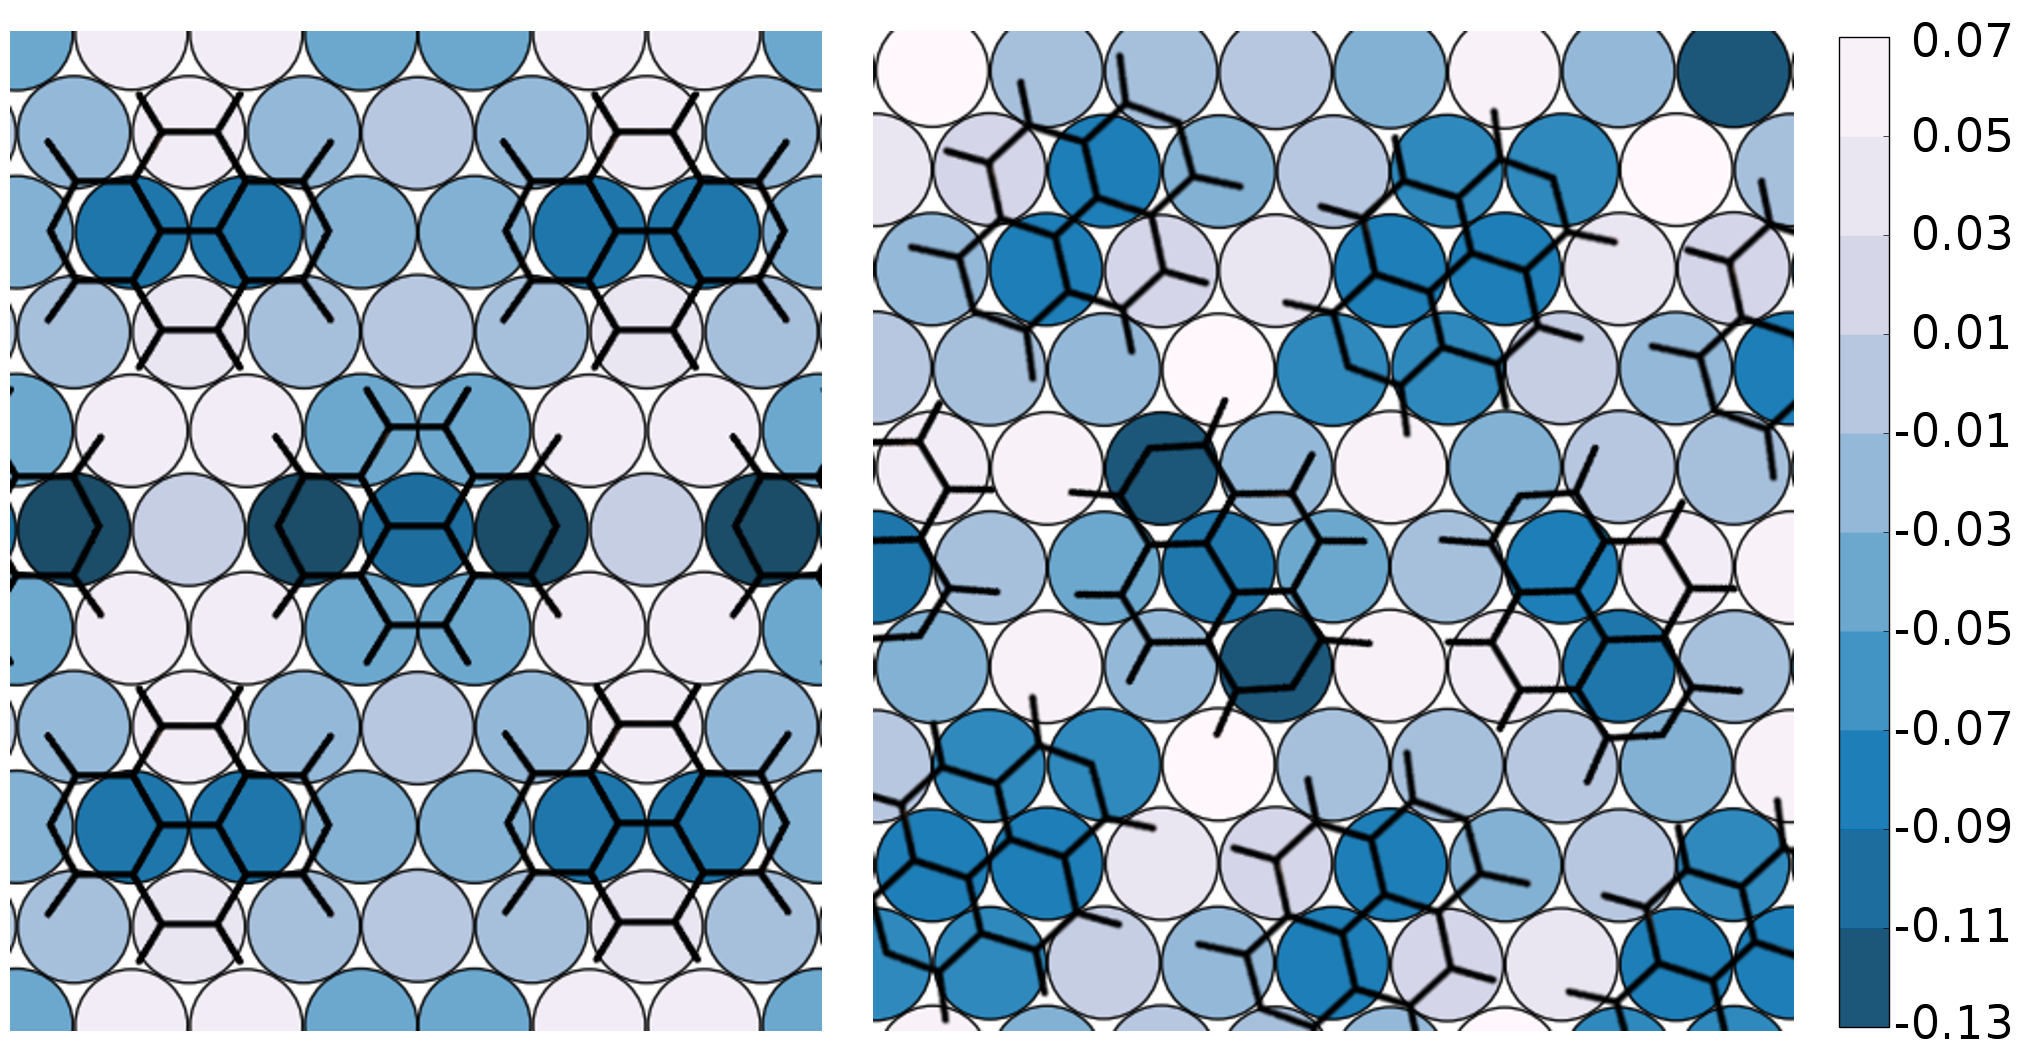
A graphical illustration of vertical positions of the various functional groups of the NTCDA molecule within the relaxed and the compressed phase is provided in Figure 3. Again the three different theoretical approaches (see Table 1) have been applied. In accordance with available experimental data Stanzel et al. (2004), the vertical height of the carbon core is slightly larger ( 0.05 Å) for c-ML as compared to r-ML. In general, our calculations, however, display similar adsorption geometries for the two phases of NTCDA/Ag(111) (Fig. 3). This in particular applies to the aligned bridge and on-top adsorbed NTCDA molecules of c - ML, i.e. those with identical coordination to the Ag(111) surface atoms as in the r-ML phase; interestingly, even the silver atoms underneath these NTCDA are subject to virtually the same modification (see Fig. 4). Within the c-ML the bridge and on-top molecules are slightly rotated by with respect to the molecules of the relaxed monolayer phase (which are strictly aligned along the Ag substrate atoms); in fact, our finding of a lower total energy for a slightly rotated molecular arrangement is in accordance with the local symmetry () experienced by the individual NTCDA within the c-ML molecular layer. This is actually the reason why the bridge bonded molecules become slightly twisted with respect to their diagonal. The remaining two inequivalent molecules within the c-ML phase, one of which lies at the center and another one at the edge of the drawn unit cell (Fig. 1), they both occupy bridge sites, however, with a strong azimuthal misorientation with respect to Ag(111) atom rows, and which leads to a twisting of their molecular planes as well.
The molecule-substrate interaction causes not only a distortion of the molecules but, additionally, a noticeable corrugation of the silver surface layer, especially for the on-top molecule. The attractive interaction of carboxylic oxygens with underneath silver atoms pulls them out from their ideal plane. Carbon atoms on the longitudinal axis and anhydride oxygens, on the other hand, push the underlying silver atoms downwards towards the bulk (Fig. 4), indicative for a repulsion between them. In case of the bridge molecule we observe a similar trend but with smaller displacements. Thus, the overall interaction between the molecules and the substrate comprises two major contributions, similar to the case of PTCDA monolayers on different Ag surfaces Bauer et al. (2012): Specifically, the derived geometry is determined by the interplay between attraction of the functional groups with silver atoms, repulsion of the carbon backbone from the substrate and the ability of the molecule and the surface to accommodate such distortions.
The surface and interface state energies ( and ) for r-ML and c-ML phases are presented in Table 2. It is apparent that the absolute position of the interface states and the difference between the energy of SS and IS is directly dependent on the lattice parameter of the substrate. Bigger lattice constants provide higher absolute positions of SS and IS and somewhat smaller values of (Table 2). Calculations performed with the same xc-functional, but with various choices of basis function types (and codes) give similar values for . In general, it is difficult to compute the absolute positions of IS and SS accurately (slabs containing a very large number of atomic layers are required), or to determine the with high precision (very dense k-sampling required in combination with the large supercells used here), because very large computational resources are needed, especially in the case of plane wave calculations.
For a meaningful description and comparison of the two NTCDA phases the applied methods of calculation should use the same parameters. Moreover, the importance of using as a reference scale for is apparent from Table 2: Values of are found in better agreement with the experiment in this case. The improved accuracy of thus obtained interface state energies is attributed to a compensation of (calculation) errors in deriving and values and the well known energetic position (experiment) of the Ag(111) surface state Reinert et al. (2001); Paniago et al. (1995).
| XC | ||||||||||||
|---|---|---|---|---|---|---|---|---|---|---|---|---|
| 44 | relaxed ML | compressed ML | ||||||||||
| VASP | optB88 ( Å ) | 433 | -72 | 505 | 481 | -54 | 535 | |||||
| PBE-D3 ( Å) | 424 | -164 | 588 | 450 | -157 | 607 | ||||||
| Siesta | optB88 ( Å) | 445 | -8 | 453 | 540 | 0 | 540 | 554 | -5 | 559 | ||
| PBE-D3 ( Å) | 468 | -137 | 605 | 480 | -153 | 633 | ||||||
The computed values for in Table 2 must be compared with our experimental value (assuming -59 meV at T = 90 K) of 490 meV and 580 meV for the c-ML and r-ML phases respectively. Taking into account the difficulties in the calculations commented above, the agreement with the data in Table 2 can be considered quite good.
Remarkably, and contrary to the experimental data, our calculations predict the IS to be somewhat higher for the compressed layer, following the usually observed trend of the IS to upshift with increasing coverage. This trend is further confirmed by the computed data presented for the more dilute hypothetical 44 phase. According to these data increases by 90 meV when the coverage increases from 0.672 ML (44) to 0.895 ML (r-ML), and by additional 20 meV when increasing the coverage up to 1 ML for the c-ML phase.
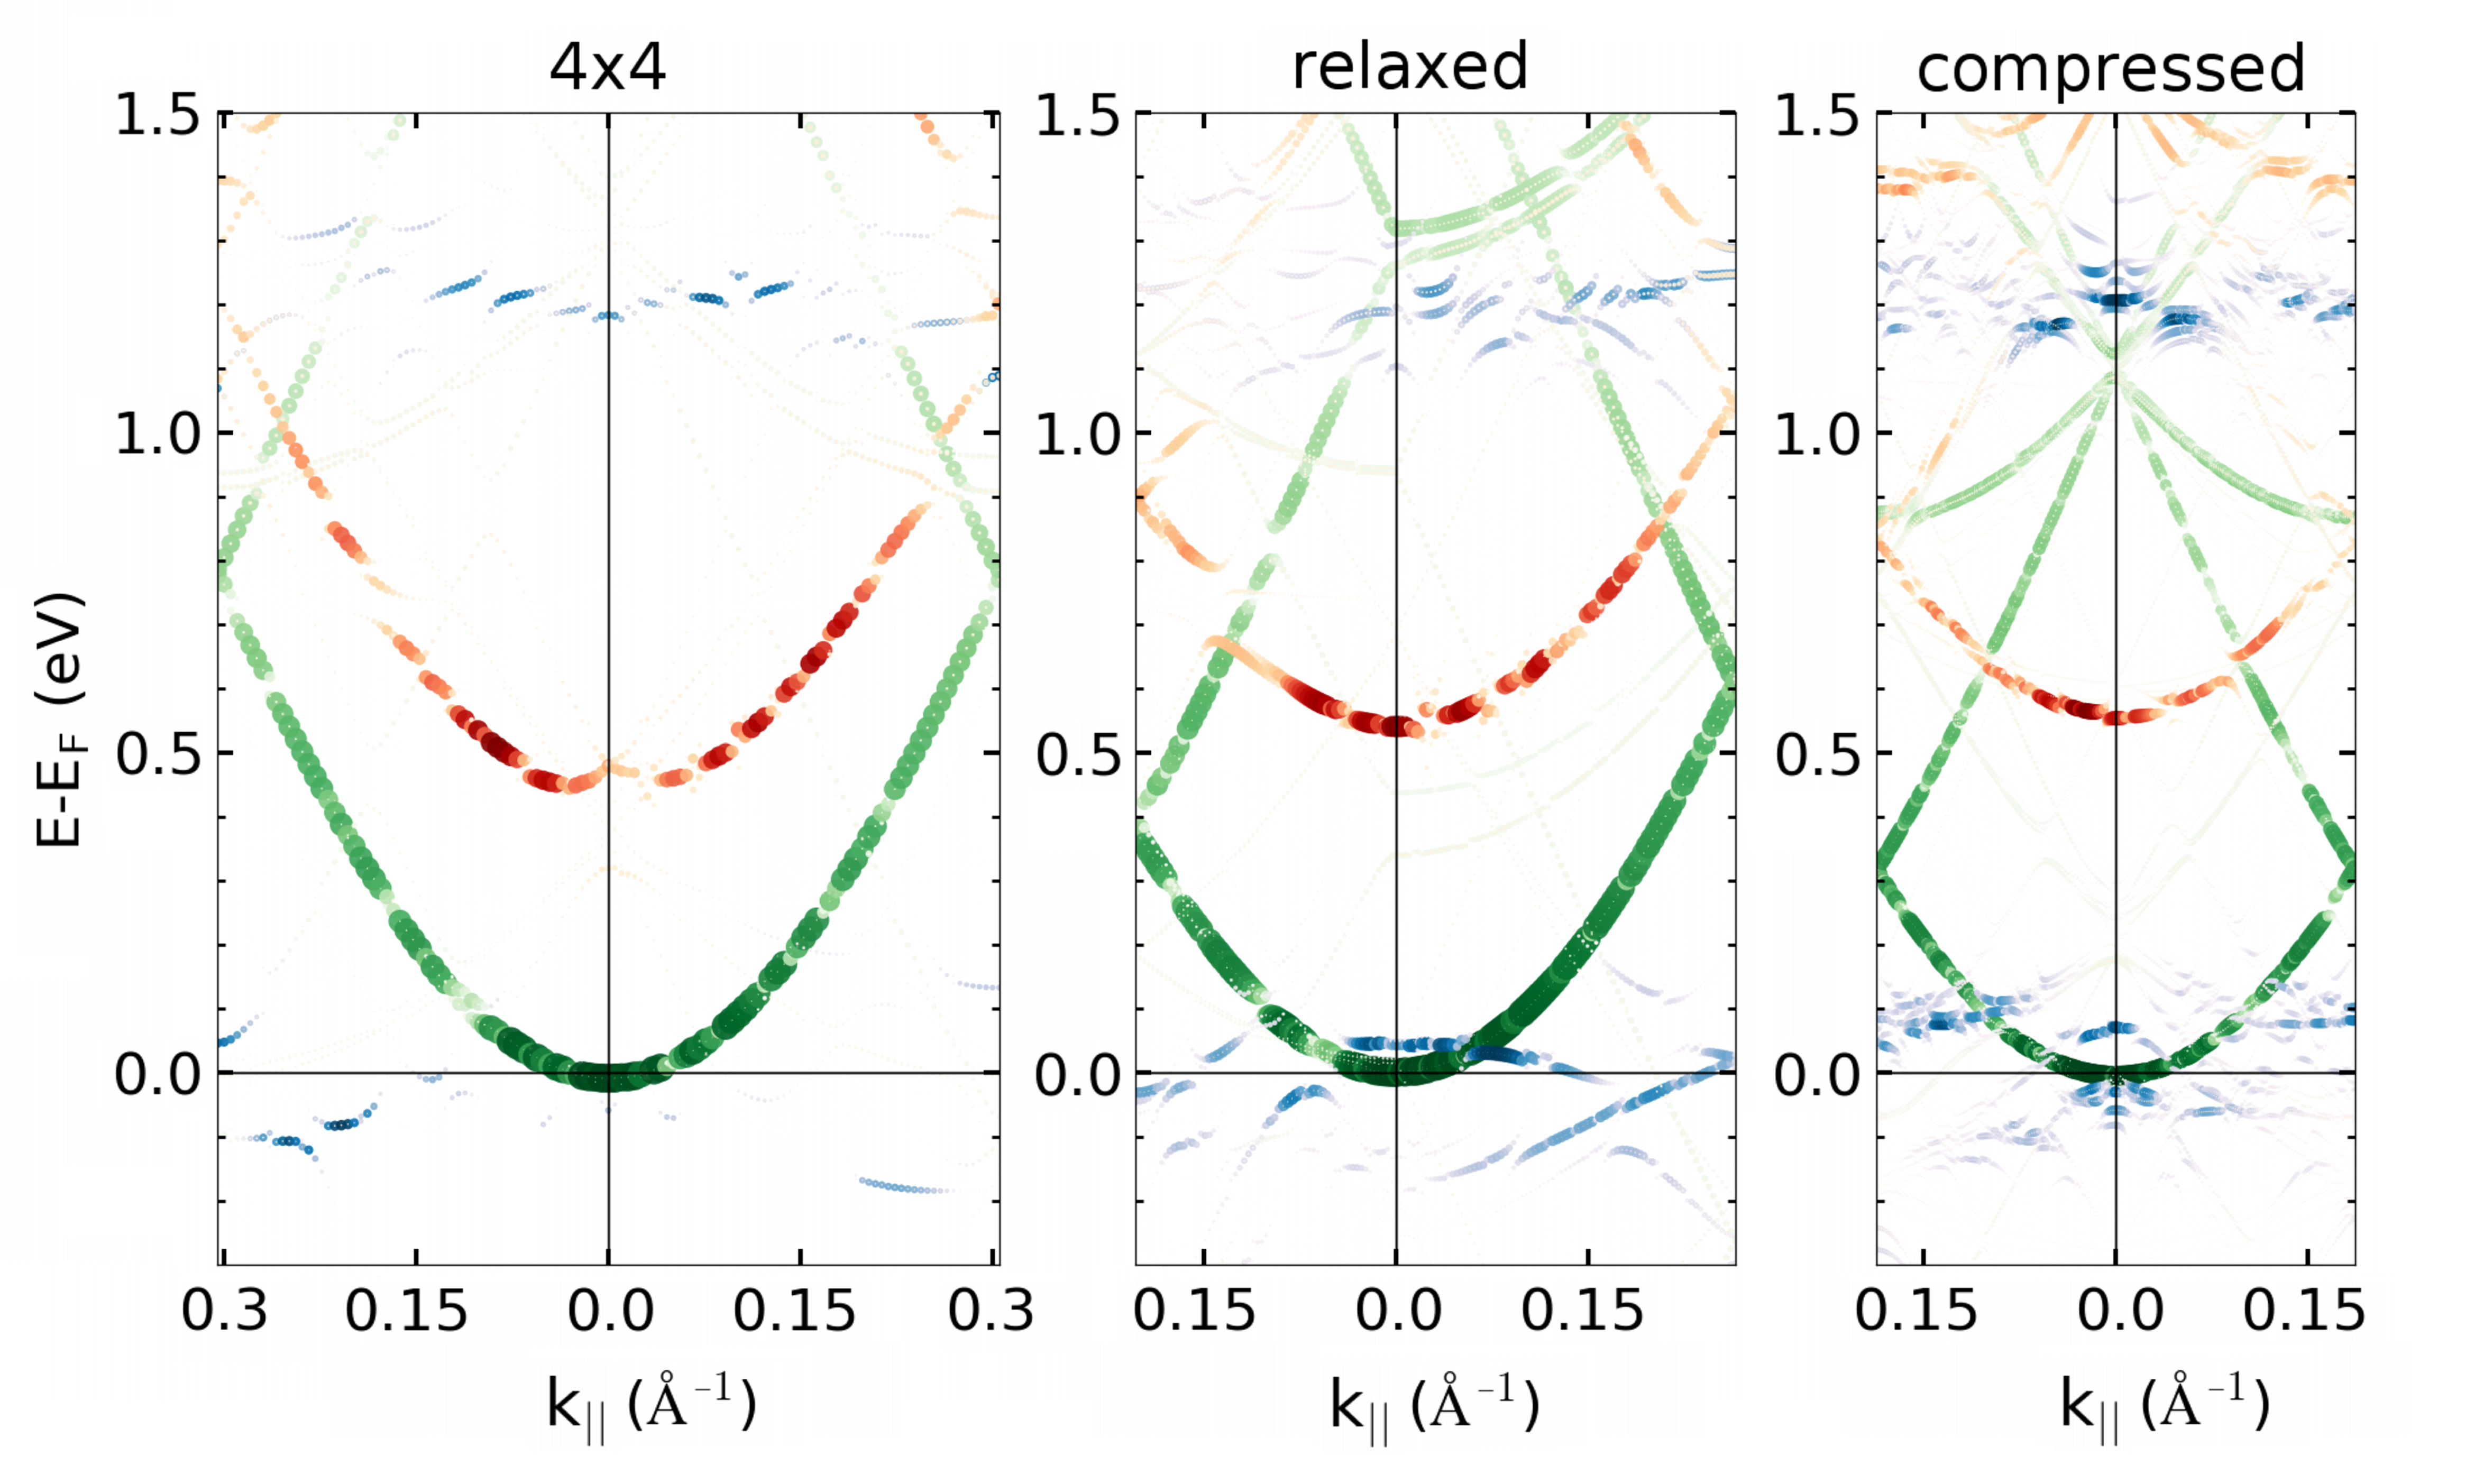
Figure 5 presents the corresponding band structures for the three studied structures. We identify an upshift of the IS with coverage to take place despite an enlargement of the vertical adsorption distances. Specifically, the functional group for the 44 phase is located distinctly closer to the substrate (: 2.53 Å; : 2.77 Å; : 2.8 Å) in comparison with r-ML (see table 1). This should lead to a raising of the IS energy Zaitsev et al. (2012); however, this contribution apparently is noticeably weaker as compared to the effect of coverage.
The comparatively smaller increase of the IS energy when going from r-ML to c-ML is most likely due to the somewhat higher average positions of the molecules in the c-ML phase, as discussed in conjunction with Fig. 3. The larger distance to the substrate thus tends to compensate the effect of the increasing coverage. Note, that the effective mass of the IS is about the same for all structures considered here (), and it is slightly bigger than the mass of the SS ().
The competition between the effect of the molecular height and that of the coverage on the IS energy is explored in more detail in Table 3. Here we used a flat NTCDA monolayer, for which the molecular height over the silver surface can be defined unambigeously, and explore the dependence of the energy position of the IS for molecular layers arranged both according to the r-ML and the c-ML phases. In this simplified model we neglect the bending of the molecules.
| [Å] | [meV] | ||
|---|---|---|---|
| relaxed | compressed | ||
| 2.9 | 495 | 532 | |
| 3.0 | 428 | 447 | |
| 3.1 | 368 | 376 | |
| 3.2 | 312 | 316 | |
| 3.3 | 265 | 267 | |
We note that, even for the unrelaxed layers, the optimal height of the molecules over the Ag(111) substrate is close to that found for the carbon molecular framework for the fully optimized structures. Regarding the energy of the IS, for a given they are always higher for the compressed ML, especially for vertical distances 3.1 Å. Increasing to 3.2 Å and beyond, on the other hand, yields only minor differences. For a fixed (in the range 2.9 - 3.3 Å), the effect of the larger coverage of c-ML produces shifts in the range from 2 to 37 meV.
Interestingly, the data in Table 3 tell that, comparatively, the effect of the molecular height on the IS position is more important than that of coverage for NTCDA/Ag(111) and related systems. Over the full range of distances explored, a change of 0.1 Å produces shifts of the IS energy ranging from 47 to 67 meV for the r-ML phase, and from 49 to 85 meV for the c-ML. Therefore, we can conclude that small height changes might easily compensate the effect of the coverage, and that the effect of the molecular height is somewhat larger for the c-ML phase. Measurements Stanzel et al. (2004); Stadler et al. (2007) indicate that the vertical adsorption distance of the carbon atoms in the relaxed monolayer phase is close to 3.0 Å while it is slightly lower than 3.1 Å for the compressed phase. Taking those heights and using the corresponding data in Table 3 (highlighted in bold format) we find that this height difference is sufficient to justify a 50 meV higher position for the IS of the r-ML phase, thus, largely compensating the effect of the coverage and bringing the calculated results in qualitative agreement with the experimental observation. The failure of the DFT approaches to fully account for the experimental findings (e.g. underestimating the difference in for c-ML and r-ML) is probably due to the limitations of the present functionals in describing the delicate interplay between the increased inter-molecular interactions in the compressed layer and the molecule-substrate interactions.
Therefore, our observation of a higher position of the IS for r-ML as compared to c-ML can be interpreted as an indication that the vertical separation for c-ML is notably larger than for r-ML. This causes a compensation of the upshift of due to coverage. According to the experimental findings, which yield a value of which is about 90 meV higher for r-ML as compared to c-ML, this compensation effect might be even larger than the estimates in the preceding paragraph. A much closer molecule-metal separation for r-ML is also consistent with the higher adsorption energy for this phase, as deduced from thermal desorption data Braatz et al. (2012).
.5 Summary
For the model system NTCDA/Ag(111), the properties of the interface state (IS) of the relaxed and the compressed monolayer phases have been investigated using density-functional theory and two-photon photoemission.
The dependence of the relaxed equilibrium configurations of the two NTCDA layers, and the corresponding energies of the IS, on two different approaches to include dispersive van der Waals interactions and two DFT implementations has been analyzed in detail. From a methodological point of view it is found that the energies of the surface state and IS are very dependent on the specifics of the calculations (e.g. through the different equilibrium lattice parameter with different computational approaches) and are very hard to converge (e.g. with respect to the number of layers in the slab). However, the errors in the energies of the surface state and interface state tend to cancel and the relative position of the IS with respect to the SS, , is a more robust outcome of the calculation and provides the best way to compare against experimental information, especially since is known very accurately from the experiments.
Two-photon-photoemission results provide accurate measurements of the energies of the IS, giving values of of 490 meV and 580 meV respectively for the compressed and relaxed phases. These results are in reasonable agreement with the computed values. However, DFT calculations using the optimized geometries are unable to reproduce the counter-intuitive result that is higher for r-ML, in spite of its lower coverage . DFT calculations predict that is roughly the same for both r-ML and c-ML, with only 20 meV higher for the compressed layer. This small effect of the coverage difference can be understood from the higher average position of the molecules over the Ag(111) surface in the c-ML phase than in the r-ML. This also points to this height difference as the explanation for the experimental observation of a higher for r-ML.
In order to arrive at a fundamental and thorough understanding of this interrelationship, and in an effort to bring together structural and spectroscopic information, the dependence of with vertical bonding distances and the surface coverage has been analyzed. While the coverage contributes substantially to determine the value of (especially for vertical bonding distances 3.1 Å), the impact of the molecular height is even larger in the relevant range. Our calculations show that height differences in the order of = 0.1 Å, i.e. consistent with the experimental information available for the geometries of r-ML and c-ML phases, are sufficient to compensate the effect of the coverage difference and explain an higher for r-ML than for c-ML.
Given the fact that the energetic position of for molecular layers on metal substrates depends crucially on various geometric as well as electronic properties (both of the molecule and the substrate surface layer) the found good agreement between the theoretically calculated interface energies and experimentally observed values is exceptional. This underlines the thorough understanding of molecule-metal interactions and the high accuracy that DFT methodologies are acquiring which, in particular, benefit from the inclusion of advanced van der Waals correction schemes.
Acknowledgements.
This work is a project of the SFB 1083 ”Structure and Dynamics of Internal Interfaces” funded by the Deutsche Forschungsgemeinschaft (DFG). DSP acknowledges support from the Spanish MINECO (Grant No. MAT2013-46593-C6-2-P).References
- Temirov et al. (2006) R. Temirov, S. Soubatch, A. Luican, and F. S. Tautz, Nature 444, 350 (2006).
- Schwalb et al. (2008) C. H. Schwalb, S. Sachs, M. Marks, A. Schöll, F. Reinert, E. Umbach, and U. Höfer, Phys. Rev. Lett. 101, 146801 (2008).
- Dyer and Persson (2010) M. S. Dyer and M. Persson, New Journal of Physics 12, 063014 (2010).
- Zaitsev et al. (2010) N. L. Zaitsev, I. A. Nechaev, and E. V. Chulkov, Journal of Experimental and Theoretical Physics 110, 114 (2010).
- Marks et al. (2011) M. Marks, N. L. Zaitsev, B. Schmidt, C. H. Schwalb, A. Schöll, I. A. Nechaev, P. M. Echenique, E. V. Chulkov, and U. Höfer, Phys. Rev. B 84, 081301 (2011).
- Zaitsev et al. (2012) N. L. Zaitsev, I. A. Nechaev, P. M. Echenique, and E. V. Chulkov, Phys. Rev. B 85, 115301 (2012).
- Tsirkin et al. (2015) S. S. Tsirkin, N. L. Zaitsev, I. A. Nechaev, R. Tonner, U. Höfer, and E. V. Chulkov, Phys. Rev. B 92, 235434 (2015).
- Henze et al. (2007) S. K. M. Henze, O. Bauer, T.-L. Lee, M. Sokolowski, and F. S. Tautz, Surface Science 601, 1566 (2007).
- Hauschild et al. (2005) A. Hauschild, K. Karki, B. C. C. Cowie, M. Rohlfing, F. S. Tautz, and M. Sokolowski, Phys. Rev. Lett. 94, 036106 (2005).
- Bauer et al. (2012) O. Bauer, G. Mercurio, M. Willenbockel, W. Reckien, C. Heinrich Schmitz, B. Fiedler, S. Soubatch, T. Bredow, F. S. Tautz, and M. Sokolowski, Phys. Rev. B 86, 235431 (2012).
- Ziroff et al. (2009) J. Ziroff, P. Gold, A. Bendounan, F. Forster, and F. Reinert, Surface Science 603, 354 (2009).
- Galbraith et al. (2014) M. C. E. Galbraith, M. Marks, R. Tonner, and U. Höfer, The Journal of Physical Chemistry Letters 5, 50 (2014).
- Marks et al. (2014) M. Marks, A. Schöll, and U. Höfer, Journal of Electron Spectroscopy and Related Phenomena 195, 263 (2014).
- Stahl et al. (1998) U. Stahl, D. Gador, A. Soukopp, R. Fink, and E. Umbach, Surf. Sci. 414, 423 (1998).
- Kilian et al. (2008) L. Kilian, U. Stahl, I. Kossev, M. Sokolowski, R. Fink, and E. Umbach, Surf. Sci. 602, 2427 (2008).
- Stanzel et al. (2004) J. Stanzel, W. Weigand, L. Kilian, H. L. Meyerheim, C. Kumpf, and E. Umbach, Surface Science 571, L311 (2004).
- Stadler et al. (2007) C. Stadler, S. Hansen, A. Schöll, T.-L. Lee, J. Zegenhagen, C. Kumpf, and E. Umbach, New Journal of Physics 9, 50 (2007).
- Bendounan et al. (2007) A. Bendounan, F. Forster, A. Schöll, D. Batchelor, J. Ziroff, E. Umbach, and F. Reinert, Surface Science 601, 4013 (2007).
- Braatz et al. (2012) C. R. Braatz, G. Öhl, and P. Jakob, The Journal of Chemical Physics 136, 134706 (2012).
- Tonner et al. (2016) R. Tonner, P. Rosenow, and P. Jakob, Phys. Chem. Chem. Phys. 18, 6316 (2016).
- Braatz et al. (2015) C. R. Braatz, T. Esat, C. Wagner, R. Temirov, F. S. Tautz, and P. Jakob, Surface Science 643, 98 (2015).
- Sachs et al. (2009) S. Sachs, C. H. Schwalb, M. Marks, A. Schöll, F. Reinert, E. Umbach, and U. Höfer, The Journal of Chemical Physics 131, 144701 (2009).
- Reinert et al. (2001) F. Reinert, G. Nicolay, S. Schmidt, D. Ehm, and S. Hüfner, Phys. Rev. B 63, 115415 (2001).
- Paniago et al. (1995) R. Paniago, R. Matzdorf, G. Meister, and A. Goldmann, Surface Science 336, 113 (1995).
- Sánchez-Portal et al. (1997) D. Sánchez-Portal, P. Ordejón, E. Artacho, and J. M. Soler, Int. J. of Quantum Chem. 65, 453 (1997).
- Soler et al. (2002) J. M. Soler, E. Artacho, J. D. Gale, A. García, J. Junquera, P. Ordejón, and D. Sánchez-Portal, J. Phys.: Condens. Matter 14, 2745 (2002).
- Kresse and Furthmüller (1996) G. Kresse and J. Furthmüller, Computational Materials Science 6, 15 (1996).
- Troullier and Martins (1991) N. Troullier and J. L. Martins, Phys. Rev. B 43, 1993 (1991).
- Blöchl (1994) P. E. Blöchl, Phys. Rev. B 50, 17953 (1994).
- Kresse and Joubert (1999) G. Kresse and D. Joubert, Phys. Rev. B 59, 1758 (1999).
- Klimes et al. (2010) J. Klimes, D. R. Bowler, and A. Michaelides, Journal of Physics: Condensed Matter 22, 022201 (2010).
- Klimes et al. (2011) J. Klimes, D. R. Bowler, and A. Michaelides, Physical Review B 83, 195131 (2011).
- Grimme et al. (2010) S. Grimme, J. Antony, S. Ehrlich, and H. Krieg, The Journal of Chemical Physics 132, 154104 (2010).
- Grimme et al. (2011) S. Grimme, S. Ehrlich, and L. Goerigk, J. Comp. Chem. 32, 1456 (2011).
- Perdew et al. (1996) J. P. Perdew, K. Burke, and M. Ernzerhof, Phys. Rev. Lett. 77, 3865 (1996).
- Garcia-Gil et al. (2009) S. Garcia-Gil, A. Garcia, N. Lorente, and P. Ordejon, Phys. Rev. B 79, 075441 (2009).
- Schöll et al. (2004) A. Schöll, Y. Zou, T. Schmidt, R. Fink, and E. Umbach, The Journal of Physical Chemistry B 108, 14741 (2004).
- Csonka et al. (2009) G. I. Csonka, J. P. Perdew, A. Ruzsinszky, P. H. T. Philipsen, S. Lebegue, J. Paier, O. A. Vydrov, and J. G. Angyan, Physical Review B 79, 155107 (2009).