Revealing the multi-bonding state between hydrogen and graphene–supported Ti clusters
Abstract
Hydrogen adsorption on graphene–supported metal clusters has brought much controversy due to the complex nature of the bonding between hydrogen and metal clusters. The bond types of hydrogen and graphene–supported Ti clusters are experimentally and theoretically investigated. Transmission electron microscopy shows that Ti clusters of nanometer–size are formed on graphene. Thermal desorption spectroscopy captures three hydrogen desorption peaks from hydrogenated graphene–supported Ti clusters. First principle calculations also found three types of interaction: Two types of bonds with different partial ionic character and physisorption. The physical origin for this rests on the charge state of the Ti clusters: when Ti clusters are neutral, H2 is dissociated, and H forms bonds with the Ti cluster. On the other hand, H2 is adsorbed in molecular form on positively charged Ti clusters, resulting in physisorption. Thus, this work clarifies the bonding mechanisms of hydrogen on graphene–supported Ti clusters.
keywords:
American Chemical Society, LaTeXIR,NMR,UV
1 Introduction
The unique nature of metal clusters and two–dimensional materials have advanced the field of materials science; however, a fundamental understanding behind scientific phenomena related to such materials often leads to further questions 1, 2. Utilizing metal clusters and two–dimensional materials results in functional materials that possess outstanding physical and chemical properties 3, 4, 5. Two–dimensional materials like graphene are found to be good substrates for supporting metal clusters due to their chemical stability and high surface to volume ratio 6, 7, 8. Graphene–supported metal clusters show high reactivity which leads towards applications in the fields of catalysis and energy storage 9, 10, 11.
The chemistry of metal clusters on graphene involves complex bonding between metal clusters and gas molecules when gases such as hydrogen are introduced, resulting in difficulty of experimental measurements and analysis. In particular, hydrogen adsorption on graphene–supported metal clusters often leads to controversial arguments over how hydrogen is adsorbed, whether the hydrogen adsorption takes place on the metal clusters or on defect sites of graphene, whether spillover effects occur, and what types of bonds between hydrogen and metal are formed. Experimental studies report multiple hydrogen desorption peaks, and the hydrogen desorption properties are difficult to reproduce 12, 13, 14, 7, 8.
In order to achieve a fundamental understanding of the interactions between hydrogen and graphene–supported metal clusters, first principle calculations and experimental measurements are performed. In particular, Ti clusters when combined with graphene are predicted to be a particularly suitable material for hydrogen adsorption with range of 3.6 wt to 7.8 wt hydrogen uptake 15, 16, 17, 18, 19. Therefore, in this paper the interactions between hydrogen and graphene–supported Ti clusters are theoretically and experimentally explored.
2 Materials and methods
SiC and Cu substrates are implemented in order to support graphene, since such substrates are reported to preserve the electronic structure of graphene even in the presence of metal clusters 20.
Graphene for transmission electron microscopy (TEM) observation was synthesized using the chemical vapor deposition method 21. The graphene was then transferred to a Cu–based TEM grid. Ti clusters were deposited on graphene using a vacuum deposition technique where the size of clusters is controlled by substrate temperature and deposition time. An aberration–corrected TEM (FEI, TITAN) was used for observing the Ti clusters on a graphene/TEM grid. The acceleration voltage was set to 60 kV.
Hydrogenation and dehydrogenation of graphene–supported Ti clusters was performed in an ultra–high vacuum chamber with a base pressure of mbar. Graphene for hydrogenation and dehydrogenation analysis was synthesized on SiC(0001) which was used for scanning tunneling microscopy (STM) observation in previous work 7, 22, 23, 24. Before titanium deposition, graphene samples were annealed at 900K for several hours to remove adsorbents and to obtain a clean surface. This was done by direct current heating to ensure a homogeneous sample temperature. The high quality of the pristine graphene films was verified by atomically resolved STM images.7, 24 Titanium was deposited on graphene at room temperature using a commercial electron–beam evaporator. The Ti–coverage was calibrated by STM imaging. The amount of depositied Ti for the samples discussed here was 0.84 monolayers (1 monolayer (ML) = atoms/cm2).24 All temperatures were measured using a thermocouple mounted on the sample holder, directly in contact with the sample and additionally cross–calibrated with a pyrometer.
Hydrogenation of Ti clusters on graphene for thermal desorption spectroscopy (TDS) measurements was accomplished by exposing them to molecular deuterium for 5 minutes at a pressure of mbar at 95 K. Deuterium (D2, mass 4) was used instead of hydrogen (H2, mass 2) for a better signal–to–noise ratio in TDS. Deuterium is chemically identical to hydrogen; however, note that the desorption temperatures might be slightly shifted owing to the well known isotope effect 25, 26. For the TDS measurements the samples were positioned in front of a mass spectrometer and heated at a constant rate of 10 K/s up to a temperature of approximately 1000 K, while recording the mass 4–channel of the mass spectrometer. The measured TDS signal was cross–calibrated by the read–out of the pressure gauge in the same vacuum chamber, using an ion gauge sensitivity factor of 0.35.27
First principle calculations employing the Grid based projector augmented wave method (GPAW) are implemented for electronic structure analysis of hydrogen and Ti clusters on graphene 28. The exchange-correlation vdW-DF functional, namely PBE29 functional corrected with DF correction within the Grimme-like30 scheme is used in order to account for the van der Waals force between the Cu substrate and graphene, and physisorption of hydrogen 31.
Grid spacing is set to 0.20 Å with 0.1 eV of smearing and spin polarization calculations. Spin polarization calculation is applied for all calculations. of special k points of the Brillouin zone sampling used within periodic boundary conditions and 15 Å of vaccum is applied to the z axis 32. Bader charge analysis is implemented for calculating the electron transfers 33, 34.
The model system consists of a supercell of Cu(111)(2x2) with four atomic layers of Cu where the bottom two layers of Cu are fixed and a single layer of graphene (consisting of 32 C atoms) located on top. Different model systems with Ti clusters of various size are then build based on the TEM images and increasingly hydrogenated (see Results section). A global optimization scheme, employing the Basin–hopping algorithm, is implemented in order to find the ground state structures of Ti clusters on graphene/Cu(111) 35.
Hydrogen adsorption/desorption energies (Ead) are calculated as:
| (1) |
Here represents the energy of graphene–supported Ti clusters while E[H2] is the energy of gas phase H2. Note that a positive sign indicates an exothermic reaction.
The binding energies (Eb) between graphene and Ti clusters are calculated as:
| (2) |
Cohesive energies(Eco) for supported Ti clusters are calculated as:
| (3) |
Here represents the energy of the graphene substrate, and n is the number of Ti atoms.
3 Results
A TEM image of Ti clusters on single-layer graphene on Cu is shown in Fig. 1(a). The figure shows an atomically–resolved single layer graphene film on which four Ti clusters are indicated by white arrows, with two small Ti clusters being pointed at by the middle arrow. The size of each Ti cluster is found to be 1.37 nm, 0.27nm, 0.68 nm, and 1.0 nm, from left to right. The important observation here is that Ti is not distributed as individual atoms on the surface, as often assumed in theoretical investigations 15, 36, 16, 37, 38, 39, 40, but due to a high cohesive energy 16, 37, 40 it forms clusters. Note that nanometer–sized Ti clusters have previously also been observed on graphene on SiC 7, 24.
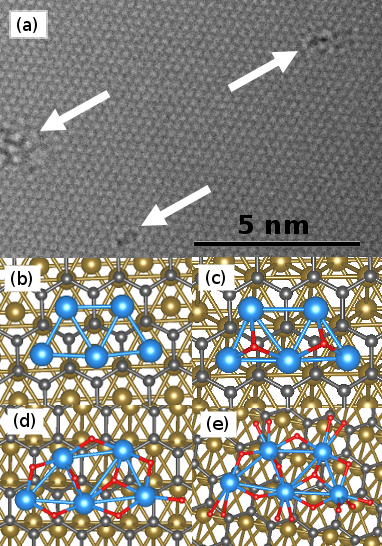
Based on the size of the Ti clusters in Fig. 1(a), atomic models of Tin clusters on graphene are constructed and optimized. The calculations suggest that Ti clusters grow with a trapezoidal shape which is found to have the lowest energy, as depicted in Fig. 1(b). The size of a Ti5 cluster is calculated to be 0.53 nm. The magnetic moment of graphene supported Tin clusters is calculated to be , , , , and , respectively, which is smaller than that of Ti clusters in the gas phase.41 The binding energies between graphene/Cu and Ti clusters and the cohesive energies of supported Ti clusters are calculated and shown in Table 1. In particular, Ti clusters are adsorbed on the graphene/Cu substrate with relatively high stability. Similar phenomena have also been reported for the case of graphene supported Pd clusters 42, 43.
| Eb | Eco | |
|---|---|---|
| Ti1 | 5.27 | N/A |
| Ti2 | 4.22 | 5.07 |
| Ti3 | 3.66 | 5.09 |
| Ti4 | 3.08 | 4.85 |
| Ti5 | 2.82 | 4.68 |
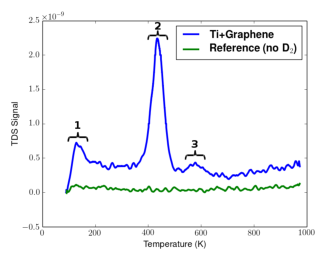
Hydrogen desorption analysis of hydrogenated Ti clusters supported on graphene is investigated using thermal desorption spectroscopy (TDS). The resulting temperature-dependent desorption curve is shown in Fig. 2. The TDS spectrum presents three hydrogen desorption peaks. In particular, major hydrogen release occurs at 420 K while there are two more hydrogen desorption peaks at 150K and 580K. In a control experiment, the sample was not exposed to a deuterium flux. The resulting desorption curve did not show any desorption peaks.
The amount of desorbed (and therefore stored) deuterium can be estimated from these TDS data. Subtraction of the background and integration of the TDS curve gives the area under the curve, mbar s. At a given pressure, the amount of desorbed gas equals the pumping speed of the vacuum system, here l/s. This leads to the amount of desorbed deuterium , with J K-1 mol-1 the gas constant, resulting in mol = desorbed D2 molecules. This quantity can be used to evaluate the Gravimetric Density () of the system, i.e., the ratio of loaded hydrogen mass over total system mass (from now on, we consider hydrogen and not deuterium). The general formula for can then be written as
| (4) |
with the mass of titanium (), graphene (), and hydrogen (). H2 molecules have a mass of kg. The sample has a size of 12.4 mm2, and graphene a mass density of kg/m2,44 which results in a mass of the graphene of kg. On the same sample area, 0.84 ML of Ti correspond to atoms, corresponding to a weight of kg. Using eq. 4, the finally results to be wt%. Furthermore, by comparing the numbers of released hydrogen molecules and Ti surface atoms, it can be deduced that each Ti atom in average can bind 2.4 hydrogen molecules.
The approximate desorption energy barriers from the measured desorption temperatures were then estimated. First-order desorption is assumed, based on the reported molecule-like dimer arrangement of hydrogen atoms on graphene,23 and similar to what has been observed for hydrogen release from graphite45 and Rh(110).46 Defining as the time from the start of the desorption ramp to the moment at which the desorption temperature is reached, equals with the temperature at the start of the ramp (here K) and the heating rate (here K/s). Then one has ,47 with the Arrhenius constant (typical value s-1). For K s and were obtained; hence eV/molecule. This desorption peak can therefore be classified as related to physisorption ( eV/molecule). On the other hand, for the desorption peaks at 420 K and 580 K eV/molecule or 0.55 eV/atom and eV/molecule = 0.75 eV/atom were obtained, respectively, suggesting these peaks are related to chemisorption ( eV/molecule). In using the Redhead equation,47, 7 the same values for the desorption energy barriers were obtained. These estimates of the relation between desorption temperature and desorption barrier are also consistent with other values reported for hydrogen desorption from various materials.27, 23
These multiple hydrogen release peaks address a controversial issue relating to the hydrogen adsorption sites. The location of such sites is often debated to be either on the graphene side or the metal side 12, 13, 14, 7, 8. Calculations provide controversial predictions, suggesting that multi–bonding states between hydrogen and Ti clusters might be involved.
In order to reveal the details of the interaction between hydrogen and Ti clusters on graphene, hydrogen adsorption over Tin clusters on graphene is simulated. Hydrogen adsorption at various adsorption sites is considered: on clean graphene, on graphene with a defect site, on graphene with a defect site which is filled by a Ti1 cluster, and on Tin clusters on graphene. Hydrogen adsorption is performed by adding molecular H2 in a stepwise manner until the Tin clusters are fully hydrogenated.
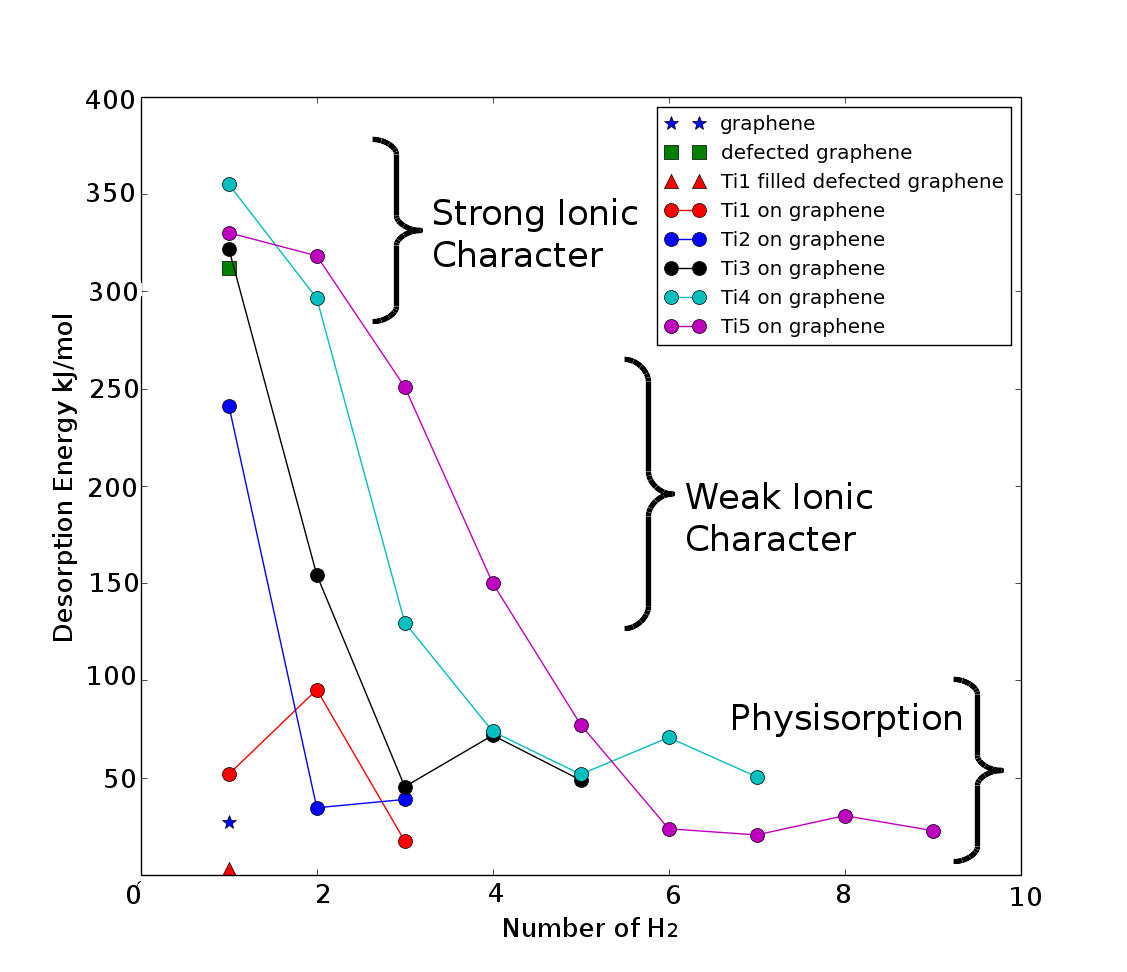
As shown in Fig. 3, the hydrogen desorption energy on clean graphene is calculated to be 27 kJ/mol (or 0.28 eV/H2), which indicates that hydrogen is adsorbed on graphene by physisorption. On the other hand, hydrogen adsorption at the defect in graphene has a relatively high desorption energy of 313 kJ/mol. Here H2 is dissociated and adsorbed as H atoms at the edge of the defect. These cases represent the two different bond types, namely physisorption and chemisorption, that occur during hydrogen and graphene interaction, where physisorption is based on weak van der Waals forces between the H2 molecule and graphene, while chemisorption is based on C–H chemical bonds that form after H2 molecule dissociation. Conversely, the hydrogen desorption energy from a Ti1 cluster occupying a defect site in graphene is significantly low at 3 kJ/mol. This could be attributed to the strong bond between Ti1 and the defect site of graphene mediated by a charge transfer.
According to the first principle calculations, hydrogen adsorption on Ti1 clusters on graphene is governed by physisorption as no charge transfer is involved between H2 molecules and Ti. This is in agreement with previous work showing that up to four H2 molecules can be stored by single graphene–supported Ti atoms 48, 18. However, larger clusters Tin behave differently. Ti2 induces dissociative adsorption of the first H2 with 0.5 electrons transfered from Ti2 to each H atom. This behavior, previously observed in isolated small Ti clusters 49, can be described as a polarized covalent bond with partial ionic character. The second and third H2 are weakly adsorbed in molecular form where electron transfer between Ti and H2 is not involved. A similar behavior is also observed for hydrogen adsorption on Tin .
Structural details of the different bond types between hydrogen and Ti5 are shown in Figs. 1(c–e). Chemical bonding is seen in Ti5:1H2 where H2 is dissociated and adsorbed as H atoms, as shown in Fig. 1(c). A weaker bonding is observed in Ti5:4H2. Though the molecules are fully dissociated, the charge transfer and ionic character slightly decrease, and the binding energy is lower. As more H2 molecules are added, the physical character of the interaction prevails, forming a shell of physisorbed molecules as in Ti5:9H2 shown in Fig. 1(e).
Bader charge analysis provides further information for an understanding of the multi-bonding between hydrogen and Ti clusters. Two regimes of charge transfer from H to Ti are identified, namely ”strong” in the range of electrons/H and ”weak” with electrons/H; for physisorption, a charge transfer is not involved. In addition, Bader analysis reveals interesting results in hydrogen adsorption at the defected site of the graphene where H is positively charged by 0.5 electron which is the opposite charge state of hydrogen on Ti clusters. As the size of the Ti clusters grows, not only can more hydrogen be adsorbed but also the number of hydrogen atoms that fit in each type of bond increases. This can be seen in Fig. 3: a Ti5 cluster, for example, can store up to 9 hydrogen molecules.
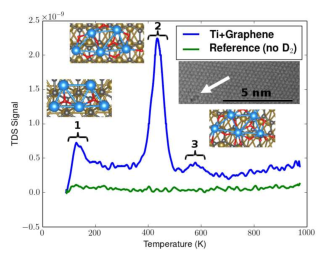
First principle calculations reveals that positively charged Ti clusters are not able to dissociate H2, leading to a weak H2 adsorption through physisorption, while neutral Ti clusters tend to transfer their electrons towards H2, resulting in H2 dissociation and chemical bonding of H. Similar results were reported for Ti clusters adsorbed on fullerenes.50 One can conclude that the bond type between H2 and Ti clusters is strongly dependent on the charge state of the Ti clusters. In particular, initially introduced H2 tends to dissociate and be adsorbed through chemical bonding due to the large charge transfer from the Ti clusters. As the number of adsorbed H2 on the Ti cluster increases, the strength and the ionic character of the bonds between H2 and the Ti cluster weakens. Once Ti clusters are fully positively charged, H2 is then adsorbed in molecular form via physisorption. As a result, three bonding regions are both observed in experiment and calculations as shown in Figures 2 and 3, respectively. Thus, the link between experimental hydrogen desorption shown in Fig. 2 and three different types of bonding between hydrogen and Ti clusters based on first principle calculations shown in Fig. 3 is established.
In addition, the gravimetric density of hydrogen is evaluated where hydrogen storage capacity is estimated to be 5.1%, corresponding to 2.4 hydrogen molecules for each Ti atom, in line with previous studies of Ti functionalized graphene on SiC24 and above the values obtained for non-functionalized graphene based materials in same conditions (1% at RT).51 A rough estimation of the corresponding volumetric density leads to an optimal value 0.2 kg/l, which would allow interesting automotive applications. This however implies the capability of building 3D frameworks with controllable inter-layer spacing or porosity (a value of 1nm is assumed in the estimate). Therefore, future developments of these studies for H-storage applications shall involve not only the optimization of the Ti clusters concentration and distribution, but also the chemical functionalization of the sheets aimed at building 3D frameworks with controlled structural properties.
4 Conclusions
In conclusion, the bonding mechanisms between hydrogen and graphene–supported Ti clusters are experimentally and theoretically investigated. Ti clusters are synthesized on graphene using vacuum deposition techniques. TEM confirms that nanometer–sized Ti clusters are formed on graphene. TDS shows that three hydrogen desorption peaks from hydrogenated Ti clusters occur. First principle calculations reveal three bond types: chemical bonding with strong ionic character, weak chemical bonding with smaller ionic character, and physisorption. In particular, we show that the physical origin for this rests on the charge state of the Ti clusters. When Ti clusters are neutral, H2 is dissociated and adsorbed through ionic bonding, while H2 is adsorbed in molecular form over positively charged Ti clusters.
5 Acknowledgment
CPU time is funded by the Japan Society for the Promotion of Science and is performed at Hokkaido University, Sapporo, Japan. This work has been partially supported by ENEOS Hydrogen Trust Fund. Funding from the European Union Seventh Framework Programme under Grant Agreement No. 696656 Graphene Core1 is acknowledged. Financial support from the CNR in the framework of the agreements on scientific collaboration between CNR and JSPS (Japan), CNRS (France), NRF (Korea), and RFBR (Russia) is acknowledged. SH acknowledges funding from the Italian Ministry of Foreign Affairs, Direzione Generale per la Promozione del Sistema Paese (agreements on scientific collaboration with Canada (Quebec) and Poland).
References
- Mingos and Wales 1990 Mingos, D. M. P.; Wales, D. J. Introduction to Cluster Chemistry; Prentice Hall, 1990
- Geim and Novoselov 2007 Geim, A. K.; Novoselov, K. S. The Rise of Graphene. Nature Materials 2007, 6, 183–191
- Stankovich et al. 2006 Stankovich, S.; Dikin, D. A.; Dommett, G. H.; Kohlhaas, K. M.; Zimney, E. J.; Stach, E. A.; Piner, R. D.; Nguyen, S. T.; Ruoff, R. S. Graphene-based Composite Materials. Nature 2006, 442, 282–286
- Pumera 2011 Pumera, M. Graphene-based nanomaterials for energy storage. Energy & Environmental Science 2011, 4, 668–674
- Huang et al. 2012 Huang, X.; Qi, X.; Boey, F.; Zhang, H. Graphene-based composites. Chem. Soc. Rev. 2012, 41, 666–686
- Krasheninnikov et al. 2009 Krasheninnikov, A.; Lehtinen, P.; Foster, A.; Pyykkö, P.; Nieminen, R. Embedding Transition-Metal Atoms in Graphene: Structure, Bonding, and Magnetism. Phys. Rev. Lett. 2009, 102, 126807
- Mashoff et al. 2013 Mashoff, T.; Takamura, M.; Tanabe, S.; Hibino, H.; Beltram, F.; Heun, S. Hydrogen Storage with Titanium-Functionalized Graphene. Appl. Phys. Lett. 2013, 103, 013903
- Takahashi et al. 2014 Takahashi, K.; Wang, Y.; Chiba, S.; Nakagawa, Y.; Isobe, S.; Ohnuki, S. Low Temperature Hydrogenation of Iron Nanoparticles on Graphene. Sci. Rep. 2014, 4, 4598
- Liang et al. 2011 Liang, Y.; Li, Y.; Wang, H.; Zhou, J.; Wang, J.; Regier, T.; Dai, H. Co3O4 Nanocrystals on Graphene as a Synergistic Catalyst for Oxygen Reduction Reaction. Nat. Mater. 2011, 10, 780–786
- Wu et al. 2012 Wu, Z.-S.; Zhou, G.; Yin, L.-C.; Ren, W.; Li, F.; Cheng, H.-M. Graphene/metal oxide composite electrode materials for energy storage. Nano Energy 2012, 1, 107–131
- Guo and Sun 2012 Guo, S.; Sun, S. FePt nanoparticles assembled on graphene as enhanced catalyst for oxygen reduction reaction. Journal of the American Chemical Society 2012, 134, 2492–2495
- Parambhath et al. 2011 Parambhath, V. B.; Nagar, R.; Sethupathi, K.; Ramaprabhu, S. Investigation of Spillover Mechanism in Palladium Decorated Hydrogen Exfoliated Functionalized Graphene. J. Phys. Chem. C 2011, 115, 15679–15685
- Parambhath et al. 2012 Parambhath, V. B.; Nagar, R.; Ramaprabhu, S. Effect of nitrogen doping on hydrogen storage capacity of palladium decorated graphene. Langmuir 2012, 28, 7826–7833
- Hudson et al. 2014 Hudson, M. S. L.; Raghubanshi, H.; Awasthi, S.; Sadhasivam, T.; Bhatnager, A.; Simizu, S.; Sankar, S.; Srivastava, O. Hydrogen Uptake of Reduced Graphene Oxide and Graphene Sheets Decorated with Fe Nanoclusters. Int. J. Hydrogen Energy 2014, 39, 8311–8320
- Durgun et al. 2008 Durgun, E.; Ciraci, S.; Yildirim, T. Functionalization of Carbon-based Nanostructures with Light Transition-Metal Atoms for Hydrogen Storage. Phys. Rev. B 2008, 77, 085405
- Bhattacharya et al. 2010 Bhattacharya, A.; Bhattacharya, S.; Majumder, C.; Das, G. P. Transition-Metal Decoration Enhanced Room-Temperature Hydrogen Storage in a Defect-Modulated Graphene Sheet. J. Phys. Chem. C 2010, 114, 10297
- Liu et al. 2010 Liu, Y.; Ren, L.; He, Y.; Cheng, H.-P. Titanium-decorated Graphene for High-capacity Hydrogen Storage Studied by Density Functional Simulations. J. Phys. Condens. Matter 2010, 22, 445301
- Valencia et al. 2015 Valencia, H.; Gil, A.; Frapper, G. Trends in the Hydrogen Activation and Storage by Adsorbed 3d Transition Metal Atoms onto Graphene and Nanotube Surfaces: A DFT Study and Molecular Orbital Analysis. J Phys Chem C 2015, 119, 5506
- Ramos-Castillo et al. 2016 Ramos-Castillo, C. M.; Reveles, J. U.; Cifuentes-Quintal, M. E.; Zope, R. R.; de Coss, R. Ti4– and Ni4–Doped Defective Graphene Nanoplatelets as Efficient Materials for Hydrogen Storage. J. Phys. Chem. C 2016, 120, 5001
- Takahashi 2015 Takahashi, K. The growth of Fe clusters over graphene/Cu (111). 2D Materials 2015, 2, 014001
- Li et al. 2011 Li, X.; Magnuson, C. W.; Venugopal, A.; Tromp, R. M.; Hannon, J. B.; Vogel, E. M.; Colombo, L.; Ruoff, R. S. Large-Area Graphene Single Crystals Grown by Low-Pressure Chemical Vapor Deposition of Methane on Copper. J. Am. Chem. Soc. 2011, 133, 2816–2819
- Goler et al. 2013 Goler, S.; Coletti, C.; Piazza, V.; Pingue, P.; Colangelo, F.; Pellegrini, V.; Emtsev, K. V.; Forti, S.; Starke, U.; Beltram, F.; Heun, S. Revealing the atomic structure of the buffer layer between SiC(0001) and epitaxial graphene. Carbon 2013, 51, 249
- Goler et al. 2013 Goler, S.; Coletti, C.; Tozzini, V.; Piazza, V.; Mashoff, T.; Beltram, F.; Pellegrini, V.; Heun, S. Influence of Graphene Curvature on Hydrogen Adsorption: Toward Hydrogen Storage Devices. J. Phys. Chem. C 2013, 117, 11506
- Mashoff et al. 2015 Mashoff, T.; Convertino, D.; Miseikis, V.; Coletti, C.; Piazza, V.; Tozzini, V.; Beltram, F.; Heun, S. Increasing the Active Surface of Titanium Islands on Graphene by Nitrogen Sputtering. Appl. Phys. Lett. 2015, 106, 083901
- Gdowski and Felter 1986 Gdowski, G. E.; Felter, T. E. Summary Abstract: An Observed Isotope Effect for Hydrogen and Deuterium Adsorption/Desorption on Pd(111). J. Vac. Sci. Technol. A 1986, 4, 1409
- Zecho et al. 2002 Zecho, T.; Güttler, A.; Sha, X.; Jackson, B.; Küppers, J. Adsorption of Hydrogen and Deuterium Atoms on the (0001) Graphite Surface. J. Chem. Phys. 2002, 117, 8486
- van Helden et al. 2012 van Helden, P.; van den Berg, J.-A.; Weststrate, C. J. Hydrogen Adsorption on Co Surfaces: A Density Functional Theory and Temperature Programmed Desorption Study. ACS Catal. 2012, 2, 1097
- Mortensen et al. 2005 Mortensen, J.; Hansen, L.; Jacobsen, K. Real-space Grid Implementation of the Projector Augmented Wave Method. Phys. Rev. B 2005, 71, 035109
- Perdew et al. 1996 Perdew, J. P.; Burke, K.; Ernzerhof, M. Generalized Gradient Approximation Made Simple. Phys. Rev. Lett. 1996, 77, 3865–3868
- Grimme 2006 Grimme, S. Semiempirical GGA-type Density Functional Constructed with a Long-Range Dispersion Correction. J. Comput. Chem. 2006, 27, 1787
- Dion et al. 2004 Dion, M.; Rydberg, H.; Schröder, E.; Langreth, D. C.; Lundqvist, B. I. Van der Waals Density Functional for General Geometries. Phys. Rev. Lett. 2004, 92, 246401
- Monkhorst and Pack 1976 Monkhorst, H. J.; Pack, J. D. Special points for Brillouin-zone Integrations. Phys. Rev. B 1976, 13, 5188–5192
- Sanville et al. 2007 Sanville, E.; Kenny, S. D.; Smith, R.; Henkelman, G. Improved Grid-based Algorithm for Bader Charge Allocation. J. Comput. Chem. 2007, 28, 899–908
- Henkelman et al. 2006 Henkelman, G.; Arnaldsson, A.; Jónsson, H. A Fast and Robust Algorithm for Bader Decomposition of Charge Density. Comput. Mater. Sci. 2006, 36, 354–360
- Takahashi et al. 2013 Takahashi, K.; Isobe, S.; Ohnuki, S. Chemisorption of Hydrogen on Fe Clusters Through Hybrid Bonding Mechanisms. Appl. Phys. Lett. 2013, 102, 113108
- Kim et al. 2009 Kim, G.; Jhi, S.-H.; Lim, S.; Park, N. Effect of Vacancy Defects in Graphene on Metal Anchoring and Hydrogen Adsorption. Appl. Phys. Lett. 2009, 94, 173102
- Lee et al. 2010 Lee, H.; Ihm, J.; Cohen, M. L.; Louie, S. G. Calcium-Decorated Graphene-Based Nanostructures for Hydrogen Storage. Nano Lett. 2010, 10, 793
- Liu et al. 2010 Liu, Y.; Ren, L.; He, Y.; Cheng, H.-P. Titanium-decorated Graphene for High-capacity Hydrogen Storage Studied by Density Functional Simulations. J. Phys.: Condens. Matter 2010, 22, 445301
- Chu et al. 2011 Chu, S.; Hu, L.; Hu, X.; Yang, M.; Deng, J. Titanium-Embedded Graphene as High-Capacity Hydrogen-Storage Media. Int. J. Hydrogen Energy 2011, 36, 12324
- Fair et al. 2013 Fair, K. M.; Cui, X. Y.; Li, L.; Shieh, C. C.; Zheng, R. K.; Liu, Z. W.; Delley, B.; Ford, M. J.; Ringer, S. P.; Stampfl, C. Hydrogen Adsorption Capacity of Adatoms on Double Carbon Vacancies of Graphene: A Trend Study from First Principles. Phys. Rev. B 2013, 87, 014102
- Medina et al. 2010 Medina, J.; de Coss, R.; Tapia, A.; Canto, G. Structural, Energetic and Magnetic Properties of Small Tin (n= 2–13) Clusters: A Density Functional Study. Eur. Phys. J. B 2010, 76, 427
- Ramos-Castillo et al. 2015 Ramos-Castillo, C.; Reveles, J.; Zope, R.; de Coss, R. Palladium Clusters Supported on Graphene Monovacancies for Hydrogen Storage. J. Phys. Chem. C 2015, 119, 8402
- Johll et al. 2011 Johll, H.; Wu, J.; Ong, S. W.; Kang, H. C.; Tok, E. S. Graphene-adsorbed Fe, Co, and Ni trimers and tetramers: Structure, stability, and magnetic moment. Phys. Rev. B 2011, 83, 205408
- Chen et al. 2008 Chen, J.-H.; Jang, C.; Xiao, S.; Ishigami, M.; Fuhrer, M. S. Intrinsic and extrinsic performance limits of graphene devices on SiO2. Nat. Nanotech. 2008, 3, 206
- Denisov and Kompaniets 2001 Denisov, E. A.; Kompaniets, T. N. Kinetics of Hydrogen Release from Graphite after Hydrogen Atom Sorption. Phys. Scr. 2001, T94, 128
- Vesselli et al. 2008 Vesselli, E.; Campaniello, M.; Baraldi, A.; Bianchettin, L.; Africh, C.; Esch, F.; Lizzit, S.; Comelli, G. A. Surface Core Level Shift Study of Hydrogen-Induced Ordered Structures on Rh(110). J. Phys. Chem. C 2008, 112, 14475
- Woodruff and Delchar 1994 Woodruff, D. P.; Delchar, T. A. Modern Techniques of Surface Science; Cambridge University Press: New York, 1994
- Rojas and Leiva 2007 Rojas, M. I.; Leiva, E. P. M. Density Functional Theory Study of a Graphene Sheet Modified with Titanium in Contact with Different Adsorbates. Phys. Rev. B 2007, 76, 155415
- Shang et al. 2009 Shang, M.-H.; Wei, S.-H.; Zhu, Y.-J. The Evolution of Geometric and Electronic Structures for the Hydrogen Storage on Small Tin Clusters. J. Phys. Chem. C 2009, 113, 15507
- Sun et al. 2005 Sun, Q.; Wang, Q.; Jena, P.; Kawazoe, Y. Clustering of Ti on a C60 Surface and Its Effect on Hydrogen Storage. J. Am. Chem. Soc. 2005, 127, 14582–14583
- Klechikov et al. 2015 Klechikov, A. G.; Mercier, G.; Merino, P.; Blanco, S.; Merino, C.; Talyzin, A. V. Hydrogen storage in bulk graphene-related materials. Micr. Mes. Mater. 2015, 210, 46–51
”For Table of Contents Use Only,”
Table of Contents