Present address: Department of Crystalline Materials Science, Nagoya University, Nagoya 464-8603, Japan.††thanks: Corresponding author: ytanabe@m.tohoku.ac.jp††thanks: Corresponding author: tanigaki@m.tohoku.ac.jp
Non-Fermi liquid behavior of electrical resistivity close to the nematic critical point in Fe1-xCoxSe and FeSe1-ySy
Abstract
Temperature dependence of resistivity of single crystals of Fe1-xCoxSe and FeSe1-ySy is studied in detail under zero and high magnetic field (magnetoresistance), the latter of which enables to monitor the temperature () evolution of resistivity below the onset of superconducting transition temperature (). In FeSe1-ySy, -linear dependence of resistivity is prominent in = 0.160 below 40 K, whereas it changes to a Fermi-liquid(FL)-like one below 10 K in = 0.212. These suggest that the quantum critical point (QCP) originating from the electronic nematicity resides around = 0.160 and the fluctuation in QCP gives rise anomalous -linear dependence in resistivity in a wide range. In Fe1-xCoxSe, resistivity gradually changes from linear- to quadratic- -dependent one at low temperatures in the range between = 0.036 and 0.075. These could be interpreted by scenarios of both the nematic QCP and the crossover in the ground states between the orthorhombic nematic phase and the tetragonal phase. The anomalies found as -linear resistivity are discussed in terms of orbital and spin fluctuation arising from the nematic QCP.
The iron based superconductors (FeSCs) provide the new paradigm for the physics in the high temperature superconductivity where the orbital, the spin, and the lattice degree of freedom are considered to inextricably participate to the formation of the Cooper pair. Most parent compounds of FeSCs show the symmetry breaking (nematic) transition accompanied by the stripe type antiferromagnetic (AFM) order Paglione and Greene (2010); Fernandes et al. (2014); Hosono and Kuroki (2015). The superconductivity often emerges when the order is suppressed under pressure or/and the chemical substitutions. The important experimental fact is that a superconducting dome takes a maximum at the quantum critical point (QCP) of the AFM order in their electronic phase diagrams. Consequently, AFM quantum fluctuation has been considered to play important role for the formation of Cooper pairs.
From such aspects, a considerable number of researches have been made on the BaFe2(As1-xPx)2 systems. Non-Fermi liquid (nFL) behaviors have been identified in several physical properties e.g. penetration depth and resistivity slope in the optimally doped region Kasahara et al. (2010); Nakai et al. (2010); Hashimoto et al. (2012); Walmsley et al. (2013); Analytis et al. (2014). This indicates that a strong AFM fluctuation is present near the QCP and substantially contributes to the formation of the Cooper pair. Nevertheless, the relationship between the nematic quantum fluctuation and the superconductivity has been an open question, because unique characters smear out when the AFM ordering simultaneously emergent. In order to answer to this question, FeSe may be the most appropriate system where the orbital order takes place at around structural transition temperature ( K) without the AFM order Hsu et al. (2008); McQueen et al. (2009), hence non-magnetic nematic state is realised Huynh et al. (2014); Nakayama et al. (2014); Böhmer et al. (2015); Baek et al. (2015); Suzuki et al. (2015). Recent experimental progresses in single crystalline FeSe1-ySy have revealed that the nematic fluctuation diverges towards the nematic QCP where the nematic quantum transition takes place Hosoi et al. (2016). It is required to investigate physical phenomena evoked from the nematic fluctuation in FeSCs. In addition, the relationship between the non-magnetic nematic QCP and the superconductivity is an urgent subject to elucidate. In this report, we study cobalt and sulfur substitution effects on electrical resistivity in FeSe single crystals. If low energy excitations are governed by certain quantum fluctuations, the temperature dependence of resistivity is expected to show anomalous nFL behaviors Ueda and Moriya (1975); Hertz (1976); Millis (1993). We try to find such evidence from the viewpoint of the evolution of resistivity as a function of . In order to detect the experimental facts, the normal-state resistivity at temperatures lower than the onset of superconducting transition temperature () and the magnetoresistance (MR) are measured at various temperatures and their values in the normal-states were extrapolated to zero field. Almost -linear dependence of resistivity is found at around the nematic QCP in FeSe1-ySy, whereas deviation was observed in Fe1-xCoxSe. In the overdoped regime where the orbital order disappears, a quadratic temperature dependence of resistivity emerges towards the low- limit, being indicative of the crossover from the nFL to the FL at low temperatures. The origin of the changes observed in resistivity is discussed in terms of orbital and spin fluctuations.
I Experiments
High quality single crystals of Fe1-xCoxSe () and FeSe1-ySy () were grown by a molten salt flux method Böhmer et al. (2013); Huynh et al. (2014); Nakayama et al. (2014); Urata et al. (2016). As precursors, polycrystalline samples were synthesized by a solid state reaction Mizuguchi et al. (2009). The quality of the single crystals was examined by the (0 0 ) reflection of X-ray diffraction (XRD) and energy dispersive X-ray spectroscopy (EDS). The EDS spectra were taken at different ten points for each sample and the averaged molar ratio among iron, selenium, and cobalt () or sulfur () was calculated. The errors of compositions were estimated using the standard deviations from the averaged values. Temperature dependence of the , MR and Hall resistivity were measured by the standard four probe method. Magnetic fields () were varied with T paralleled to the c-axis. s are defined at the end point of the superconducting transition where is approximately less than 1.0 cm. Note that MR and Hall resistivity are averaged or subtracted between positive and negative respectively to cancel unnecessary contributions from antisymmetric or symmetric components owing to the misalignment of electrodes.
II Results and discussion
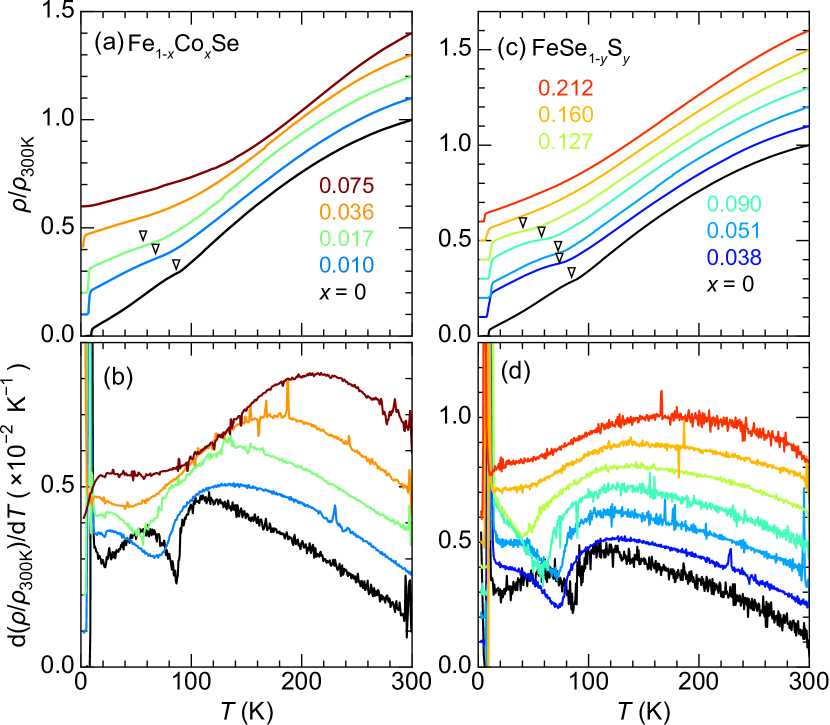
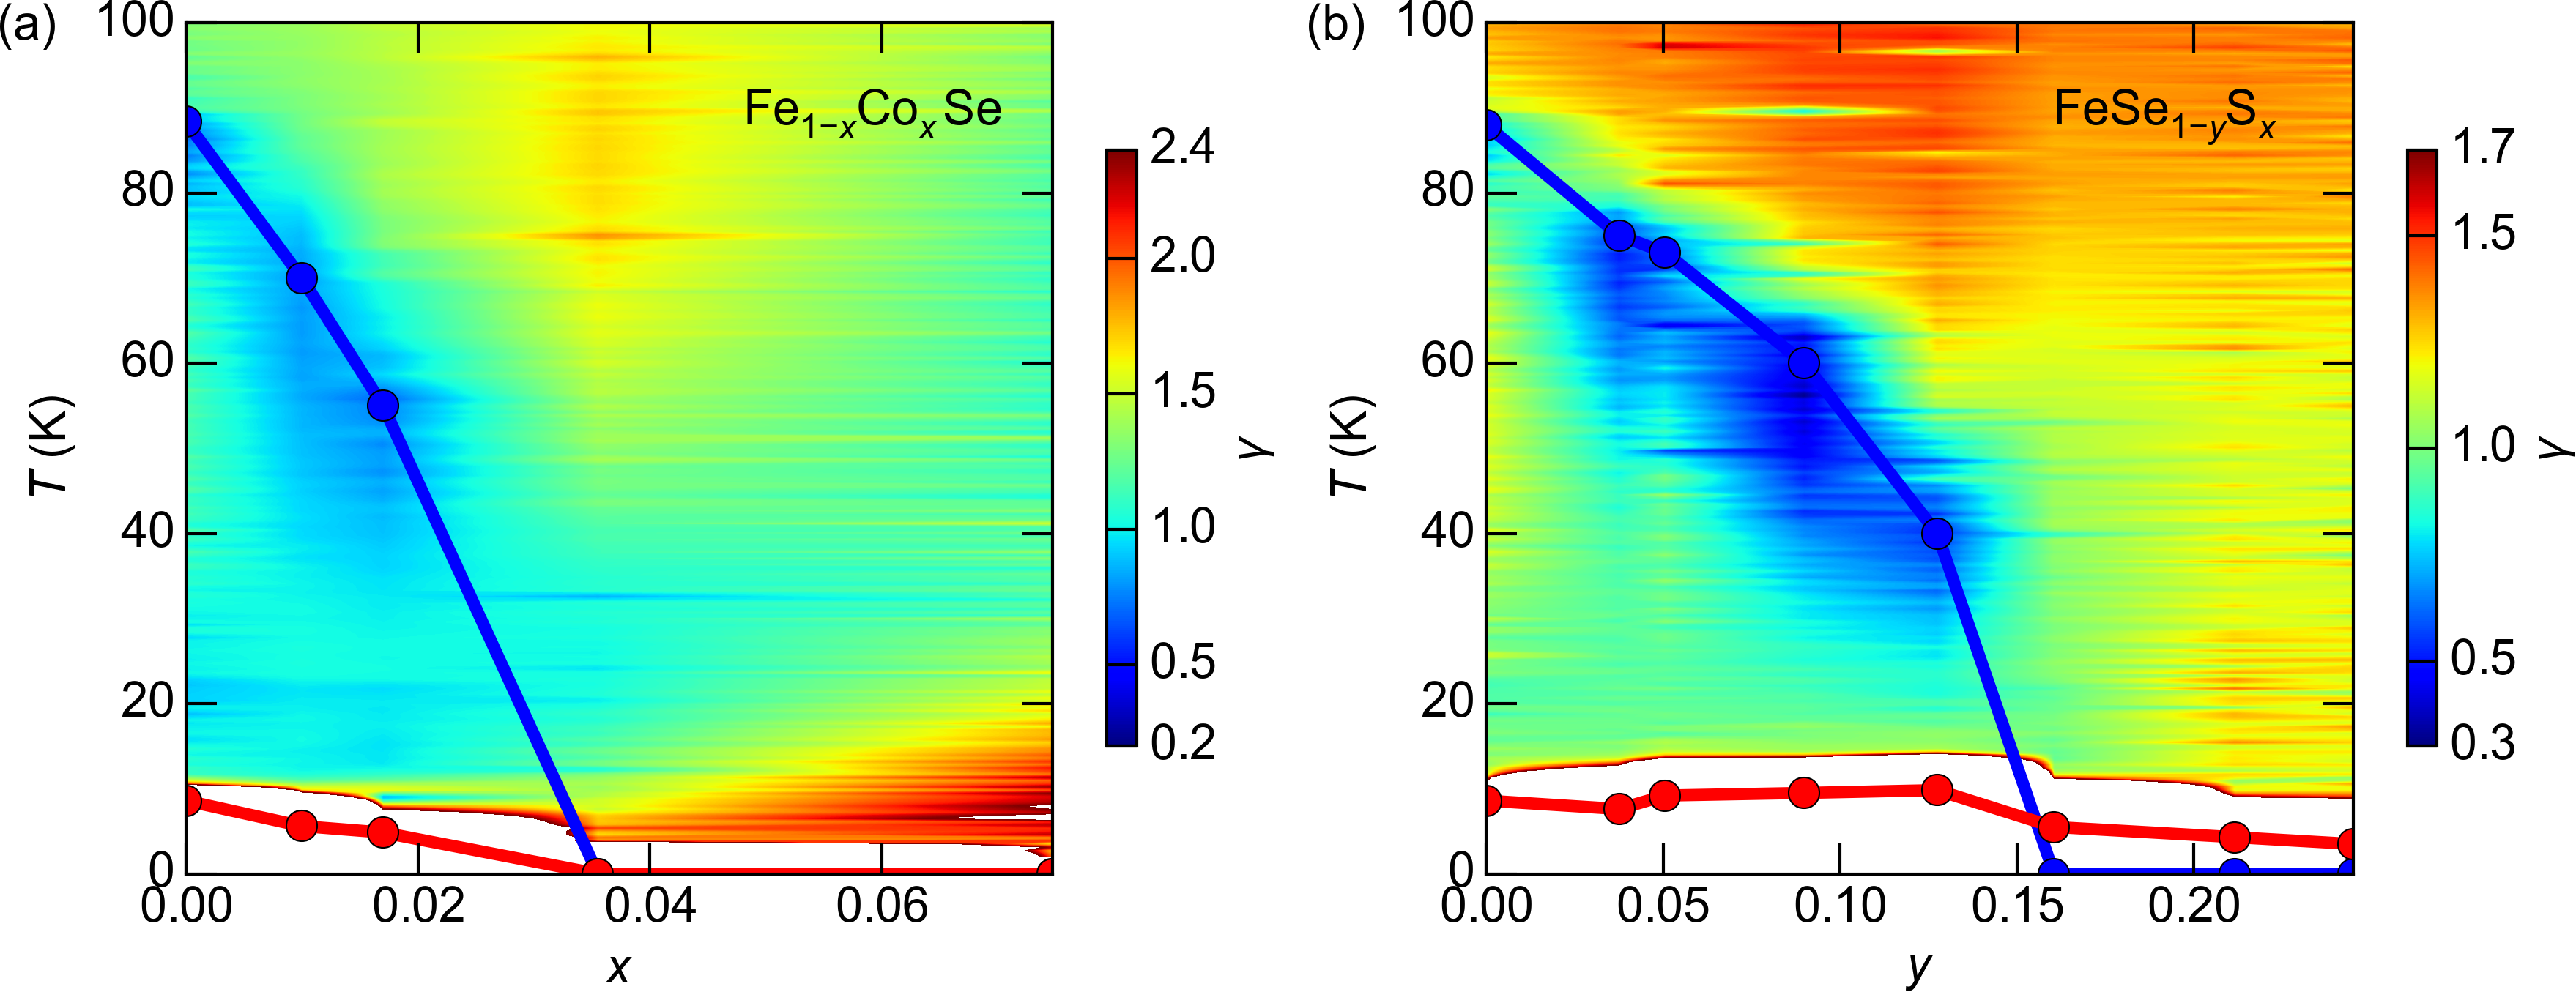
Fig. 1 (a, c) shows temperature dependences of the normalized resistivity at 300 K () for Fe1-xCoxSe and FeSe1-ySy, respectively. The superconducting transition was observed in Fe1-xCoxSe () and FeSe1-ySy (). In FeSe1-ySy, shows the maximum at around = 0.127 and gradually decreases with an increase in , which is in sharp contrast with that of Fe1-xCoxSe, where monotonically decreases with an increase in . Above , we find a kink in the resistivity curve for samples with various compositions. In order to show this more clearly, the first derivatives of are depicted in Fig.1 (b, d). The values of d()/d show sharp changes in derivative for Fe1-xCoxSe () and FeSe1-ySy (). We name these temperatures as (shown as the triangles in the top figures of Fig.1). Looking back at the previous reports, most presumably corresponds to McQueen et al. (2009). Hence, the structural transition seems to be suppressed by both cobalt and sulfur doping and disappears in the stoichiometry around and , respectively.
As is mentioned in recent reports, FeSe family may possess non-magnetic nematic QCP in the phase diagram Huynh et al. (2014); Nakayama et al. (2014); Böhmer et al. (2015); Baek et al. (2015); Suzuki et al. (2015); Hosoi et al. (2016). In the vicinity of QCP, physical properties are frequently described beyond the FL theory. In the normal FL, the current is carried by quasiparticles and the resistivity is proportional to at low temperatures Landau (1957). On the other hand, if the system is influenced by quantum fluctuations, differently exotic dependence of resistivity emerges. In order to see the nematic quantum fluctuations in FeSe, the resistivity curves are analyzed in detail by focusing on around the nematic QCP in the phase diagram.
We carefully examined temperature evolution of the resistivity as follows. The temperature dependence of resistivity () is assumed in the form of , where denotes the residual resistivity and is a coefficient. In this assumption, the temperature exponent of resistivity () can be written as, . We evaluated as a function of temperature by employing this formula. In Fig. 2, the temperature and chemical concentration dependences of the exponent are shown as color maps. From these phase diagrams, the nematic transition is greatly suppressed around at 0.036 and 0.160 in Fe1-xCoxSe and FeSe1-ySy, respectively. At around these doping regimes, the onset of still remains in both samples and hides the normal-state resistivity behavior at low temperatures. To clarify the resistivity in the normal state to be viewed from the superconducting transition, we performed transverse MR measurements.
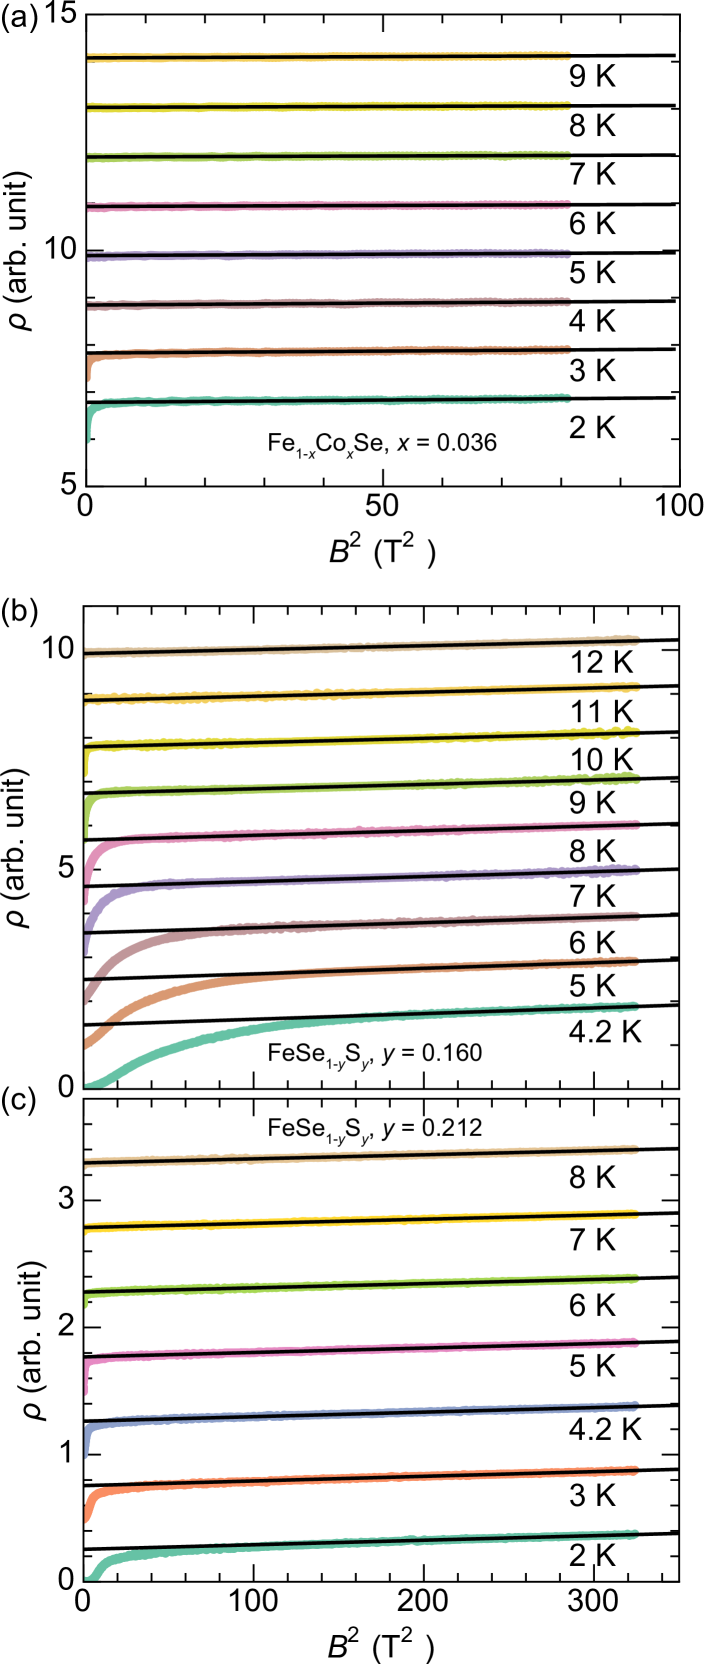
Fig. 3 shows the squared magnetic field () dependence of MR at various temperatures for Fe1-xCoxSe () and FeSe1-ySy (). The magnetic field was scanned up to 9 T for Fe1-xCoxSe () and 18 T for FeSe1-ySy (). Above the , MR is proportional to . Below the , MR is also proportional to above upper critical magnetic field . This implies that the family of the compounds are compensated semimetals and low B approximations are still valid even under . Actually, the highly compensated semimetallic band structure of FeSe has been reported above Nakayama et al. (2014) and under Huynh et al. (2014); Terashima et al. (2014); Kasahara et al. (2014). The isovalent doping FeSe1-ySy may be similar to FeSe with various . As for Fe1-xCoxSe, however, the electron doping occurs Urata et al. (2016) and carrier compensation may not be preserved. Consequently, we can imagine that the carrier mobility of Fe1-xCoxSe is greatly suppressed and hence the saturation in MR will not be observed in this field regime.
The results of -linear fitting in the normal-state MR are shown in Fig. 3. The intercepts were estimated by extrapolating the lines to the zero field. They are plotted with resistivity curves in Fig. 4 as circles and are found to be connected smoothly. We define them as normal-state resistivity at each corresponding temperature.
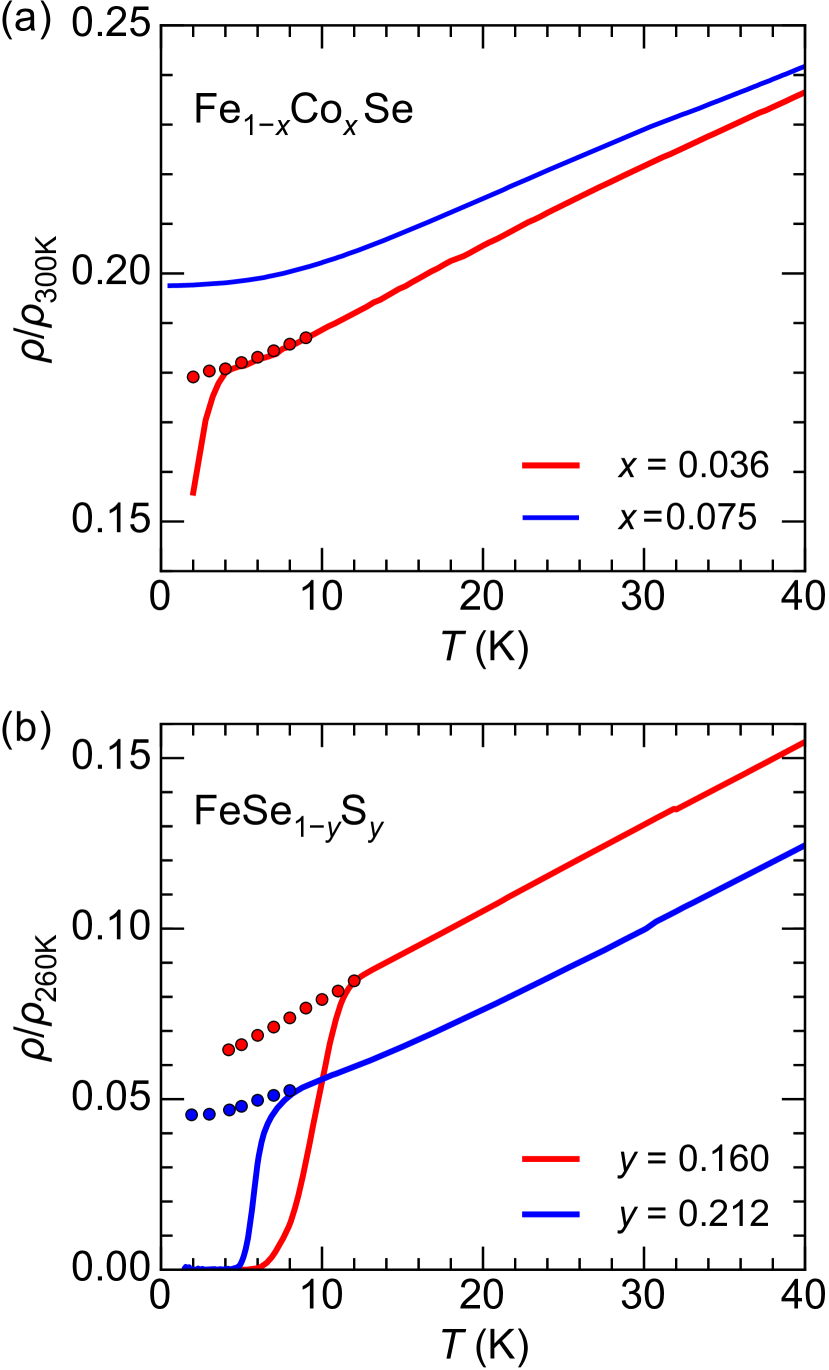
For Fe1-xCoxSe, quadratic evolution of resistivity as a function of is observed below 10 K in = 0.036 and this is emphasized in = 0.075. For FeSe1-ySy, the curves are almost -linear in = 0.160 below 40 K. This linear behavior crossovered to the quadratic curve at low temperatures for = 0.212. For more quantitative analyses, we again evaluated the temperature exponents by employing the data at low temperatures of these samples. Nevertheless, at low temperatures, because the intervals of data points are large, the temperature derivatives employed in the above analyses, were not applicable. Hence, in order to obtain the exponent , we fitted the discrete data plots directly by . It is noted that unavoidable errors in the analyses should be taken into account resulting from the larger fitting window for the analyses. In Fig. 5, the stars are the data obtained by the latter method.
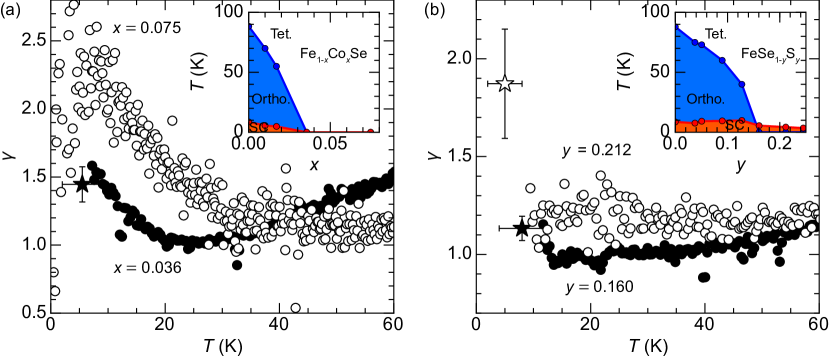
Fig. 5 shows the temperature dependence of for Fe1-xCoxSe () and FeSe1-ySy (). For FeSe1-ySy, is confirmed below 40 K, whereas it deviated to increase toward below 10 K in = 0.212. The situation is reminiscent of the AFM QCP behavior observed in BaFe2(As1-xPx)2 Kasahara et al. (2010); Nakai et al. (2010); Analytis et al. (2014), implying the scenario of nematic QCP and fluctuation. For Fe1-xCoxSe, -linear dependence can be seen from 20 to 30 K for but it increased below 20 K. In = 0.075, gradually increased below 40 K and saturated at around 2 below 10 K. If the -linear dependence could arise from nematic fluctuation around nematic QCP, would be considered to be higher than the value expected from the exact nematic QCP to some extent. Consequently, within this framework of interpretation, it appears that the deviation of from in Fe1-xCoxSe () at low temperatures originates from the crossover between nFL and FL. In order to understand the observed temperature dependence, another possible scenario would be that the orthorhombic nematic phase gradually crossovers to the tetragonal phase at around , where two different features may coexist due to the mixing of nFL and FL states.
Based on the experimental data, we discuss the origin of the anomalous dependence of at low- limit in FeSe1-ySy. The -linear resistivity is prominent around the nematic QCP in = 0.160, whereas it changes to the FL-like one at low temperatures in the overdoped region ( = 0.212). Therefore, the -linear dependence can be regarded as the consequence of the nematic fluctuations instead of the conventional multi band effects Rullier-Albenque et al. (2009). Indeed, the change in temperature dependence of in the phase diagram can well be interpreted in terms of the nematic QCP and its fluctuation. One possible scenario of the nematic order is the orbital order induced by spin fluctuation Yamakawa et al. (2016). In this case, the spin and orbital fluctuation simultaneously enhanced at the nematic QCP and the nFL resistivity curve would be evoked. However, no theoretical studies have been made for behavior under strong orbital fluctuations so far. Another scenario is the spin nematic state also induced by spin fluctuation Fernandes et al. (2010); Wang et al. (2015); Yu and Si (2015). The is known to be -linear under strong two dimensional AFM fluctuations Ueda and Moriya (1975); Hertz (1976); Millis (1993). This is most likely consistent presently with our experimental results, whereas the spin fluctuation in FeSe has been reported to be small and only develop strongly below the nematic transition temperature Böhmer et al. (2015); Baek et al. (2015); Shamoto et al. (2015). In order to clarify this point, other experiments to detect the spin fluctuations for chemically doped samples will be important.
III Conclusion
We measured resistivity () temperature dependences on single crystals of Fe1-xCoxSe () and FeSe1-ySy (). Magnetoresistance (MR) and normal below the onset of the superconducting transition temperature were carefully analyzed. In FeSe1-ySy, -linear was prominent in = 0.160 below 40 K, whereas it changed to a FL-like one below 10 K in = 0.212. These indicate that the nematic QCP resides around = 0.160 and the quantum critical fluctuations give rise to anomalous -linear in a wide temperature range. In Fe1-xCoxSe, gradually changed from the -linear to the quadratic one at low temperatures in the range between = 0.036 and = 0.075. These behaviors could be interpreted by the scenarios of both the nematic QCP and the crossover between orthorhombic nematic and tetragonal phases. In FeSe, both orbital order and spin nematic state have been discussed as primary state under the nematic transition. Since the -linear around the nematic QCP in FeSe1-ySy may be the consequence of the robust quantum critical fluctuations, its further theoretical interpretation would shed light on the mechanism of the electronic nematicity in FeSe.
IV Acknowledgements
This work was performed at High Field Laboratory for Superconducting Materials, Institute for Materials Research, Tohoku University (Project No. 15H0203). Authors are grateful to K. Nakayama, Y. Yamakawa, and H. Kontani for fruitful discussion. One of the authors (T.U.) was supported by the Research Fellowship of Japan Society for the Promotion of Science.
References
- Paglione and Greene (2010) J. Paglione and R. L. Greene, Nat. Phys. 6, 645 (2010).
- Fernandes et al. (2014) R. M. Fernandes, A. V. Chubukov, and J. Schmalian, Nature Phys. 10, 97 (2014).
- Hosono and Kuroki (2015) H. Hosono and K. Kuroki, Physica C 514, 399 (2015).
- Kasahara et al. (2010) S. Kasahara, T. Shibauchi, K. Hashimoto, K. Ikada, S. Tonegawa, R. Okazaki, H. Shishido, H. Ikeda, H. Takeya, K. Hirata, T. Terashima, and Y. Matsuda, Phys. Rev. B 81, 184519 (2010).
- Nakai et al. (2010) Y. Nakai, T. Iye, S. Kitagawa, K. Ishida, H. Ikeda, S. Kasahara, H. Shishido, T. Shibauchi, Y. Matsuda, and T. Terashima, Phys. Rev. Lett. 105, 107003 (2010).
- Hashimoto et al. (2012) K. Hashimoto, K. Cho, T. Shibauchi, S. Kasahara, Y. Mizukami, R. Katsumata, Y. Tsuruhara, T. Terashima, H. Ikeda, M. A. Tanatar, H. Kitano, N. Salovich, R. W. Giannetta, P. Walmsley, A. Carrington, R. Prozorov, and Y. Matsuda, Science 336, 1554 (2012).
- Walmsley et al. (2013) P. Walmsley, C. Putzke, L. Malone, I. Guillamón, D. Vignolles, C. Proust, S. Badoux, A. I. Coldea, M. D. Watson, S. Kasahara, Y. Mizukami, T. Shibauchi, Y. Matsuda, and A. Carrington, Phys. Rev. Lett. 110, 257002 (2013).
- Analytis et al. (2014) J. G. Analytis, H.-H. Kuo, R. D. McDonald, M. Wartenbe, P. M. C. Rourke, N. E. Hussey, and I. R. Fisher, Nat. Phys. 10, 194 (2014).
- Hsu et al. (2008) F.-C. Hsu, J.-Y. Luo, K.-W. Yeh, T.-K. Chen, T.-W. Huang, P. M. Wu, Y.-C. Lee, Y.-L. Huang, Y.-Y. Chu, D.-C. Yan, and M.-K. Wu, Proc. Natl. Aca. Sci. USA 105, 14262 (2008).
- McQueen et al. (2009) T. M. McQueen, A. J. Williams, P. W. Stephens, J. Tao, Y. Zhu, V. Ksenofontov, F. Casper, C. Felser, and R. J. Cava, Phys. Rev. Lett. 103, 057002 (2009).
- Huynh et al. (2014) K. K. Huynh, Y. Tanabe, T. Urata, H. Oguro, S. Heguri, K. Watanabe, and K. Tanigaki, Phys. Rev. B 90, 144516 (2014).
- Nakayama et al. (2014) K. Nakayama, Y. Miyata, G. N. Phan, T. Sato, Y. Tanabe, T. Urata, K. Tanigaki, and T. Takahashi, Phys. Rev. Lett. 113, 237001 (2014).
- Böhmer et al. (2015) A. E. Böhmer, T. Arai, F. Hardy, T. Hattori, T. Iye, T. Wolf, H. v. Löhneysen, K. Ishida, and C. Meingast, Phys. Rev. Lett. 114, 027001 (2015).
- Baek et al. (2015) S.-H. Baek, D. V. Efremov, J. M. Ok, J. S. Kim, J. van den Brink, and B. Büchner, Nat. Mater. 14, 210 (2015).
- Suzuki et al. (2015) Y. Suzuki, T. Shimojima, T. Sonobe, A. Nakamura, M. Sakano, H. Tsuji, J. Omachi, K. Yoshioka, M. Kuwata-Gonokami, T. Watashige, R. Kobayashi, S. Kasahara, T. Shibauchi, Y. Matsuda, Y. Yamakawa, H. Kontani, and K. Ishizaka, Phys. Rev. B 92, 205117 (2015).
- Hosoi et al. (2016) S. Hosoi, K. Matsuura, K. Ishida, H. Wang, Y. Mizukami, T. Watashige, S. Kasahara, Y. Matsuda, and T. Shibauchi, Proc. Natl. Aca. Sci. USA 113, 8139 (2016).
- Ueda and Moriya (1975) K. Ueda and T. Moriya, J. Phys. Soc. Jpn. 39, 605 (1975).
- Hertz (1976) J. A. Hertz, Phys. Rev. B 14, 1165 (1976).
- Millis (1993) A. J. Millis, Phys. Rev. B 48, 7183 (1993).
- Böhmer et al. (2013) A. E. Böhmer, F. Hardy, F. Eilers, D. Ernst, P. Adelmann, P. Schweiss, T. Wolf, and C. Meingast, Phys. Rev. B 87, 180505 (2013).
- Urata et al. (2016) T. Urata, Y. Tanabe, K. K. Huynh, Y. Yamakawa, H. Kontani, and K. Tanigaki, Phys. Rev. B 93, 014507 (2016).
- Mizuguchi et al. (2009) Y. Mizuguchi, F. Tomioka, S. Tsuda, T. Yamaguchi, and Y. Takano, J. Phys. Soc. Jpn. 78, 074712 (2009).
- Landau (1957) L. Landau, J. Exp. Theoret. Phys. 6, 920 (1957).
- Terashima et al. (2014) T. Terashima, N. Kikugawa, A. Kiswandhi, E.-S. Choi, J. S. Brooks, S. Kasahara, T. Watashige, H. Ikeda, T. Shibauchi, Y. Matsuda, T. Wolf, A. E. Böhmer, F. Hardy, C. Meingast, H. v. Löhneysen, M.-T. Suzuki, R. Arita, and S. Uji, Phys. Rev. B 90, 144517 (2014).
- Kasahara et al. (2014) S. Kasahara, T. Watashige, T. Hanaguri, Y. Kohsaka, T. Yamashita, Y. Shimoyama, Y. Mizukami, R. Endo, H. Ikeda, K. Aoyama, T. Terashima, S. Uji, T. Wolf, H. von Löhneysen, T. Shibauchi, and Y. Matsuda, Proc. Natl. Aca. Sci. USA 111, 16309 (2014).
- Rullier-Albenque et al. (2009) F. Rullier-Albenque, D. Colson, A. Forget, and H. Alloul, Phys. Rev. Lett. 103, 057001 (2009).
- Yamakawa et al. (2016) Y. Yamakawa, S. Onari, and H. Kontani, Phys. Rev. X 6, 021032 (2016).
- Fernandes et al. (2010) R. M. Fernandes, L. H. VanBebber, S. Bhattacharya, P. Chandra, V. Keppens, D. Mandrus, M. A. McGuire, B. C. Sales, A. S. Sefat, and J. Schmalian, Phys. Rev. Lett. 105, 157003 (2010).
- Wang et al. (2015) F. Wang, S. A. Kivelson, and D.-H. Lee, Nature Phys. 11, 959 (2015).
- Yu and Si (2015) R. Yu and Q. Si, Phys. Rev. Lett. 115, 116401 (2015).
- Shamoto et al. (2015) S. Shamoto, K. Matsuoka, R. Kajimoto, M. Ishikado, Y. Yamakawa, T. Watashige, S. Kasahara, M. Nakamura, H. Kontani, T. Shibauchi, and Y. Matsuda, ArXiv e-prints (2015), arXiv:1511.04267 .