A study of ro-vibrational OH Emission from Herbig Ae/Be Stars
Abstract
We present a study of ro-vibrational OH and CO emission from 21 disks around Herbig Ae/Be stars. We find that the OH and CO luminosities are proportional over a wide range of stellar ultraviolet luminosities. The OH and CO line profiles are also similar, indicating that they arise from roughly the same radial region of the disk. The CO and OH emission are both correlated with the far-ultraviolet luminosity of the stars, while the PAH luminosity is correlated with the longer wavelength ultraviolet luminosity of the stars. Although disk flaring affects the PAH luminosity, it is not a factor in the luminosity of the OH and CO emission. These properties are consistent with models of UV-irradiated disk atmospheres. We also find that the transition disks in our sample, which have large optically thin inner regions, have lower OH and CO luminosities than non-transition disk sources with similar ultraviolet luminosities. This result, while tentative given the small sample size, is consistent with the interpretation that transition disks lack a gaseous disk close to the star.
1. Introduction
Herbig AeBe Stars (HAeBes) are young (10 Myr) intermediate mass (2-8M⊙) stars whose spectral energy distribution reveals an infrared excess (Herbig, 1960; Waters & Waelkens, 1998; Vieira et al., 2003). They are the precursors to main sequence A-stars many of which have debris disks (Su et al., 2005, 2006) and planets (e.g., as evidenced by planets around “retired” A-stars (Johnson et al. 2010); the pollution of white dwarfs (Zuckerman et al. 2010); and direct imaging of companions (Lagrange et al. 2009)).
HAeBes are characterized as either Group I (flared disks) or Group II (self-shadowed disks) sources based on the infrared color of the spectral energy distribution (SED; Meeus et al. 2001;Dullemond & Monnier 2010). It has been suggested that Group I HAeBes have disks with gaps (i.e., transitional disks; Honda et al., 2012; Maaskant et al., 2013). If so and if these gaps are formed by giant planets, this would confirm the inference that gas giant planets are common around more massive stars (Johnson et al. 2010). Thus HAeBes are prime candidates for studying the signatures of forming supra-Jovian mass companions.
Ro-vibrational emission lines from diatomic molecules such as CO and OH are valuable diagnostics of the inner, planet-forming region of disks around young stars. The properties of ro-vibrational CO emission from disks surrounding HAeBes have been studied extensively (e.g., Blake & Boogert, 2004; Brittain et al., 2007; Banzatti & Pontoppidan, 2015; van der Plas et al., 2015) However, ro-vibrational OH emission has only been observed in a few HAeBes (Mandell et al., 2008; Fedele et al., 2011; Liskowsky et al., 2012). The observation of OH emission is challenging due to the weakness of the features (typically 1-3% of the continuum). This is in part because the fundamental ro-vibrational transitions of OH are divided over four times as many lines as the fundamental ro-vibrational transitions of CO. The total angular momentum of the ground electronic state is so that it is doubly degenerate and each rotational level within the ground electronic state is split (-doubling). Thus, for similar temperatures and abundances, one would expect the fundamental ro-vibrational OH emission lines to be about a factor of four weaker than the fundamental ro-vibrational CO emission lines. However, there has not been a systematic study of how the OH and CO emission from HAeBes compare. The goal of this study is to characterize the OH emission from a group of HAeBes spanning a wide range of spectral types and disk geometries to better understand its relation to the more familiar CO emission as well as what determines the abundance and excitation of OH.
Here we present a study of ro-vibrational OH emission from 21 HAeBes. We focus on the doublet to facilitate comparison with previous studies (e.g. Mandell et al., 2008; Fedele et al., 2011) and because this is the transition with the lowest upper level energy state regularly accessible from the ground. At 3,860 cm-1 above the ground state, the energy of the upper level of this transition is comparable to that of the v=1-0 P19 CO line (E′=3,880 cm-1). The spectra analyzed in this paper were culled from previous observations in the literature (Mandell et al., 2008; Fedele et al., 2011; Liskowsky et al., 2012), data taken from the archives, and new observations. The sample is roughly evenly divided between Group I and Group II sources spanning a broad range of spectral types. To look at the roles various thermo-chemical process play in the excitation of OH emission in disks around HAeBes, we explore the relationship between the luminosity of OH emission and the disk geometry, ultraviolet luminosity of the star, the luminosity of polyaromatic hydrocarbon (PAH) emission, and ro-vibrational CO emission.
2. Observations
We present new observations of eight HAeBes in the band and six HAeBes in the band (Table 1). Seven of the band observations were obtained at the W. M. Keck Observatory with the NIRSPEC echelle spectrograph (McLean et al., 1998). This instrument provided a resolving power of . One source, HD 142527, was observed with CRIRES on the European Southern Observatory Very Large Telescope (Käufl et al. 2004). Our team collected the data for six of the sources. HD 135344b was taken from the Keck Observatory Archive and HD 142527 was taken from the ESO Archive. Among the band observations, three sources (V380 Ori, HD 34282, and CO Ori) were obtained at Gemini South Observatory with the PHOENIX echelle spectrograph (Hinkle et al., 1998, 2000, 2003). This instrument provided a resolving power of . Three other sources were taken from the Keck Observatory Archive (HD 36112, UX Ori, and BF Ori).
Even at the “blue” end of the band where the OH doublet falls, there is a significant thermal continuum background upon which are superimposed night sky emission lines (mostly water). The intensities of these telluric lines scale with the air mass and column density of atmospheric water vapor, which can vary both temporally and spatially through the night. To cancel the sky emission, the telescope was nodded 15, along the slit axis in an A, B, B, A sequence with each step corresponding to 1 minute of integration time. Combining the scans as (ABB+A)/2 canceled the background to first order.
Flats and darks were taken before the grating was moved and used to remove systematic effects. The 2-dimensional frames were cleaned of systematically hot and dead pixels as well as cosmic ray hits, and were then resampled spatially and spectrally so that the spectral and spatial dimensions are orthogonal. The CRIRES spectrum was reduced using the ESO CRIRES pipeline following a similar procedure.
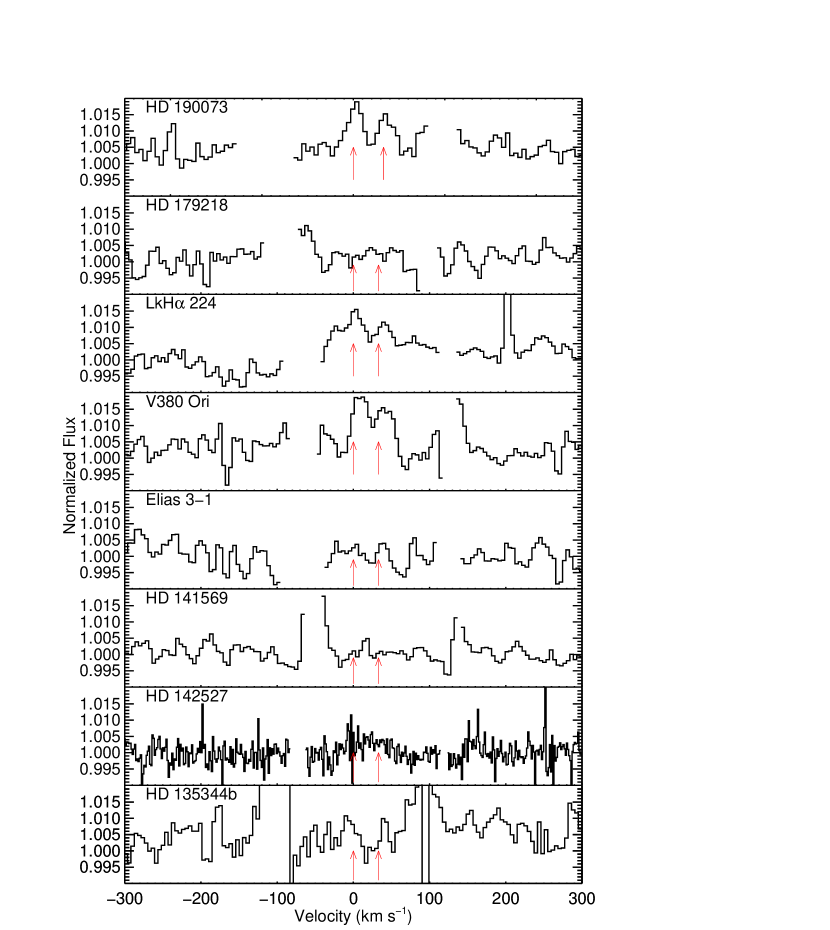
The data were wavelength calibrated by fitting the telluric lines in the spectra with the Spectrum Synthesis Program (SSP Kunde & Maguire, 1974), which accesses the 2000HITRAN molecular database (Rothman et al., 2003). Spectra of hot stars were taken at similar airmasses throughout the observations for telluric correction. The line fluxes were calculated by scaling the equivalent width to the continuum flux inferred from ground based IR photometry. The log of the observations is presented in Table 1 and the telluric corrected spectra are presented in Figure 1.
Our full sample of HAeBes have spectral types that range from F6 to B2 (Table 2). In addition to the new observations presented here, we include 13 previously published OH measurements (Mandell et al., 2008; Fedele et al., 2011; Brittain et al., 2014) and 9 previously published CO measurements (Brittain et al., 2007; van der Plas et al., 2015) of HAeBes (Table 3).
3. Results
The v=1-0 OH emission doublet is detected in 4 of the 8 sources reported in this paper (Fig. 1). This is consistent with the overall detection rate of OH reported in the literature (6 of 13; Table 3; Mandell et al., 2008; Fedele et al., 2011; Liskowsky et al., 2012).
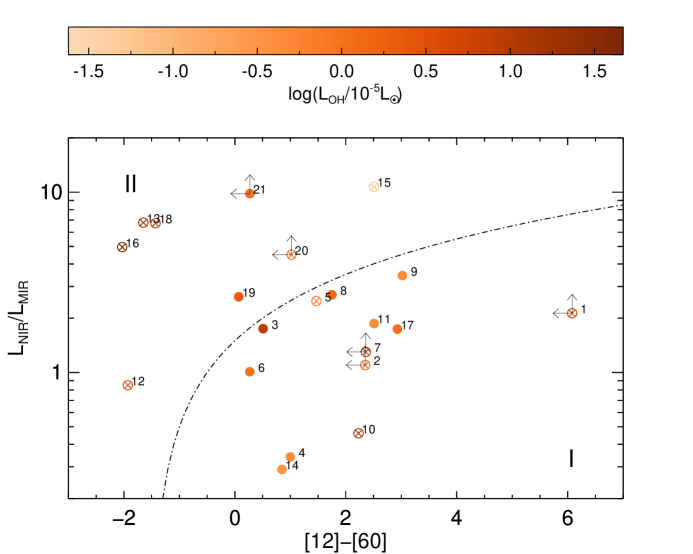
HAeBes are broadly separated into two groups: those with flaring disks (Group I) and those with flat disks (Group II; Meeus et al., 2001). What was initially a qualitative description of the infrared portion of the SED, was quantified by Acke & van den Ancker (2004) where systems with LNIR/LMIR [12]-[60] + 0.9 are Group I and the others are Group II. A different dividing line was proposed by van Boekel et al. (2005) where LNIR/LMIR [12]-[60] + 1.5 are Group I sources. LNIR is the integrated luminosity from 1–5, LMIR is the integrated luminosity from 12–60, and [12]–[60]=–2.5log(L12µm/L60µm). L12µm is the flux density at 12 and L60µm is the flux density at 60.
The evolving definition of Group I and Group II has resulted in conflicting designations in the literature. For example, V380 Ori is labeled a Group II star by van Boekel et al. (2005) and Group I star by Fedele et al. (2011). Similarly, LkH 224 is considered a Group II source by Acke et al. (2004) and a Group I source by Acke et al. (2010). Here we separate the sources into Group I and Group II using the infrared photometry reported in Table 3 in order to self consistently define our sample. We adopt the definition of Group I and Group II sources provided by van Boekel et al. (2005). The near infrared flux was taken from 2MASS and WISE. The midinfrared flux was taken from IRAS. To integrate the flux from the photometric points, a 100 element array was created using cubic spline interpolation for both the measured specific flux and wavelength. The integral was determined numerically using the trapezoid rule.
The full sample is comprised of 13 Group I targets and 8 Group II targets (Fig. 2). This sample includes several disks with large inner holes: HD 100546 (inferred from coronographic imagery; Grady et al., 2005), HD 135344b(inferred from SED modeling; Brown et al., 2007), HD 142527 (inferred from SED modeling combined with resolved MIR imagery; Verhoeff et al., 2011), HD 179218 (MIR interferometry; Menu et al., 2015), and HD 141569 (inferred from resolved MIR imagery; Marsh et al., 2002). HD 142527 has a low mass stellar companion orbiting near the inner rim of the circumstellar disk (Close et al., 2014; Biller et al., 2012).
The OH doublet is detected in 8 of the 13 Group I sources (61%) and 2 of the 8 Group II sources (25%). OH emission is observed in 2 of the 5 transition disk objects (HD 142527 and HD 100546). Several of the Group I sources for which OH is detected fall very close to the Group I/II boundary, and therefore the difference between the detection rate of OH emission from Group I and Group II HAeBes should be interpreted with caution. There is no clear trend between the luminosity of the OH emission and infrared colors of these stars (Fig. 2).
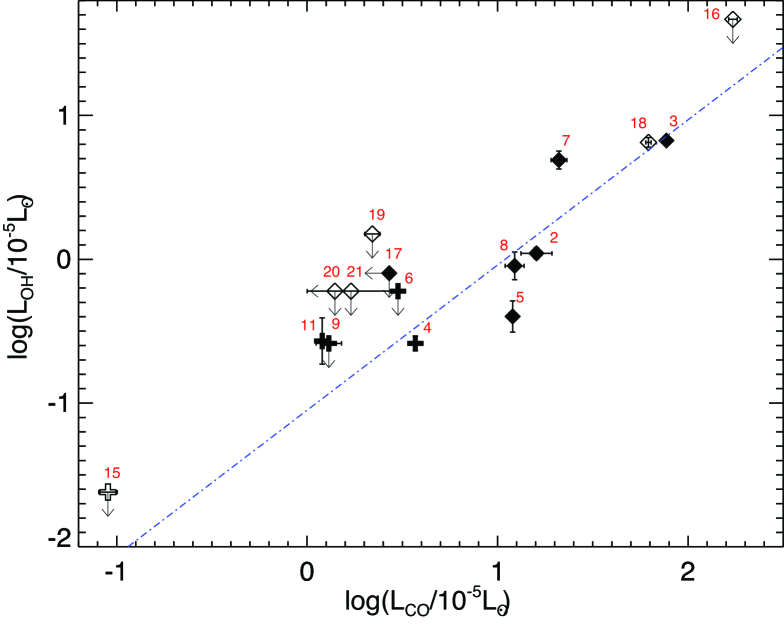
We plot the luminosity of the v=1-0 OH emission doublet relative to the v=1-0 P30 CO line (Fig. 3). The sources for which OH and CO are detected are well fit with a power law where . The typical ratio of the luminosity of the CO to the OH is 11.00.2. None of the non-detections of OH emission are sensitive enough to place an upper limit on the OH/CO ratio lower than the line fit to the detections. If the temperature and emitting area of the OH and CO gas are similar and the gas is optically thin, then the abundance of the OH gas is comparable to CO in systems spanning several dex in UV luminosity (see Table 3). The transition disks are clustered among the weakest OH and CO emitters in the sample (Figs. 3, 5, and 6).
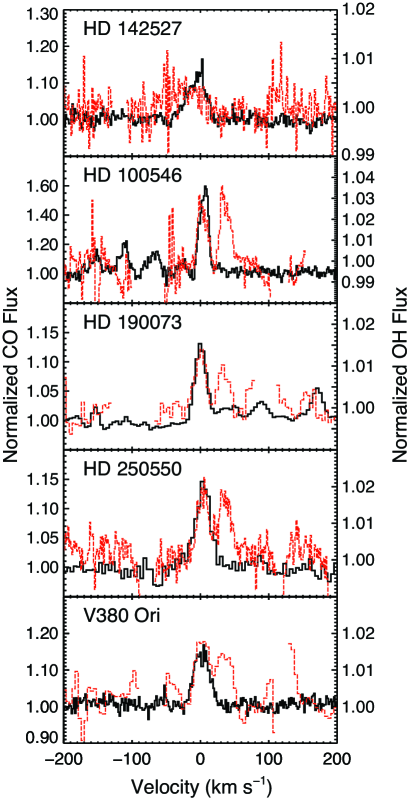
For five of the sources in our sample, we have resolved OH and CO emission lines. The line profiles of the OH and CO emission lines are consistent to within the signal to noise for four of the stars (though the S/N of HD 142527 is too low to say anything definitive; Fig. 4). The exception is HD 100546 where the OH and CO line profiles are not consistent (see also Liskowsky et al., 2012). While the widths of the HD 100546 lines are similar, the shapes of the asymmetries are different. Previous studies of the CO emission show that the the v=1-0 lines are comprised of two components – a symmetric line arising from the circumstellar disk extending from 14 AU to beyond 50 AU and a variable component arising from a localized source of emission in a Keplerian orbit near the inner edge of the circumstellar disk (Brittain et al., 2014).
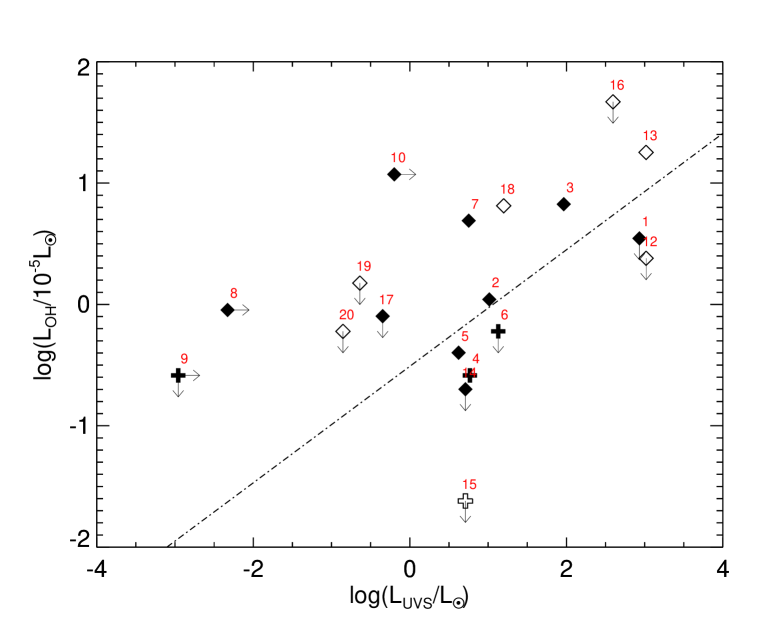
To explore the role the stellar UV field plays in producing the observed molecular emission, we compare the luminosity of the OH, CO, and PAH emission to the ultraviolet luminosity of the HAeBes (Figs. 5-7). Most of the sources were observed with IUE (Table 3; Valenti et al., 2000, 2003). For sources not observed with IUE, we determined the spectral type of the star and calculated the UV luminosity from a matching stellar template (see Table 3 for the template stars). One star, HD 142527 (SpT F6), has no template or UV observation and is left out of this analysis. Stars with a spectral type later than A5 may have a UV flux dominated by the accretion luminosity of the star, thus the UV luminosity reported for these objects should be taken as a lower limit. We consider the short wavelength portion of the UV spectrum (1300Å 1850Å; LUVS) separately from the long wavelength portion (2430Å 3200Å; LUVL). The radiation at the short wavelength end of the spectrum enhances OH emission both by photodissociating H2O to produce OH, possibly in an excited state, and by heating the gas. The longer wavelength radiation excites PAHs.
In figure 5, we plot the luminosity of the OH doublet as a function of the short wavelength ultraviolet luminosity. The sources that are brightest at ultraviolet wavelengths also reveal the brightest OH emission lines. The stars with transition disks have weaker OH emission than HAeBes of the same LUVS. To quantify the correlation between the logarithm of the OH luminosity and the logarithm of the short wavelength luminosity we apply Kendall’s correlation test using ASURV Rev 1.2 (Isobe & Feigelson 1990; LaValley, Isobe & Feigelson 1992), which implements the methods presented in (Isobe,Feigelson & Nelson 1986). This test finds that there is a 1.5% chance that a correlation is not present in the data. We use the Buckley-James regression test using ASURV Rev 1.2 to find the best least-squares fit to the data and find .
One outlier in this data set is the transition disk HD 141569 (source 15). HD 141569 is a low mass transition disk with a large inner hole and cool molecular gas (e.g., Zuckerman, Forveille, & Kastner 1995; Brittain et al. 2003; Dent et al. 2005). This source has a particularly low gas (Thi et al., 2014) and dust mass (Dent et al., 2005) and bridges the gap between gas rich transition disks and debris disks mostly emptied of their primordial gas. If the OH and CO in the system are roughly the same temperature (200 K; Brittain et al. 2007), it is unlikely that the upper states of the v=1-0 OH doublet will be populated at the same level as the other systems with much warmer gas. Unfortunately, the lower-J OH lines are generally not accessible from the ground except under exceptionally dry conditions. If we set aside HD 141569 from our statistical analysis, the probability that the data are not correlated does not change substantially (1%), and the fit to the data from the Buckley-James method changes to .
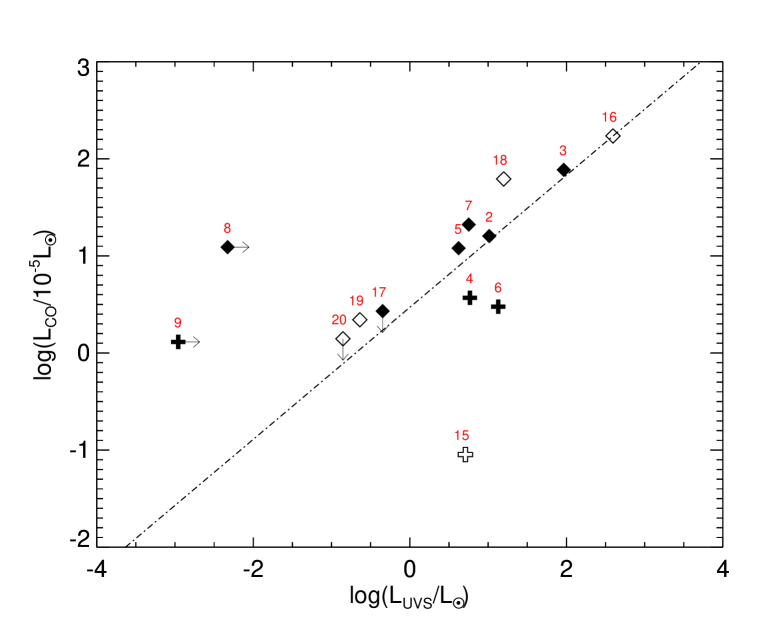
In figure 6, we plot the the luminosity of the CO emission as a function of the short wavelength ultraviolet luminosity and see a similar trend. The stars with transition disks also show systematically lower CO emission than their classical counterparts with comparable LUVS. The correlation test by the generalized Kendall’s indicates that the probability that the data are not correlated is 0.07% if we set aside HD 141569. The linear regression using the Buckley-James method indicates that .
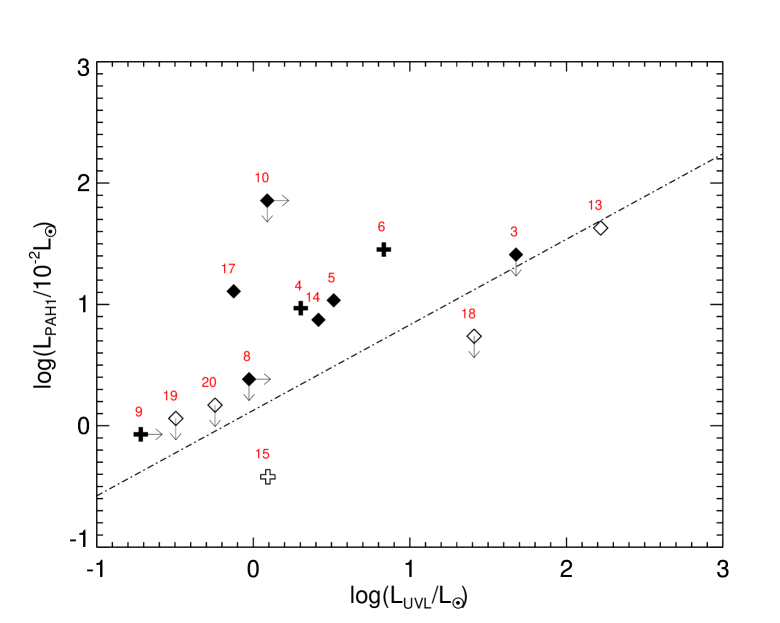
Finally, we consider the relationship between the log of the luminosity of the PAHs and the log of the UV luminosity (Fig. 7). While the trend is similar, there is more scatter and the transition disk objects are not systematically fainter than the other sources. However, the luminosities of the PAH emission from the Group II sources is lower than those from the Group I sources with the same long-wavelength UV luminosity. The probability that the quantities are not correlated is 5% and the linear regression by the Buckley-James method indicates that .
4. Discussion and Conclusions
The disks surrounding HAeBes are gas rich as evidenced by their high accretion rates (Fairlamb et al., 2015; Mendigutía et al., 2015). However, HAeBes are powerful UV emitters, making protoplanetary disks challenging environments for the synthesis and survival of prebiotic molecules, particularly when grains, the usual UV absorbers, have settled out of disk atmospheres. Recent studies of T Tauri disks, the lower mass counterparts of HAeBes, show how water synthesized in disk atmospheres absorbs stellar UV through photodissociation, yielding OH (Bethell & Bergin, 2009; Du & Bergin, 2014; Ádámkovics et al., 2014).
The trends observed in Figures 3, 5, 6, and 7 can be explained simply in this picture of a disk irradiated by stellar UV photons. In dissociating water at the disk surface, the UV not only enhances the abundance of OH there, but it also heats the disk surface (Du & Bergin, 2014; Ádámkovics et al., 2014, 2016; Glassgold & Najita, 2015).
In models of UV-irradiated disk atmospheres (e.g., Ádámkovics et al., 2016), CO and OH are both abundant in the warm surface region of the disk atmosphere (at 1000K), which is heated by UVS (FUV continuum and Ly) through photodissociation and photochemical pathways. In accordance with this picture, we find that the CO and OH line profiles are consistent with each other (Fig. 4), hinting that the gas arises from the same region of the disk, as expected from models.
The excitation mechanism of the OH emission discussed here is uncertain. In principle, OH can be UV fluoresced similarly to CO as OH possesses bound excited electronic states. However, collisions can quench UV fluorescence such that the final population of the vibrational levels of OH are determined collisionally. When collisional cross sections for vibrational excitation of OH with partner species such as H, H2, and He are available, detailed studies OH excitation can be carried out. In the meantime, our data hints that the OH and CO excitation mechanism are related, as the ratio of their fluxes are constant over a wide range of disk geometries and UV luminosities (Fig. 3).
Group I disks are flared while Group II disks are flat (Meeus et al., 2001), thus Group I disks intercept a larger fraction of the stellar flux. Because of this, one might expect that the ro-vibrational emission of molecules would be brighter among Group I disks than among Group II disks. This difference is not observed (Fig. 2). Nor do we find a difference in the relationship between OH and the UV luminosity or CO and the UV luminosity between Group I HAeBes and Group II HAeBes. One possibility is that this grouping conflates varying degrees of disk clearing and flaring (e.g., Menu et al., 2015) obscuring any distinction in luminosity of ro-vibrational emission lines between Group I and Group II sources.
We have identified five systems in our sample with cleared inner disks. Compared to the “normal” HAeBes, transition disks are missing the warm disk close to the star, so they are expected to have systematically fainter OH and CO emission relative to full disks (Figs. 3, 5, & 6). In contrast to the CO and OH emission, which depends on the intensity of incident UVS photons, PAH emission can be generated by UVL photons that are absorbed at any distance from the star. As long as the disk intercepts the long wavelength ultraviolet radiation at some radius, PAH emission can be produced. As a result, PAH emission should depend less sensitively on whether the inner disk is missing or not. Accordingly, the transition disk objects are not systematically offset relative to the full disks (Fig. 7). However, the amount of disk flaring will affect the PAH luminosity. As a result, the less flared Group II sources have systematically fainter PAH flux for the same long-wavelength UV luminosity.
Further work can better quantify the relation of ro-vibrational OH emission to ro-vibrational CO emission. We did not measure the rotational temperature of the OH for the stars in our sample, nor do we have the data necessary to explore the excitation mechanism of the OH. For most of the sources where OH is detected, only the P4.5 doublet was targeted. In a few sources where there was a detection of OH, there are no corresponding CO observations. If the OH and CO are co-radially located but at different temperatures, this will suggest that we are probing gas at different depths into the disk. The data do not show evidence of enhanced OH emission concentrated at the inner rim of disks with holes, however, higher resolution and signal to noise data of the transition disk objects are necessary to draw firm conclusions. The availability of new large format detectors on high resolution NIR spectrographs such as iSHELL on NASA’s Infrared Telescope Facility and the refurbished CRIRES on ESO’s VLT will enable such studies.
References
- Acke et al. (2010) Acke, B., Bouwman, J., Juhász, A., et al. 2010, ApJ, 718, 558
- Acke & van den Ancker (2004) Acke, B., & van den Ancker, M. E. 2004, A&A, 426, 151
- Acke et al. (2004) Acke, B., van den Ancker, M. E., Dullemond, C. P., van Boekel, R., & Waters, L. B. F. M. 2004, A&A, 422, 621
- Ádámkovics et al. (2014) Ádámkovics, M., Glassgold, A. E., & Najita, J. R. 2014, ApJ, 786, 135
- Ádámkovics et al. (2016) Ádámkovics, M., Najita, J. R., & Glassgold, A. E. 2016, ApJ, 817, 82
- Alecian et al. (2009) Alecian, E., Wade, G. A., Catala, C., et al. 2009, MNRAS, 400, 354
- Antonellini et al. (2016) Antonellini, S., Kamp, I., Lahuis, F., et al. 2016, A&A, 585, A61
- Banzatti & Pontoppidan (2015) Banzatti, A., & Pontoppidan, K. M. 2015, ApJ, 809, 167
- Bethell & Bergin (2009) Bethell, T., & Bergin, E. 2009, Science, 326, 1675
- Biller et al. (2012) Biller, B., Lacour, S., Juhász, A., et al. 2012, ApJ, 753, L38
- Blake & Boogert (2004) Blake, G. A., & Boogert, A. C. A. 2004, ApJ, 606, L73
- Blondel & Djie (2006) Blondel, P. F. C., & Djie, H. R. E. T. A. 2006, A&A, 456, 1045
- Brittain et al. (2014) Brittain, S. D., Carr, J. S., Najita, J. R., Quanz, S. P., & Meyer, M. R. 2014, ApJ, 791, 136
- Brittain et al. (2003) Brittain, S. D., Rettig, T. W., Simon, T., et al. 2003, ApJ, 588, 535
- Brittain et al. (2007) Brittain, S. D., Simon, T., Najita, J. R., & Rettig, T. W. 2007, ApJ, 659, 685
- Brown et al. (2007) Brown, J. M., Blake, G. A., Dullemond, C. P., et al. 2007, ApJ, 664, L107
- Close et al. (2014) Close, L. M., Follette, K. B., Males, J. R., et al. 2014, ApJ, 781, L30
- Dent et al. (2005) Dent, W. R. F., Greaves, J. S., & Coulson, I. M. 2005, MNRAS, 359, 663
- Dent et al. (2013) Dent, W. R. F., Thi, W. F., Kamp, I., et al. 2013, PASP, 125, 477
- Dolan & Mathieu (2001) Dolan, C. J., & Mathieu, R. D. 2001, AJ, 121, 2124
- Du & Bergin (2014) Du, F., & Bergin, E. A. 2014, ApJ, 792, 2
- Dullemond & Monnier (2010) Dullemond, C. P., & Monnier, J. D. 2010, ARA&A, 48, 205
- Dunkin et al. (1997) Dunkin, S. K., Barlow, M. J., & Ryan, S. G. 1997, MNRAS, 286, 604
- Fairlamb et al. (2015) Fairlamb, J. R., Oudmaijer, R. D., Mendigutía, I., Ilee, J. D., & van den Ancker, M. E. 2015, MNRAS, 453, 976
- Fedele et al. (2011) Fedele, D., Pascucci, I., Brittain, S., et al. 2011, ApJ, 732, 106
- Flower (1996) Flower, P. J. 1996, ApJ, 469, 355
- Glassgold & Najita (2015) Glassgold, A. E., & Najita, J. R. 2015, ApJ, 810, 125
- Grady et al. (2005) Grady, C. A., Woodgate, B., Heap, S. R., et al. 2005, ApJ, 620, 470
- Grady et al. (2009) Grady, C. A., Schneider, G., Sitko, M. L., et al. 2009, ApJ, 699, 1822
- Hales et al. (2014) Hales, A. S., De Gregorio-Monsalvo, I., Montesinos, B., et al. 2014, AJ, 148, 47
- Herbig (1960) Herbig, G. H. 1960, The Astrophysical Journal Supplement, 4, 337
- Herbig & Bell (1988) Herbig, G. H., & Bell, K. R. 1988, Third Catalog of Emission-Line Stars of the Orion Population : 3 : 1988
- Herbst (1975) Herbst, W. 1975, AJ, 80, 212
- Hernández et al. (2004) Hernández, J., Calvet, N., Briceño, C., Hartmann, L., & Berlind, P. 2004, AJ, 127, 1682
- Hinkle et al. (1998) Hinkle, K. H., Cuberly, R. W., Gaughan, N. A., et al. 1998, in Proc. SPIE, Vol. 3354, Infrared Astronomical Instrumentation, ed. A. M. Fowler, 810–821
- Hinkle et al. (2000) Hinkle, K. H., Joyce, R. R., Sharp, N., & Valenti, J. A. 2000, in Proc. SPIE, Vol. 4008, Optical and IR Telescope Instrumentation and Detectors, ed. M. Iye & A. F. Moorwood, 720–728
- Hinkle et al. (2003) Hinkle, K. H., Blum, R. D., Joyce, R. R., et al. 2003, in Proc. SPIE, Vol. 4834, Discoveries and Research Prospects from 6- to 10-Meter-Class Telescopes II, ed. P. Guhathakurta, 353–363
- Honda et al. (2012) Honda, M., Maaskant, K., Okamoto, Y. K., et al. 2012, ApJ, 752, 143
- Isobe et al. (1990) Isobe, T., Feigelson, E. D., Akritas, M. G., & Babu, G. J. 1990, ApJ, 364, 104
- Isobe et al. (1986) Isobe, T., Feigelson, E. D., & Nelson, P. I. 1986, ApJ, 306, 490
- Johnson et al. (2010) Johnson, J. A., Howard, A. W., Bowler, B. P., et al. 2010, PASP, 122, 701
- Käufl et al. (2004) Käufl, H.-U., Ballester, P., Biereichel, P., et al. 2004, in Society of Photo-Optical Instrumentation Engineers (SPIE) Conference Series, Vol. 5492, Ground-based Instrumentation for Astronomy, ed. A. F. M. Moorwood & M. Iye, 1218–1227
- Kunde & Maguire (1974) Kunde, V. R., & Maguire, W. C. 1974, J. Quant. Spec. Radiat. Transf., 14, 803
- Lagrange et al. (2009) Lagrange, A.-M., Gratadour, D., Chauvin, G., et al. 2009, A&A, 493, L21
- Lavalley et al. (1992) Lavalley, M., Isobe, T., & Feigelson, E. 1992, in Astronomical Society of the Pacific Conference Series, Vol. 25, Astronomical Data Analysis Software and Systems I, ed. D. M. Worrall, C. Biemesderfer, & J. Barnes, 245
- Liskowsky et al. (2012) Liskowsky, J. P., Brittain, S. D., Najita, J. R., et al. 2012, ApJ, 760, 153
- Maaskant et al. (2013) Maaskant, K. M., Honda, M., Waters, L. B. F. M., et al. 2013, A&A, 555, A64
- Mandell et al. (2008) Mandell, A. M., Mumma, M. J., Blake, G. A., et al. 2008, ApJ, 681, L25
- Marsh et al. (2002) Marsh, K. A., Silverstone, M. D., Becklin, E. E., et al. 2002, ApJ, 573, 425
- McLean et al. (1998) McLean, I. S., Becklin, E. E., Bendiksen, O., et al. 1998, in Society of Photo-Optical Instrumentation Engineers (SPIE) Conference Series, Vol. 3354, Infrared Astronomical Instrumentation, ed. A. M. Fowler, 566–578
- Meeus et al. (2001) Meeus, G., Waters, L. B. F. M., Bouwman, J., et al. 2001, A&A, 365, 476
- Meeus et al. (2012) Meeus, G., Montesinos, B., Mendigutía, I., et al. 2012, A&A, 544, A78
- Mendigutía et al. (2015) Mendigutía, I., de Wit, W. J., Oudmaijer, R. D., et al. 2015, MNRAS, 453, 2126
- Mendigutía et al. (2014) Mendigutía, I., Fairlamb, J., Montesinos, B., et al. 2014, ApJ, 790, 21
- Menu et al. (2015) Menu, J., van Boekel, R., Henning, T., et al. 2015, A&A, 581, A107
- Merín et al. (2004) Merín, B., Montesinos, B., Eiroa, C., et al. 2004, A&A, 419, 301
- Montesinos et al. (2009) Montesinos, B., Eiroa, C., Mora, A., & Merín, B. 2009, A&A, 495, 901
- Mooley et al. (2013) Mooley, K., Hillenbrand, L., Rebull, L., Padgett, D., & Knapp, G. 2013, ApJ, 771, 110
- Mora et al. (2001) Mora, A., Merín, B., Solano, E., et al. 2001, A&A, 378, 116
- Pontoppidan et al. (2010) Pontoppidan, K. M., Salyk, C., Blake, G. A., et al. 2010, ApJ, 720, 887
- Reipurth et al. (2013) Reipurth, B., Bally, J., Aspin, C., et al. 2013, AJ, 146, 118
- Rothman et al. (2003) Rothman, L. S., Barbe, A., Benner, D. C., et al. 2003, J. Quant. Spec. Radiat. Transf., 82, 5
- Shevchenko et al. (1991) Shevchenko, V. S., Ibragimov, M. A., & Chernysheva, T. L. 1991, AZh, 68, 466
- Su et al. (2005) Su, K. Y. L., Rieke, G. H., Misselt, K. A., et al. 2005, ApJ, 628, 487
- Su et al. (2006) Su, K. Y. L., Rieke, G. H., Stansberry, J. A., et al. 2006, ApJ, 653, 675
- The et al. (1994) The, P. S., de Winter, D., Perez, M. R., & The, P. S. 1994, Astronomy and Astrophysics Suppl. 104, 104, 315
- Thi et al. (2014) Thi, W.-F., Pinte, C., Pantin, E., et al. 2014, A&A, 561, A50
- Valenti et al. (2003) Valenti, J. A., Fallon, A. A., & Johns-Krull, C. M. 2003, ApJS, 147, 305
- Valenti et al. (2000) Valenti, J. A., Johns-Krull, C. M., & Linsky, J. L. 2000, ApJS, 129, 399
- van Boekel et al. (2005) van Boekel, R., Min, M., Waters, L. B. F. M., et al. 2005, A&A, 437, 189
- van der Plas et al. (2015) van der Plas, G., van den Ancker, M. E., Waters, L. B. F. M., & Dominik, C. 2015, A&A, 574, A75
- van Leeuwen (2007) van Leeuwen, F. 2007, A&A, 474, 653
- Verhoeff et al. (2011) Verhoeff, A. P., Min, M., Pantin, E., et al. 2011, A&A, 528, A91
- Vieira et al. (2003) Vieira, S. L. A., Corradi, W. J. B., Alencar, S. H. P., et al. 2003, AJ, 126, 2971
- Waters & Waelkens (1998) Waters, L. B. F. M., & Waelkens, C. 1998, ARA&A, 36, 233
- Zuckerman et al. (1995) Zuckerman, B., Forveille, T., & Kastner, J. H. 1995, Nature, 373, 494
- Zuckerman et al. (2010) Zuckerman, B., Melis, C., Klein, B., Koester, D., & Jura, M. 2010, ApJ, 722, 725
| Star | Date Obs | Airmass | Int Time |
|---|---|---|---|
| m | |||
| band data | |||
| HD 179218 | September 13, 2014 | 1.02 | 48 |
| V380 Ori | September 13, 2014 | 1.46 | 44 |
| HD 135344b | July 13, 2009 | 1.84 | 16 |
| LkH 224 | September 13, 2014 | 1.09 | 56 |
| HD 142527 | May 29, 2013 | 1.05 | 10 |
| Elias 3-1 | September 13, 2014 | 1.24 | 76 |
| HD 141569 | April 8, 2014 | 1.16 | 32 |
| HD 190073 | September 13, 2014 | 1.31 | 40 |
| band data | |||
| V380 Ori | January 13, 2006 | 1.65 | 16 |
| CO Ori | January 13, 2006 | 1.91 | 20 |
| HD 34282 | January 14, 2006 | 1.07 | 40 |
| Number | Star | Alt Name | SpTaaThe spectral types are adopted from Valenti et al. 2003 unless o therwise noted. These authors adopted the spectral type from either the Herbig-Bell Catalog or Thé et al. (1994) unless they found a large discrepancy between the UV spectrum of the star and the template spectrum. In such cases they adopted spectral type of the best fitting template. | diifrom van Leewen et al. 2007 unless otherwise noted | Group | log(Teff)ooEffective temperatures converted from the intrinsic B-V color using the relationship described in Flower (1996) unless otherwise noted. |
|---|---|---|---|---|---|---|
| pc | K | |||||
| 1 | HD 76534 | OU Vel | B2 | 870jjHerbst 1975 | I | 4.28 |
| 2 | HD 259431 | MWC 147 | B5 | 17040 | I | 4.15 |
| 3 | HD 250550 | V1307 Ori | B7 | 11761993 | I | 4.11 |
| 4 | HD 100546 | KR Mus | B9 | 974 | I | 4.04 |
| 5 | HD 31293 | AB Aur | A0 | 14020 | I | 3.99 |
| 6 | HD 179218 | MWC 614 | A0 | 25040 | I | 3.99 |
| 7 | MWC 765 | V380 Ori | A1 | 450kkdistance inferred by Blondel & Tjin A Djie 2006 based on cluster membership | I | 3.97 |
| 8 | HD 36112 | MWC 758 | A8bbVieira et al. 2003 | 28070 | I | 3.87 |
| 9 | HD 135344b | SAO 206462 | F4ccDunkin et al. 1997; Grady et al. 2009 | 140ccDunkin et al. 1997; Grady et al. 2009 | I | 3.83 |
| 10 | LkH 224 | V1686 Cyg | F9/A4ddA4, Mora et al. 2001; F9, Hernandez et al. 2004 | 980[13] | I | 3.92 |
| 11 | HD 142527 | F6eeMendigutia et al. 2014 | 14020eeMendigutia et al. 2014 | I | 3.82eeMendigutia et al. 2014 | |
| 12 | HD 45677 | FS Cma | B2 | 28070 | II | 4.33 |
| 13 | HD 85567 | V596 Car | B2ffHales et al. 2014 | 770ffHales et al. 2014 | II | 4.33 |
| 14 | Elias 3-1 | V892 Tau | B8.5-A0ggMooley et al. 2013 | 140ggMooley et al. 2013 | I | 4.02 |
| 15 | HD 141569 | B9.5 | 1038 | II | 4.01 | |
| 16 | HD 98922 | B9/A2 | 1200500 | II | 3.95 | |
| 17 | HD 34282 | V1366 Ori | A3hhMerin et al. 2004 | 350hhMerin et al. 2004 | I | 3.93 |
| 18 | HD 190073 | V1295 Aql | A2 | 767mmMontesino et al. 2009 | II | 3.95 |
| 19 | HD 293782 | UX Ori | A3 | 400kkdistance inferred by Blondel & Tjin A Djie 2006 based on cluster membership | II | 3.93 |
| 20 | BF Ori | A5 | 450kkdistance inferred by Blondel & Tjin A Djie 2006 based on cluster membership | II | 3.91 | |
| 21 | CO Ori | F7 | 450lldistance based on membership in l Ori, and cluster distance determined by Dolan & Mathieu 2001 | II | 3.80 | |
| 22 | ppTemplate stars used to estimate the UV luminosity of stars without IUE dataHD 37776 | B2 | 33060 | |||
| 23 | ppTemplate stars used to estimate the UV luminosity of stars without IUE dataHD 196519 | B8 | 24116 | |||
| 24 | ppTemplate stars used to estimate the UV luminosity of stars without IUE dataHD 172167 | A0 | 7.70.02 | |||
| 25 | ppTemplate stars used to estimate the UV luminosity of stars without IUE dataHD 102647 | A3 | 110.06 | |||
| 26 | ppTemplate stars used to estimate the UV luminosity of stars without IUE dataHD 13041 | A4 | 58.70.9 | |||
| 27 | ppTemplate stars used to estimate the UV luminosity of stars without IUE dataHD 11636 | A5 | 180.2 | |||
| 28 | ppTemplate stars used to estimate the UV luminosity of stars without IUE dataHD 28910 | A8 | 491 | |||
| 29 | ppTemplate stars used to estimate the UV luminosity of stars without IUE dataHD 8799 | F4 | 250.3 |
| No. | Star | [12]-[60] | LNIR/LMIR | LUVaaIntegrated UV flux from 1300Å - 2430Å. From IUE spectra presented by Valenti et al. (2000, 2003) unless otherwise noted | LUVSbbIntegrated UV flux from 1300Å - 1850Å. From IUE spectra presented by Valenti et al. (2000, 2003) unless otherwise noted | LUVLccIntegrated UV flux from 2430Å - 3200Å. From IUE spectra presented by Valenti et al. (2000, 2003) unless otherwise noted | LPAH | LPAH | LCO | LOH |
|---|---|---|---|---|---|---|---|---|---|---|
| 7.8µm | 11.3µm | (1,0)P30 | (1,0)P4.5(+1,-1) | |||||||
| L☉ | L☉ | L☉ | 10-2L☉ | 10-2L☉ | 10-5L☉ | 10-5L☉ | ||||
| 1 | HD 76534 | 6.08 | 2.13 | 1430ddUV flux inferred from a template star with a matching spectral type from Valenti et al. (2003). | 1043ddUV flux inferred from a template star with a matching spectral type from Valenti et al. (2003). | 166ddUV flux inferred from a template star with a matching spectral type from Valenti et al. (2003). | 3.5ggFedele et al. 2011 | |||
| 2 | HD 259431 | 2.35 | 1.10 | 15.1 | 10.4 | 3.5 | 2.86 | 163eeBrittain et al. 2007 | 1.10.1ggFedele et al. 2011 | |
| 3 | HD 250550 | 0.51 | 1.75 | 157 | 93 | 48 | 25.7 | 3.86 | 773eeBrittain et al. 2007 | 6.70.5ggFedele et al. 2011 |
| 4 | HD 100546 | 1.00 | 0.34 | 8.5 | 5.9 | 2 | 9.31 | 11.3 | 4.20.2ffvan der Plas et al. 2015 | 0.260.03hhBrittain et al. 2014 |
| 5 | HD 31293 | 1.47 | 2.49 | 7.8 | 4.2 | 3.3 | 10.8 | 0.66 | 12.00.8eeBrittain et al. 2007 | 0.40.1iiMandel et al. 2008 |
| 6 | HD 179218 | 0.27 | 1.01 | 21.7 | 13.5 | 6.8 | 28.4 | 2.78 | 3.00.2ffvan der Plas et al. 2015 | 0.6jjThis work |
| 7 | MWC 765 | 2.36 | 1.30 | 8.6 | 5.7 | 3.1 | 212 | 4.90.7ggFedele et al. 2011 | ||
| 8 | HD 36112 | 1.75 | 2.70 | 0.48ddUV flux inferred from a template star with a matching spectral type from Valenti et al. (2003). | 0.005ddUV flux inferred from a template star with a matching spectral type from Valenti et al. (2003). | 0.94ddUV flux inferred from a template star with a matching spectral type from Valenti et al. (2003). | 2.42 | 0.48 | 12.31.4ffvan der Plas et al. 2015 | 0.90.2iiMandel et al. 2008 |
| 9 | HD 135344b | 3.02 | 3.45 | 0.05ddUV flux inferred from a template star with a matching spectral type from Valenti et al. (2003). | 0.001ddUV flux inferred from a template star with a matching spectral type from Valenti et al. (2003). | 0.19ddUV flux inferred from a template star with a matching spectral type from Valenti et al. (2003). | 0.85 | 0.16 | 1.30.2 | 0.3jjThis work |
| 10 | LkH 224 | 2.23 | 0.46 | 1.8ddUV flux inferred from a template star with a matching spectral type from Valenti et al. (2003). | 0.6ddUV flux inferred from a template star with a matching spectral type from Valenti et al. (2003). | 1.20ddUV flux inferred from a template star with a matching spectral type from Valenti et al. (2003). | 71.7 | 2.08 | 11.82.7jjThis work | |
| 11 | HD 142527 | 2.51 | 1.87 | 2.80.3 | 0.10.1kkfootnotemark: | |||||
| 12 | HD 45677 | -1.93 | 0.85 | 1430ddUV flux inferred from a template star with a matching spectral type from Valenti et al. (2003). | 1043ddUV flux inferred from a template star with a matching spectral type from Valenti et al. (2003). | 166ddUV flux inferred from a template star with a matching spectral type from Valenti et al. (2003). | 2.4ggFedele et al. 2011 | |||
| 13 | HD 85567 | -1.65 | 6.78 | 1430ddUV flux inferred from a template star with a matching spectral type from Valenti et al. (2003). | 1043ddUV flux inferred from a template star with a matching spectral type from Valenti et al. (2003). | 166ddUV flux inferred from a template star with a matching spectral type from Valenti et al. (2003). | 42.6 | 7.17 | 17.95.4ggFedele et al. 2011 | |
| 14 | Elias 3-1 | 0.85 | 0.29 | 8.3ddUV flux inferred from a template star with a matching spectral type from Valenti et al. (2003). | 5.1 | 2.6 | 7.47 | 1.52 | 0.2jjThis work | |
| 15 | HD 141569 | 2.51 | 10.7 | 8.3ddUV flux inferred from a template star with a matching spectral type from Valenti et al. (2003). | 5.1 | 2.6 | 0.38 | 0.03 | 0.090.01eeBrittain et al. 2007 | 0.02 jjThis work |
| 16 | HD 98922 | -2.03 | 4.96 | 764 | 394 | 318 | 73.8 | 1729ffvan der Plas et al. 2015 | 47ggFedele et al. 2011 | |
| 17 | HD 34282 | 2.93 | 1.74 | 1.2 | 0.45 | 0.75 | 12.8 | 2.1 | 3 | 0.8ggFedele et al. 2011 |
| 18 | HD 190073 | -1.43 | 6.72 | 35.6 | 15.8 | 25.8 | 5.47 | 3.65 | 62.32ffvan der Plas et al. 2015 | 6.50.5jjThis work |
| 19 | UX Ori | 0.07 | 2.63 | 0.51 | 0.23 | 0.32 | 1.15 | 0.36 | 2.20.2 | 1.5ggFedele et al. 2011 |
| 20 | BF Ori | 1.02 | 4.5 | 0.6 | 0.14 | 0.57 | 1.48 | 0.56 | 1.4 | 0.6ggFedele et al. 2011 |
| 21 | CO Ori | 0.27 | 9.81 | 2.3 | 0.6 | 4.1 | 1.70.9 | 0.6ggFedele et al. 2011 |