Extremely Small Sizes for Faint -8 Galaxies in the Hubble Frontier Fields: A Key Input For Establishing their Volume Density and UV Emissivity
Abstract
We provide the first observational constraints on the sizes of the faintest galaxies lensed by the Hubble Frontier Fields (HFF) clusters. Ionizing radiation from faint galaxies likely drives cosmic reionization, and the HFF initiative provides a key opportunity to find such galaxies. Yet, we cannot assess their ionizing emissivity without a robust measurement of their sizes, since this is key to quantifying both their prevalence and the faint-end slope to the luminosity function. Here we provide the first size constraints with two new techniques. The first utilizes the fact that the detectability of highly-magnified galaxies as a function of shear is very dependent on a galaxy’s size. Only the most compact galaxies remain detectable in high-shear regions (vs. a larger detectable size range for low shear), a phenomenon we quantify using simulations. Remarkably, however, no correlation is found between the surface density of faint galaxies and the predicted shear, using 87 high-magnification (-100) -8 galaxies seen behind the first four HFF clusters. This can only be the case if faint (15 mag) galaxies have significantly smaller sizes than more luminous galaxies, i.e., 30 mas or 160-240 pc. As a second size probe, we rotate and stack 26 faint high-magnification sources along the major shear axis. Less elongation is found than even for objects with an intrinsic half-light radius of 10 mas. Together these results indicate that extremely faint -8 galaxies have near point-source profiles (half-light radii 30 mas and perhaps 5-10 mas). These results suggest smaller completeness corrections and hence shallower faint-end slopes for the -8 LFs than derived in some recent studies (by -0.3).
1. Introduction
Over the last few years, there has been increasing interest in the study of faint galaxies in the high-redshift universe, both for guiding current thinking about the reionization of the universe (Kuhlen & Faucher-Giguére 2012; Robertson et al. 2013; Choudhury et al. 2015) and also for the interpretation of dwarf galaxies much more locally (e.g., Graus et al. 2016). The importance of faint galaxies to cosmic reionization follows from the strong observational evidence that the faint-end slope of the LF is as steep as at (e.g., Yan & Windhorst 2004; Bouwens et al. 2007, 2011, 2015; Oesch et al. 2012; Bradley et al. 2012; Calvi et al. 2013; Schenker et al. 2013; McLure et al. 2013; Schmidt et al. 2014; Finkelstein et al. 2015; Atek et al. 2014, 2015a, 2015b; Castellano et al. 2016b), implying that the vast majority of high-energy photons originate from the extremely faint galaxies.
Substantial progress has been made in pushing fainter in searches for faint galaxies in the early universe. Traditionally, our deepest probes have been provided by the long exposures obtained over the Hubble Ultra Deep Field (HUDF: Beckwith et al. 2006). Searches over this field first probed to mag (Bouwens et al. 2011; Oesch et al. 2012; Bradley et al. 2012) at -8 and later to (Schenker et al. 2013; McLure et al. 2013; Bouwens et al. 2015), in the HUDF/XDF/HUDF12 (Illingworth et al. 2013; Koekemoer et al. 2013). Bouwens et al. (2015) probe to mag at , and Parsa et al. (2016) take advantage of the smaller luminosity distances at -3 to reach 14 mag.
Over the last few years, however, the effort to identify extremely faint galaxies has been given a major boost, due to the new 840-orbit Hubble Frontier Fields (HFF) program (Coe et al. 2015; Lotz et al. 2017). This program probes faint galaxies by combining the power of flux amplification by gravitational lensing from massive galaxy clusters with long exposures by the Hubble Space Telescope and other telescopes. Many researchers have exploited new observations from this program to study faint galaxies. Atek et al. (2014, 2015) were the first to make use of observations from this program and some of their first results probed as faint as mag. New searches by Kawamata et al. (2016), Castellano et al. (2016a,b), and Livermore et al. (2017) now report the identification of -6 galaxies as faint as mag.
The HFF observations therefore have great potential for mapping out the faint-end of the luminosity function (LF). Nevertheless, there are a number of issues that make such LF derivations more challenging than LF determinations using traditional deep field observations like the HUDF. Among these issues are (1) the gravitational lens model utilized to determine the luminosity of faint sources, (2) the size distribution of faint sources needed to estimate the selection volumes, and (3) possible contamination from foreground sources in the cluster. Each issue has a host of uncertainties associated with it, and if not treated correctly, each can result in sizeable systematic errors.
| Cluster | 2 | 3 | 5 | 6 | 7 | 8 |
|---|---|---|---|---|---|---|
| Abell 2744 | 2 | 10 | 8 | 1 | 1 | 2 |
| MACS0416 | – | – | 6 | 7 | 1 | 0 |
| MACS0717 | 15 | 10 | 10 | 2 | 3 | 2 |
| MACS1149 | 2 | 2 | 2 | 1 | 0 | 0 |
| Total | 19 | 22 | 26 | 11 | 5 | 4 |
Here we focus on the issue of source size for extremely faint galaxies seen behind the HFF clusters. Source size is known to have a very large impact on the estimated selection efficiencies near the detection limits and hence inferred volume densities. Grazian et al. (2011) highlighted source size as having a substantial impact on the faint-end slope inferred for the LF, arguing that the faint-end slope derived can be significantly dependent on assumptions made regarding source size. This issue is important even for nominally small sources (i.e., 0.5 kpc) in cases where lensing magnification becomes significant. This is due to the substantial stretching sources experience as a result of gravitational lensing. This can make magnified sources difficult to detect, even, if from a consideration of their flux, detection should be straightforward. This issue is particularly problematic if lensing acts to stretch their light predominantly along a single axis (see Oesch et al. 2015).
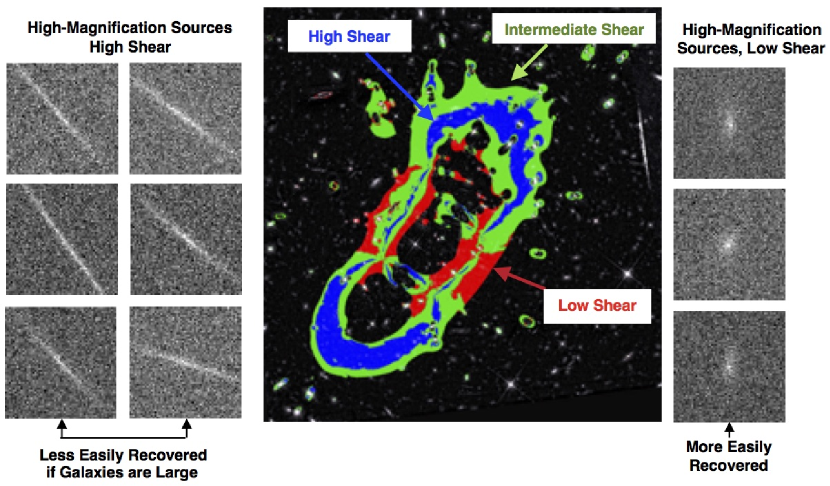
The purpose of this manuscript is to demonstrate the application of several new techniques to constrain the size distribution of faint galaxies identified behind lensing clusters. The first technique keys on the expectation that the search efficiency behind lensing clusters should be highest in regions where sources are magnified with minimal shear and lowest in regions where the lensing shear is high. Given that we would expect there to be the largest differences between these regimes in cases where galaxy sizes are large and essentially no difference in cases of a point-source profile, this strategy provides us with a valuable way of estimating source size for faint galaxies. With our second technique, we obtain our size constraints by looking at highly magnified sources stretched by 10 along a single axis and then comparing their profiles with expectations based on current lensing models.
The plan for this paper is as follows. We begin the paper by introducing the data sets and samples we will be using to look at the issue of source size (§2). We then move on to illustrate the impact that the assumed source size can have on the inferred UV LF (§3). In §4, we use simulations to investigate how the completeness of high-magnification, faint galaxies should depend on lensing shear for a variety of different assumptions about source size and then look for similar dependencies in the observations. In §5, we obtain a constraint on source size by looking at a selection of faint sources expected to be stretched by a factor of 10 along a single axis and then comparing their spatial profiles with those expected from the lensing models. In §5, we also direct size measurements from a sample of faint sources behind Abell 2744 and MACS0416. Finally, in §6 and §7, we discuss and summarize the results. Throughout the paper, we assume a standard “concordance” cosmology with km s-1 Mpc-1, and , which is in good agreement with recent cosmological constraints (Planck Collaboration et al. 2015). Magnitudes are in the AB system (Oke & Gunn 1983).
2. Data Sets and -8 Samples
We base the present study on the v1.0 reductions of the HST observations over the first four HFF clusters Abell 2744, MACS0416, MACS0717, and MACS1149 (Koekemoer et al. 2017, in prep). These data include at least 18, 10, 42, 34, 12, 10, and 24 orbits of F435W, F606W, F814W, F105W, F125W, F140W, and F160W observations, respectively, typically probing to 28.8-29.1 mag at for point sources (Lotz et al. 2017). The FWHM of the PSF in the F105W, F125W, F140W, and F160W WFC3/IR observations is typically -0.17”.
We also make use of our own reduction of the HST WFC3/UVIS F275W and F336W observations available over Abell 2744, MACS0717, and MACS1149. These observations include 8 orbits of data in the F275W and F336W bands and reach to a depth of 27.4-28.2 mag (Alavi et al. 2016). These observations help us to construct samples of very faint galaxies at and which we will also use to study galaxy sizes.
We consider a conservative yet comprehensive selection of -8 galaxies identified over the first four HFF clusters. Foreground light from the cluster and the 40 brightest galaxies have been removed from the real data before combination with the simulated data. Our procedure for removing the foreground light relies both on galfit (Peng et al. 2002) and the median filtering approach from SExtractor (Bertin & Arnouts 1996) applied at two grid scales; our procedure shares many similarities with the approach taken by Merlin et al. (2016: see Bouwens et al. 2017, in prep). galfit is a well-known two dimensional profile fitting code that produces robust size measurements from imaging observations, given an input PSF.

Our -8 galaxy candidates were selected by a combination of the Lyman Break and photometric-redshift selection criteria. We will describe those selection criteria and the -8 samples we construct in detail in Bouwens et al. (2017, in prep), but the criteria we utilize are almost identical to those utilized in Bouwens et al. (2015) for our -8 samples and involve photometric-redshift selection criteria at -3. Selected sources are required to be detected at 6.5 adding in quadrature the S/N of each source in the , , , and bands to guarantee a clean selection of sources. No selection of galaxies is considered due to potentially significant contamination of such samples by sources at the redshift of the cluster with 4000Å/Balmer breaks falling between the and bands.
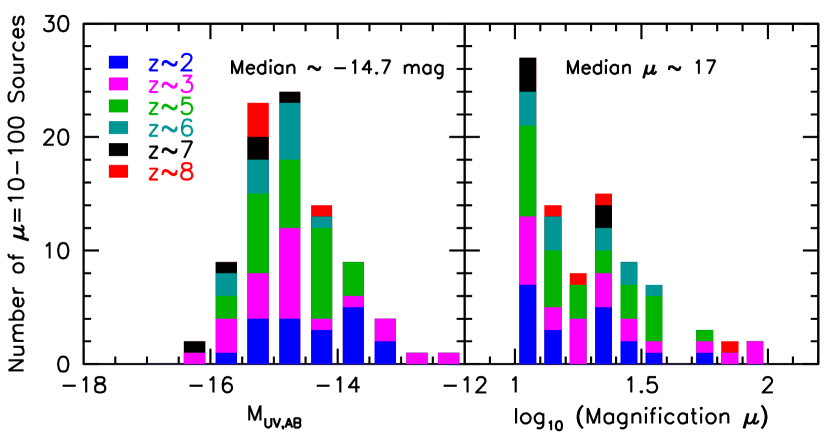
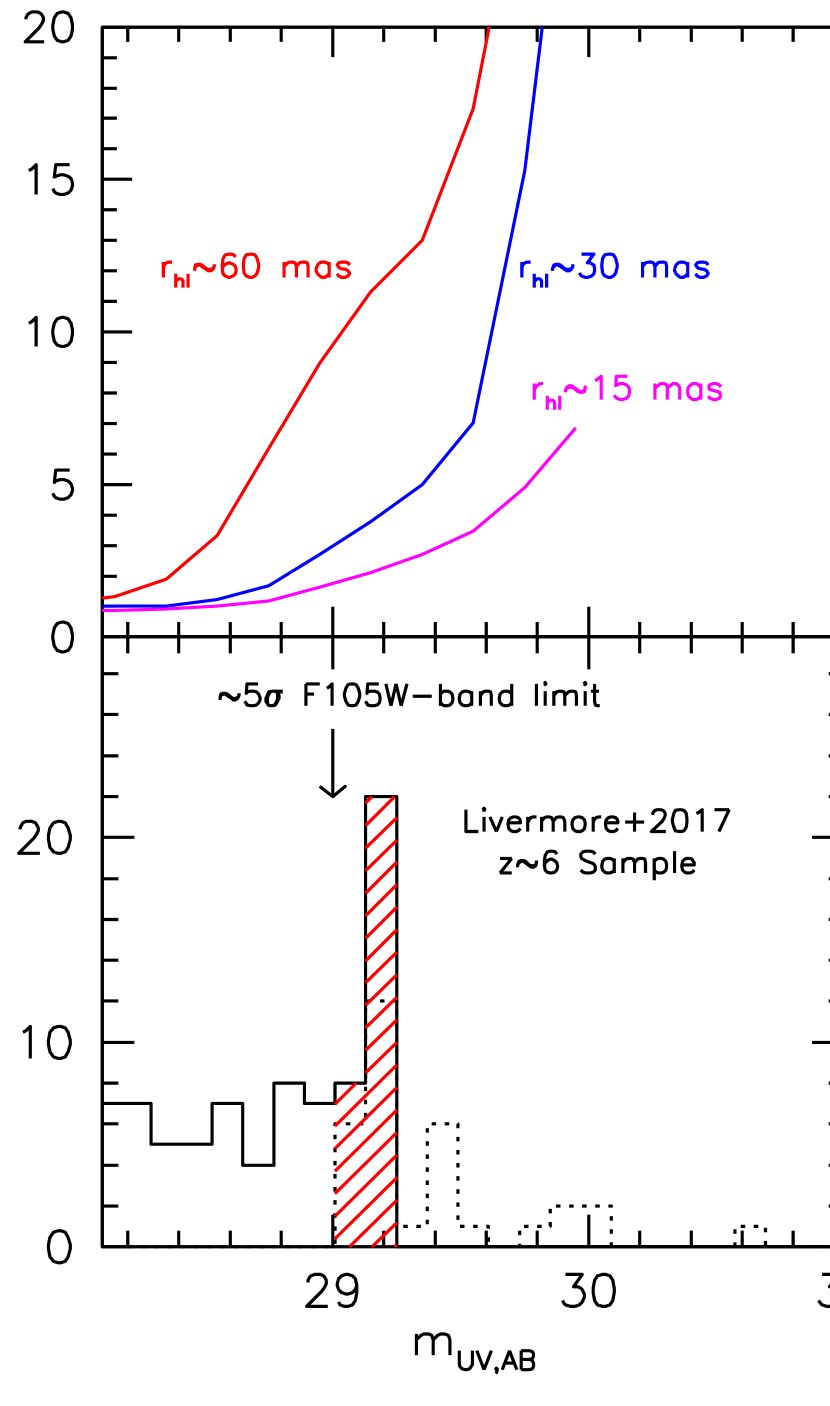
In total, 559 , 562 , 309 , 160 , 92 , and 50 galaxies were selected. 5% of these candidates are estimated to have magnification factors 10, using the median of the four public magnification models to the HFF program based on parametric NFW mass profiles, i.e., CATS (Jullo & Kneib 2009; Richard et al. 2014; Jauzac et al. 2015a,b), Sharon (Johnson et al. 2014), GLAFIC (Oguri 2010; Ishigaki et al. 2015; Kawamata et al. 2016), and Zitrin-NFW (Zitrin et al. 2013, 2015). These models performed the best in the HFF comparison project (Meneghetti et al. 2016). The number of high-magnification sources per cluster and in different bins in magnitude and magnification factor are provided Table 1 and Figure 1.
3. Importance of Source Size For Constraints on the Faint End of the LFs at
It is useful first to provide some perspective on the importance of the assumed size distribution for determinations of the rest-frame LF. We illustrate the impact at just one redshift , due to the importance of this redshift for current thinking about cosmic reionization and the fact that HFF observations are the most sensitive in those passbands which straddle the Lyman break.
To demonstrate the effect of source size, we consider three different size assumptions for faint galaxies behind the HFF clusters. These are chosen to differ in size by a factor 4 at each step, starting with a typical size for brighter galaxies (around in brightness) of (1) 0.12′′ (120 mas), and then taking (2) 30 mas and (3) 7.5 mas. More specifically the actual size distributions assumed are as follows: (1) log-normal with median half-light radii of 120 mas (unlensed) and 1 scatter of 0.3 dex, (2) log-normal with median half-light radii of 30 mas (unlensed) and 1 scatter of 0.3 dex, and (3) a delta function with a peak at a half-light radius of 7.5 mas.
The LFs we derive for this exercise take advantage of selection volumes we have estimated based on sophisticated image construction and recovery simulations. These simulations involve first creating a mock catalog of sources, simulating the appearance of these galaxies in the source plane, mapping these sources to the image plane using one current state-of-the-art lensing model (which we take to be CATS: Jauzac et al. 2015), convolving with the relevant point spread function, adding the mock image plane observations to the real data, and then running the present detection and source selection algorithms on the mock data in the same way as it was run on the real observations.
In simulating the appearance of sources at all wavelengths, we assume that the mean -continuum slope of galaxies matched the constraints available in Bouwens et al. (2014), where the ’s are redder for the more luminous galaxies and bluer for the fainter sources. The Bouwens et al. (2014) constraints are broadly representative of those found in numerous studies (Wilkins et al. 2011; Bouwens et al. 2012; Finkelstein et al. 2012; Dunlop et al. 2013; Alavi et al. 2014; Rogers et al. 2014; Duncan et al. 2014). Sources are assumed to all have exponential profiles, which is a rough match to the average profile of many galaxies (Hathi et al. 2008; Shibuya et al. 2015).
Then, combining these selection efficiencies with a large sample of galaxies presented in Bouwens et al. (2017: see Table 2), we derive different estimates of the LF at . Figure 2 presents these estimates of the LFs, as well as the faint-end slopes . We derive separate LF fit results alternatively using the brighter ( mag) and fainter ( mag) individual points in the LF. Estimates of the luminosity density brightward of mag for the derived LF are shown for the different fit results. For simplicity, the normalization and are kept fixed to the values derived in multi-field LF probe by Bouwens et al. (2015), i.e., Mpc-3 and . Only sources brighter than 29 mag were included in our LF derivations. Our procedure for estimating the LF is described in more detail in Bouwens et al. (2017), but remains similar to the procedures used in our previous extensive analyses (e.g. Bouwens et al. 2015).
It is clear from Figure 2 that the assumed source sizes can have a huge impact on the LFs, faint-end slopes , and inferred luminosity densities we derive, even when the differences are as small as 7.5 mas vs. 30 mas. This motivates our attempts to accurately measure the size distribution of extremely faint galaxies.
4. Galaxy Sizes from Dependencies on the Lensing Shear
4.1. Formalism and Description of Technique
We begin this section by introducing the lensing terminology we will utilize to constrain the size distribution of highly-magnified, very faint galaxies behind lensing clusters.
It is traditional in looking at the impact of gravitational lensing from various mass distributions on light in the unlensed “source” plane to write the transformation to the lensed “image” plane in terms in a linearized form using the Jacobian where and expresses the unlensed angular and observed angular positions, respectively.
This transformation is frequently written in terms of the following matrix:
where is the convergence while and are the components of the shear. One can choose the and axes such that distortion transformation is diagonal:
is equal to the surface density of matter divided by the critical surface density which is equal to where is the speed of light, is Newton’s constant, , , are angular diameter distances from the observer to the source, from the observer to the lens, and from the lens to the source, respectively. Meanwhile, is the shear.
A circular source of size in the source plane would have a projected size of
along its major axis and
along its minor axis. The resultant axis ratio of a circular source would be as follows:
We define a new quantity , which we call the “shear factor,” and take to equal the above expression in cases where it is greater or equal to one and where it is reciprocal of the above expresson in cases where it is less than one, i.e.,
| (1) |
For values of 1, sources would retain a circular shape, whereas for values of 10, the axial ratio of lensed sources would be 10 (before accounting for the impact of the PSF). The quantity expresses the shearing or spatial distortion of sources in the lensing field. Meanwhile, source magnification is simply equal to the product of source stretch along the major and minor axes, i.e.,
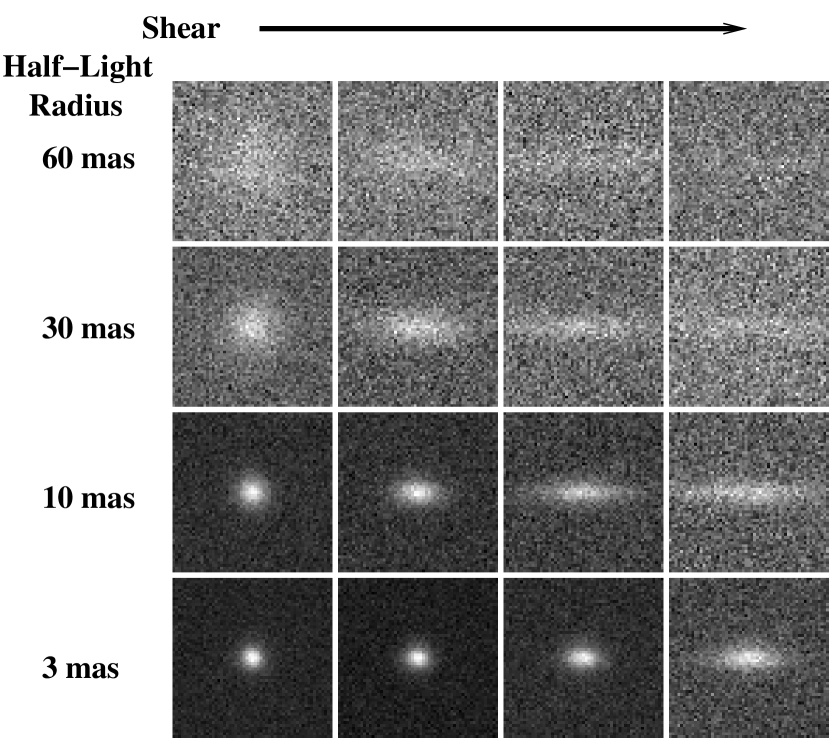
Given current detection algorithms, we would expect a higher completeness in regions of low shear compared to high shear regions for a given apparent magnitude and magnification factor of sources, particularly if the intrinsic sizes of high-redshift sources is modest, i.e., 100 mas. Sources elongated by similar factors along the two spatial directions are easier to detect than sources elongated predominantly along just one of the two spatial dimensions. This is illustrated in Figure 4 using sources with various intrinsic sizes and subject to varying amounts of shear. A first discussion of the impact of this effect for finding faint sources was provided by Oesch et al. (2015).
We would expect the strength of the dependence of surface density on shear to vary in proportion to source size. In fact, if we model faint galaxies as point sources, the surface density of galaxies we recover on the sky is entirely independent of the predicted shear and is only a function of the magnification factor. An illustration of the reduced impact shear would have for smaller sources is evident in Figure 4 for the 3 mas case (which, even though small, still clearly shows the reduction in detectability from shear). This illustration motivates the systematic measurement of this dependence from the data as a means of constraining the intrinsic sizes of very faint high-redshift galaxies.
4.2. Recovered Surface Density vs. Shear: Simulations
Having described the basic principles that will be used in this section and having illustrated the basic effect, we now use simulations to quantify the expected dependence of completeness on the predicted shear for sources of various sizes. We focus on the selection of galaxies in the magnitude interval and then discuss the extent that we might expect this selection of faint galaxies to be representative of the selections at other redshifts.
We accomplish this by running extensive source recovery simulations on all 4 HFF clusters that we utilized to perform this basic test. Briefly, we (i) populate the source plane with galaxies at some fixed intrinsic magnitude, (ii) apply the deflection map from one recent state-of-the-art lensing model (which we take to be the CATS models: Jauzac et al. 2015), (iii) add the sources to the HFF data (after the foreground cluster and brightest 50 cluster galaxy light has been removed: see Bouwens et al. 2017, in prep), and (iv) then attempt to identify galaxies using exactly the same procedure as was used to originally select our high-redshift samples. We repeat this simulation hundreds of times systematically including as inputs a different apparent magnitude for galaxies at random positions in the source plane.
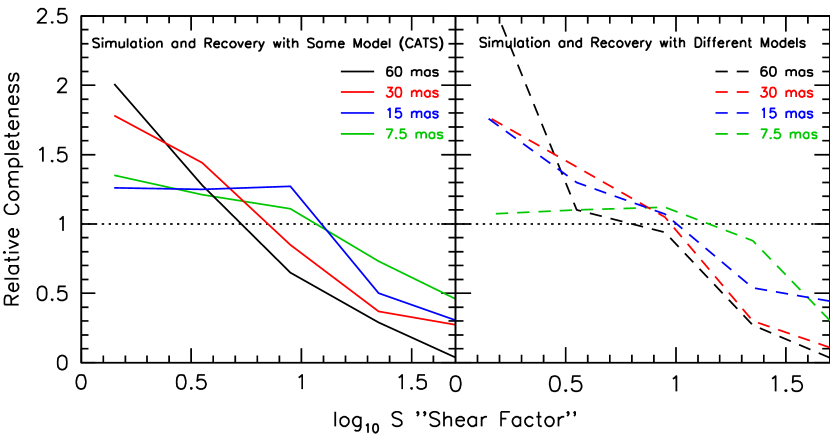
We present the results for Figure 5 alternatively assuming a fixed half-light radius of 60 mas, 30 mas, 15 mas, and 7.5 mas for distant galaxies (each of these radii differing at the power of 2 level). An intrinsic axial ratio of 1 is adopted for sources in the simulations (i.e., all sources have an intrinsically circular two dimensional profile).111This represents the typical case for sources, as the inclusion of non-circular sources in the simuations would either increase or decrease the completeness for an individiual source depending on whether the major axis is perpendicular or parallel, respectively, with the major shear axis. We only include sources where the actual magnification is 10 and where the uncertainties on the magnification is less than 0.3 dex (as determined by comparing the 1st quartile value with the median). The shear factors we utilize are derived from the CATS model.
As expected, we can see that our simulations find that sources inserted into regions with low shear factors show a significantly higher completeness than sources inserted into regions where the shear is higher. For our models where the source sizes are smaller, the dependence of the completeness on the shear factor is less sharp. Nevertheless, we do still observe a modest dependence, even for sources with intrinsic half-light radii of 15 mas and 7.5 mas.
Finally, we should account for the impact that uncertainties in the magnification and shear maps have on the predicted dependencies plotted in the left panel of Figure 5. To accomplish this, we repeat our quantification of our selections as a function of the shear factor but this time using the median magnification and shear maps created from the seven different high-resolution lensing models available for the first four HFF clusters. The 7 lensing models we consider are the following: CATS (Jullo & Kneib 2009; Richard et al. 2014; Jauzac et al. 2015a,b), Sharon (Johnson et al. 2014), GLAFIC (Oguri 2010; Ishigaki et al. 2015; Kawamata et al. 2016), Zitrin-NFW (Zitrin et al. 2013, 2015), Grale (Liesenborgs et al. 2006; Sebesta et al. 2016), Bradac (2009), and Zitrin-LTM (Zitrin et al. 2012, 2015).
The result is shown in the right panel of Figure 5 and contrasted with the dependencies that only rely on the actual magnification and shear maps. Not surprisingly, uncertainties in the magnification models result in a slight flattening to the predicted completeness vs. shear relation.
4.3. Recovered Surface Density vs. Shear: Observations
Having presented the expectations from our simulations, we now compare the results with the observations. To derive this from the observations, we compute a shear factor for every faint source in our -8 samples and source in our -3 samples whose estimated magnification is 10. Our magnification estimate is taken to be median of the magnification estimates from the four parametric NFW models, given the photometric redshift derived for the source. The shear factor is computed in a similar way to the magnification factor, using the median of the seven magnification models presented at the end of §4.2.
We then bin sources by shear factor and then normalize these totals by the expected number of sources in each shear-factor bin. To derive the expected numbers, we use the fact that the surface density of sources in a given magnification bin scales as where is the limiting luminosity probed for galaxies at 28.5 mag without the benefit of gravitational lensing. The faint-end slope is taken to have a value of , , , , , and at , , , , , and samples, consistent with best-fit trend derived by Parsa et al. (2016). We compute the expected number of sources in each bin by integrating over the total area in the image plane where sources would fall in a given “shear factor” bin (and where the estimated magnification would be 10) and weighting by the expected surface densities, i.e., . We then renormalize the relative completeness so that the average value is equal to 1. The results should be directly comparable to the relative completeness that we just presented in Figure 5.
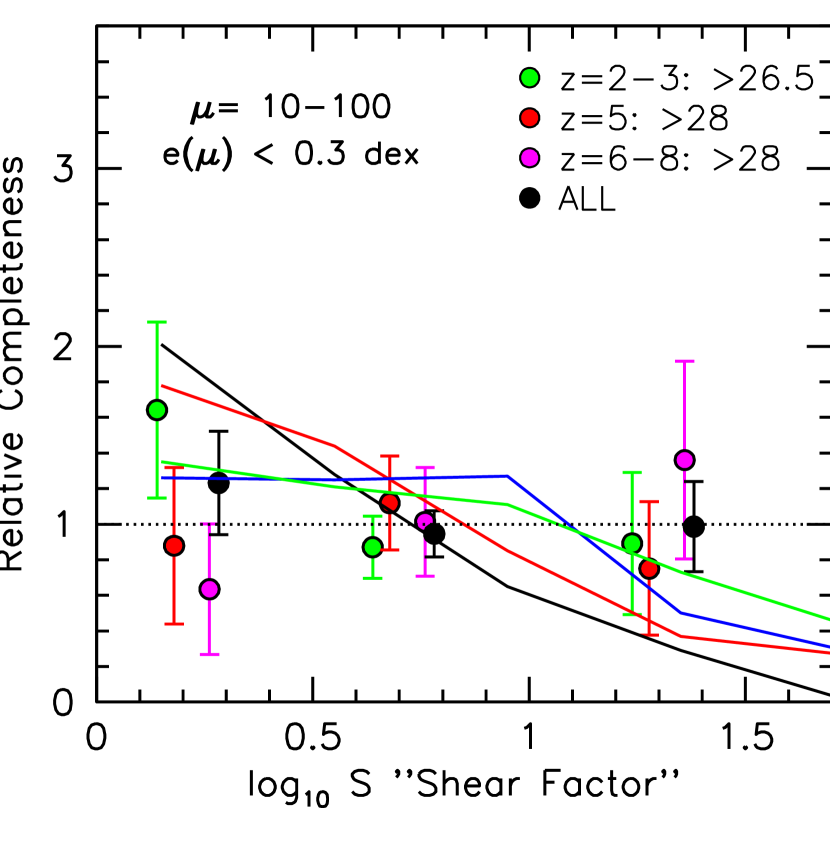
Figure 6 presents the relative surface densities we find for galaxies as a function of shear factor for different groupings of faint sources in redshift, i.e., -3, , -8. Also included in this same figure are the relative surface density results combining all of these galaxy samples.
Remarkably, we see no clear dependence of the surface density of faint -8 galaxies – or equivalently the relative completeness – on the shear factor, in contrast to the simulation results presented in Figure 5. While the statistics are still modest, one explanation for this result is that if the highly-magnified sources that we have identified are smaller than expected. The implications of this are developed further below where we establish formally the source sizes that would be consistent with what is shown in Figure 6.
Comparing the surface densities of faint galaxies observed in each shear bin with that predicted making different assumptions about source size, we find that the results are best matched to the predictions assuming intrinsic half-light radii of 0, with results assuming an intrinsic radius of 30 mas and 60 mas being disfavored at 87% and 99% confidence. This assumes that all sources in our -8 samples are of identical size.
In deriving confidence intervals on the sizes of faint sources, we adopt a flat, uniform prior (0 to 120 mas). We evaluate the likelihood of recovering the measured shear factor distribution given different assumptions about the true sizes. We estimate the likelihood of different source sizes for faint galaxies by creating several thousand mock realizations of the shear factor distribution for our faint -8 catalogs (with 87 sources each) for individual size assumptions. We then ask for which fraction of the realizations we recover the same number of sources per shear factor bin as in the observations to determine the likelihood of a given size model. We frame this comparison using the same bins as are plotted in Figure 6. We then sum the total posterior probability above some assumed source size to determine the confidence level on the true source size being smaller that value.
A more realistic model to examine is one where galaxies possess a range in sizes, e.g., as with a log-normal distribution where a scatter of 0.3 dex is assumed (e.g., as in van der Wel et al. 2014; Shibuya et al. 2015). In this scenario, most of the selected sources in the high-magnification regions are from the small end of the intrinsic distribution, causing the examined ultra-faint galaxy population to behave as if it is smaller than it actually is. If we repeat the above exercise, the observations are again best matched assuming an intrinsic half-light radius of 0, but where median half-light radii up to 30 mas and 60 mas are disfavored at 74% and 99% confidence, respectively, which is quite a bit larger than if the size distribution is a delta function.
One could also consider the scenario that many galaxies are near point sources, but the remainder have much larger sizes. We take the intrinsic half-light radii of the smaller mode to be 7.5 mas and the larger mode to be 60 mas. We find that up to 36% of current samples could be composed of sources with intrinsic half-light radii 60 mas (assuming a flat prior on the allowed fraction) and still be consistent with the observed numbers vs. shear factor at 95% confidence. Given the greater incompleteness of sources with half-light radii of 60 mas, we estimate that such sources could compose 79% of the input samples based on this statistic alone. For such a population, this would translate into an incompleteness that is 3.1 higher than our just assuming near point sources for the entire ultra-faint population. This exercise shows the vulnerability of this test to our assumption that the intrinsic size distribution is unimodal. If the size distribution is bimodal, with the fainter mode essentially 100% incomplete in our searches, it would have little impact on our samples or tests we are running. We keep this caveat in mind when deriving constraints on the LF (Bouwens et al. 2017).
We should consider the possibility that some sources in our sample could be lower-redshift contaminating sources. Since we would expect such contaminating sources to be impacted by gravitational lensing in a very different way than if they were at the assumed redshifts, we can reasonably expect their surface densities to be significantly less dependent on the model magnification factors (or shear factors) for most of the sources in our selection. Given this, we would expect contaminants to show approximately the same surface density in all shear bins. We can estimate the impact of contaminants if we assume that the non-contaminating sources show the same distribution as a function of shear factor as in Figure 5 and also assume that the contaminating sources are identically 1 in all shear factor bins. If we allow for contamination levels of 10%, which is typical for faint Lyman-break galaxy samples (e.g., Bouwens et al. 2015; Vulcani et al. 2017) and repeat our earlier estimates assuming identical sizes for all sources, we can find that we can then exclude the possibility that the half-light radii is 30 mas at 82% confidence (vs. 87% confidence in the case of no contamination). The likely impact of contamination on our conclusions is therefore only modest.
On the basis of these tests, it is likely that the typical intrinsic half-light radii of the ultra-faint ( mag) galaxies probed with the HFF program is 30 mas (86% confidence) assuming sources of the same size and 60 mas assuming a log-normal size distribution (95% confidence). This angular size constraint corresponds to intrinsic half-light radii of 165 parsec and 330 parsec, respectively, at .
Given our application of this test to galaxies with the absolute magnitude distribution presented in Figure 1, one would generally expect our size constraints to apply sources in this luminosity range, i.e., at mag. However, if the model magnification factors were in excess of the true magnification factors, e.g., as one might expect if errors in the magnification models were predominately only scattering low magnification sources to high magnifications, we would underestimate the actual luminosities. One-sided scatter to high magnification factors could occur at magnification factors where the lensing models begin to lose their predictive power, i.e., (Bouwens et al. 2017). If we take that factor to be 20, that would suggest a possible underestimate of the luminosity by 0.4 mag, which would make the median absolute magnitude of our sample mag.
We briefly present the current test in the context of our -3 samples in §5.2.
5. Direct Size Measurements on Individual / Stacked Sources
Results from the previous section provided us with strong evidence that the half-light radii of extremely faint ( mag) -8 galaxies is 30 mas for sources of identical size and 60 mas if we consider galaxies to show a range of sizes. 30 mas and 60 mas correspond to 165 pc and 330 pc, respectively, at .
The purpose of the present section is to try to confirm these constraints through direct measurements of the source sizes for faint galaxies. Despite the clear value of such measurements, it is important to remember that we can only obtain them for selected sources. It is possible that more extended sources could exist but fail to be selected. This is why the shear-based technique from the previous section is useful, since it provides us with a method to infer the size distribution even in the presence of incompleteness.
We focus our attention on those sources which are expected to stretched by a factor of 10 along one axis, so that we can probe the sizes of faint galaxies to a resolution of 10 mas. In determining which sources we might expect to exhibit such spatial elongation, we expressly make use of the median lensing maps, since we will make use of the latest deflection maps from the CATS team in modeling the spatial structure of sources. By using different lensing maps for the selection and measurement steps, we ensure that the present results are more robust against uncertainties in the lensing maps.
As in §4, we examine sources in the faintest magnitude bin, since this provides us with the most leverage in probing the faintest galaxies observed in the HFFs. We restrict our attention to results over the first two HFF clusters given the greater maturity of the available magnification models.
We focus first on extremely faint galaxies in the general redshift range -8 and then move onto faint galaxies in the redshift range -3.
5.1. -8 Samples
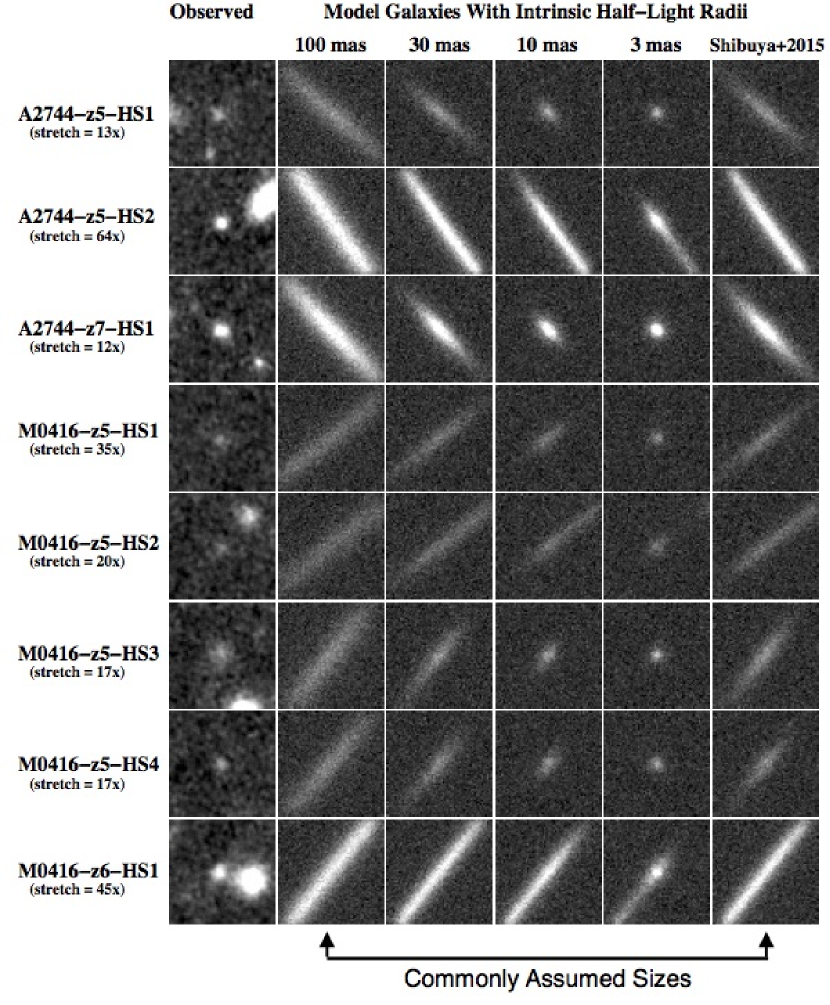
We consider first faint galaixes in the redshift range -8. We find 26 such faint galaxies behind those two clusters that are stretched by more than a factor of 10 along a single axis and where the intrinsic apparent magnitude is 30.5 mag (corresponding to mag at ). This list of 26 sources includes 17 , 5 , 1 , and 3 galaxies from our sample. The median magnitude for these sources is 15 mag, very similar to the sample used in the previous section.
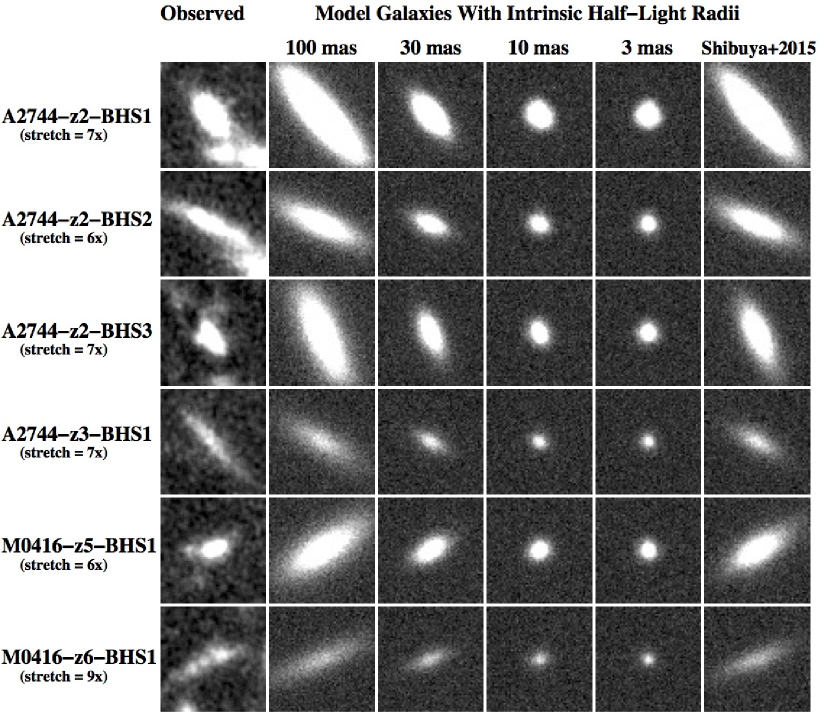
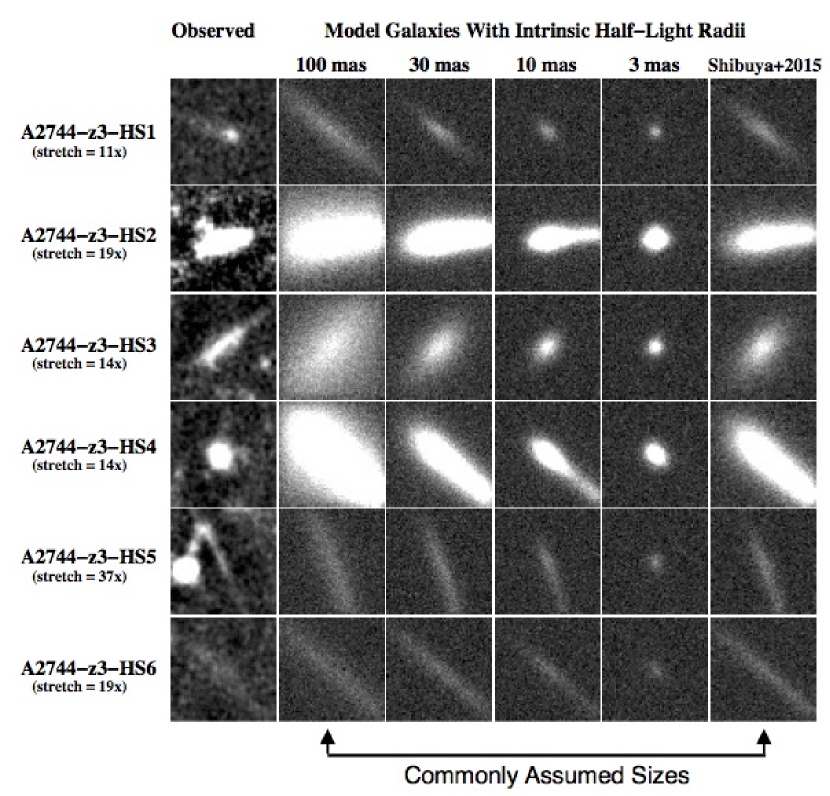
We present postage stamps of eight randomly-chosen sources from this list in Figure 7 and contrast their spatial profiles with that predicted for circular sources based on current lensing models. It is striking to see in Figure 7 that model sources show a remarkable degree of elongation along the shear axis compared to the observed sources. Amazingly, we find this to be the case, even assuming source sizes of mas. Similar to the results from the previous section, this suggests that faint galaxies are extremely small.222We remark that our use of sources with circular profiles (instead with non-unity axis ratios) does not fundamentally change this result. We would simply expect non-circular sources to appear larger or smaller depending on whether their major axis lie along the axis of maximum shear or not.
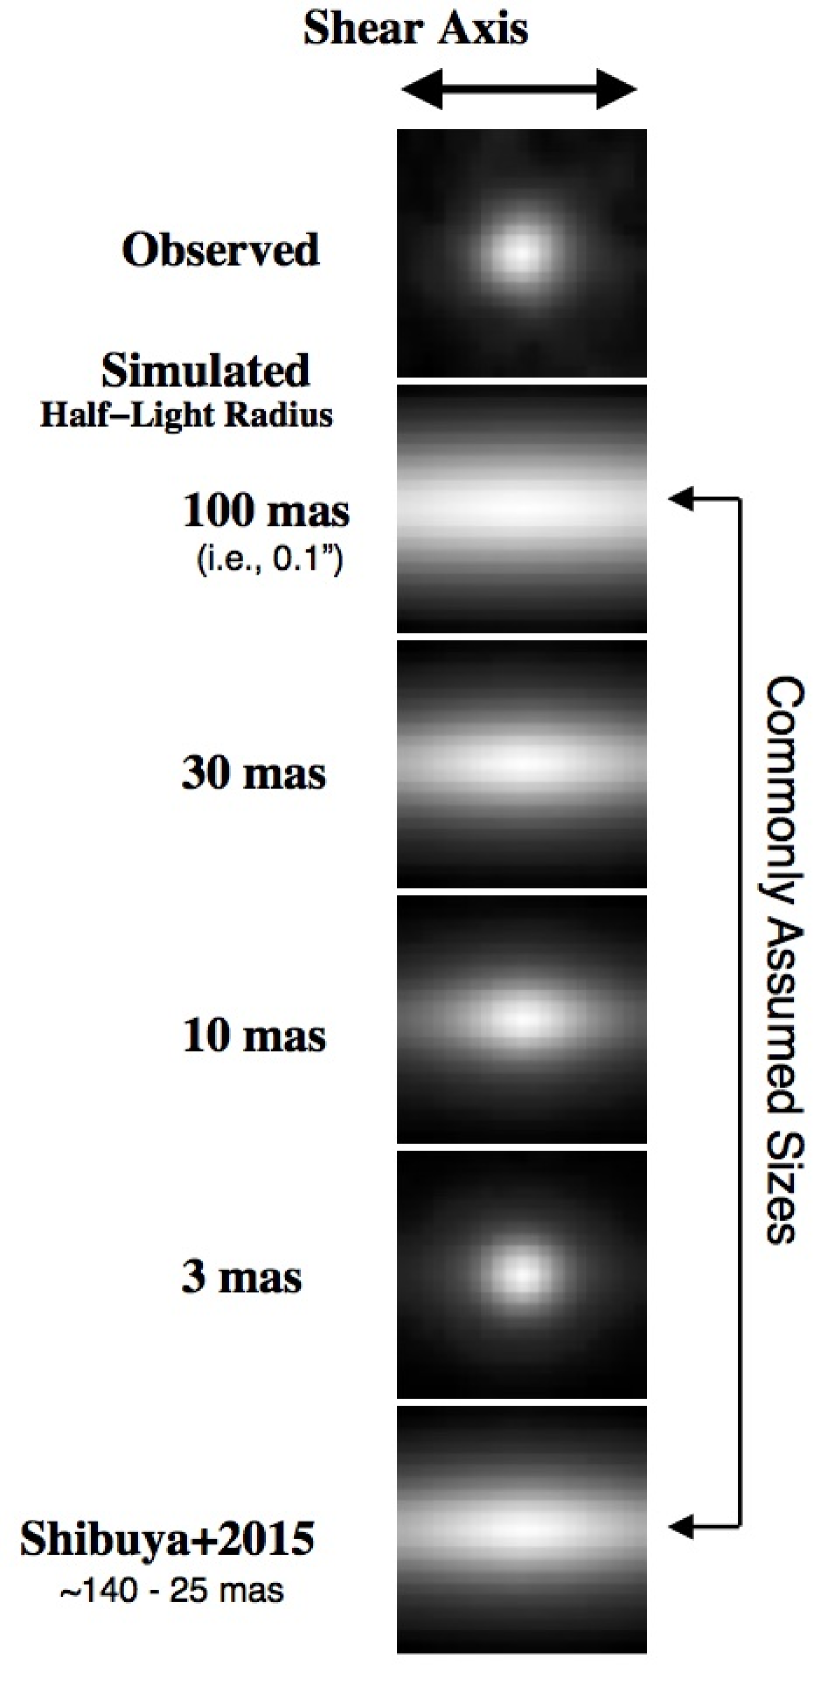
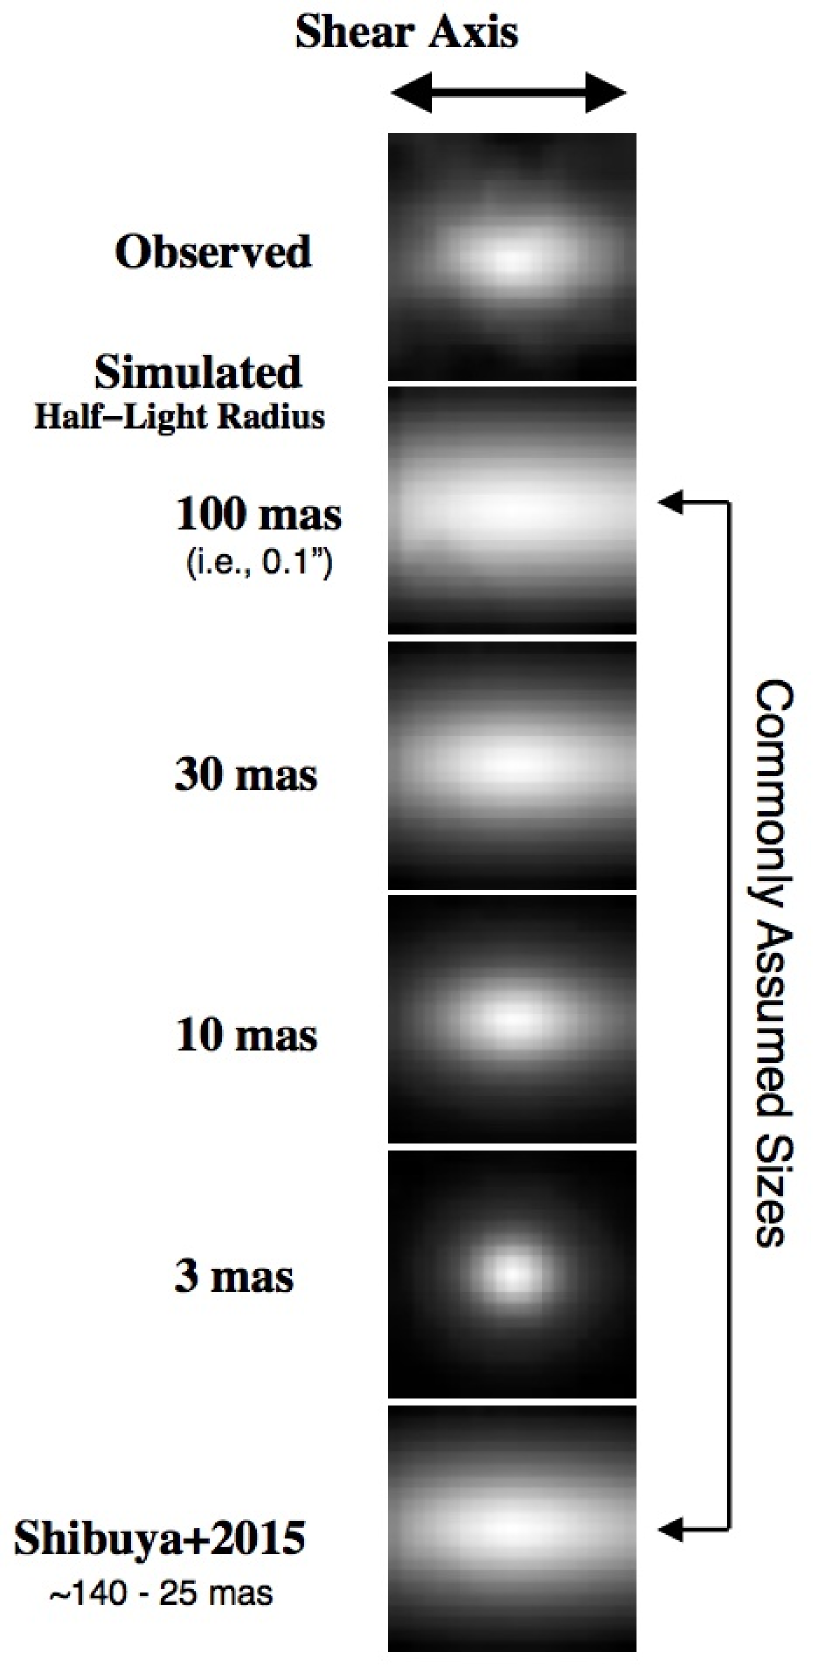
We can obtain a higher S/N look at the spatial profile of faint galaxies by taking the 26 sources from these samples, rotating the images of the sources so that they lie along the horizontal axis, and then combining the images to create a deep stack. We perform the same exercise on model images of the cluster where we create these images by applying a deflection map of sources behind a cluster to a bunch of model sources with fixed intrinsic size as well as adopting the Shibuya et al. (2015) half-light radius size scaling. The stack results are presented in Figure 8. Fitting the stack result with galfit, we measure a half-light radius of 641 mas along the predicted axis of maximum shear. After correction for the impact of lensing (the median estimated elongation along the shear axis is 17 for sources contributing to the stack), the measured size translates to an intrinsic half-light radius of 4 mas.
One potential concern about the probe of source size featured i n Figure 7-8 is the possibility that the featured sources are interpreted to be stretched by much larger factors along the major shear axis than in reality, due to errors in the lensing models. One can investigate the impact of such errors on analyses like that featured here, by looking at how well the median stretch factor predicts the stretch factor from one of the parametric models (CATS, GLAFIC, Zitrin-NFW, Sharon) in the median. In Bouwens et al. (2017, in prep), we show that the median map is predictive to factors of 10, with symmetric scatter about that value, but higher than that, the dominant scatter is in the direction from high to low values. This suggests that we may systematically overestimate the magnification along the major shear axis by a factor of 2 for the typical source and so constraints on the measured size may be closer to 8 mas, instead of 4 mas.
| ID | R.A. | Dec | aaMagnification factor adopted in this analysis. Median of the four parametric models. | bbShear factor adopted in this analysis. Median of the available models. | ccCircularized half-light radii in kpc. | |||
|---|---|---|---|---|---|---|---|---|
| A2744I-4242524441 | 00:14:24.257 | 30:24:44.11 | 28.03 | 16.23 | 6.10 | 9.20 | 6.90 | 0.1410.010 |
| A2744I-4231724324 | 00:14:23.172 | 30:24:32.44 | 27.19 | 17.74 | 5.62 | 4.98 | 3.25 | 0.2930.010 |
| A2744I-4226324225 | 00:14:22.639 | 30:24:22.51 | 28.09 | 17.06 | 5.62 | 4.04 | 1.92 | 0.0690.330 |
| A2744I-4223024479 | 00:14:22.306 | 30:24:47.98 | 27.48 | 16.67 | 5.96 | 10.18 | 6.21 | 0.0710.103 |
| A2744I-4197224471 | 00:14:19.728 | 30:24:47.10 | 28.29 | 17.33 | 5.96 | 2.64 | 2.03 | 0.2470.030 |
| A2744I-4219124454 | 00:14:21.910 | 30:24:45.46 | 29.24 | 15.02 | 6.10 | 9.17 | 6.19 | 0.0240.010 |
| A2744I-4169524527 | 00:14:16.956 | 30:24:52.79 | 26.10 | 20.05 | 6.10 | 1.62 | 1.48 | 0.1390.040 |
| A2744I-4169624404 | 00:14:16.960 | 30:24:40.40 | 28.08 | 17.90 | 5.62 | 1.89 | 1.61 | 0.4070.020 |
The intrinsic half-light radius inferred for faint sources is sufficiently small that it is useful to try a similar test on more luminous sources where the size distribution is more well established from various studies in the literature. We consider such a test in Appendix A looking at all sources in the magnitude range 27.0 to 29.4 mag, which are stretched by at least a factor of 6 along a single axis. The results of this are shown in Figure 15 of the Appendix A. In contrast to the results of this section, the observed sizes of the moderate luminosity sources are in reasonable agreement with the expected sizes using the Shibuya et al. (2015) relations as a guide.
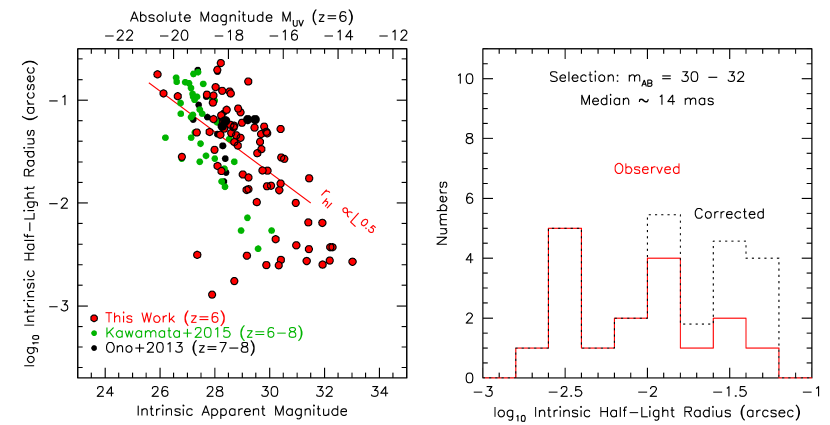
As a final check on these results, it is useful to consider direct size measurements with galfit on the full set of galaxies behind the same two HFF clusters just considered. For these fits, we take the Sersic index to equal 1, coadd the , , , and images together weighting by the inverse variance, and then fit the profiles, taking as the PSF a similar inverse variance weighting of the , , , and PSFs. We take the measured intrinsic half-light radius to be equal to the measured half-light radius, divided by magnification factor along the major shear axis, i.e, where is the shear factor. We treat sources as being circular for these corrections given that lack of correlation between the observed and predicted major axis for most sources. The results are shown in the left panel of Figure 9, also including the size measurements from Ono et al. (2013) using the HUDF09 and the HUDF12 data (Bouwens et al. 2011; Ellis et al. 2013; Koekemoer et al. 2013) and from Kawamata et al. (2015) using the HFF cluster and parallel data over Abell 2744. Typical uncertainties in the measured half-light radii is 20 mas, equivalent to 0.1 kpc (prior to incorporating the additional size leverage provided by the lensing magnification). Size measurements for the sources are provided in Table 2.
In the right panel of Figure 9, we present a histogram of the inferred sizes for sources inferred to have the faintest apparent magnitude in these fields. For sources with intrinsic half-light radii 10 mas, we also show a dotted histogram to indicate the expected number of sources we would find, if we had included a correction for the incompleteness of these sources. We can estimate the incompleteness using the same simulations described in §4. The median half-light radius that we infer for intrinsic faint 30-32 mag galaxies is 14 mas (80 pc at ).
We include on Figure 9 one possible size-luminosity relation, i.e., , that appears consistent with most of the brighter constraints from the current study as well as the literature. Despite the indicative fit, the exponent to the size-luminosity relation is fairly uncertain. One can derive a conservative lower limit to the uncertainty based on the estimated error in the median intrinsic half-light radius from the right panel. Based on that estimate and a luminosity baseline of 5.5 mag from (well constrained by bright samples: e.g., Shibuya et al. 2015) to 15.5 mag (our faint sample), we estimate an uncertainty of 0.07 in the exponent. However, we caution that the true error could be larger.333One potential point of concern is the fact that the exponent 0.5 we derive for the size-luminosity relation is the value one would expect, if surface brightness selection biases dominated the sample composition.
5.2. -3 Samples
Secondly, we focus on size measurement for extremely faint galaxies at -3. As in §5.1, we focus on those sources which are especially magnified, i.e., 10, along one of the two axes, and where the inferred intrinsic apparent magnitudes. There are six such magnified sources in our -3 samples, again only making use of those clusters with the most mature magnification models (MACS0416 and Abell 2744). As we only have -3 samples over Abell 2744, the six sources are drawn from data over that cluster.
Results for individual sources are presented in Figure 10. In contrast to results presented for our -8 samples, extremely faint -3 sources do show evidence for being moderately extended along the expected shear axis. An intrinsic half-light radius of 10 mas provides a reasonable representation of A2744-z3-HS1 and A2744-z3-HS2, while 30 mas provides a reasonable representation for A2744-z3-HS3, A2744-z3-HS5, and A2744-z3-HS6. A2744-z3-HS4 is most consistent with an intrinsic half-light radius of 3 mas.
Rotating sources such that their major shear axes are aligned and stacking, we compare the stacked image with that expected for different intrinsic size models in Figure 11. In contrast again to the results for our -8 sample, we find that the image stack shows extension along the expected shear axis. The stacked profile agrees best with the results assuming intrinsic half-light radii of 10 mas.
Results from this subsection again are consistent with very small sizes for faint galaxies in the redshift range -3, but are suggestive of somewhat larger sizes for sources than in the range -8. Sources in Figure 10 have inferred physical sizes ranging from 20 pc (3 mas) to 250 pc (30 mas), while the stack has an intrinsic half-light radius consistent with 80 pc (11 mas: Figure 11).
Considered by itself, the relative completeness results for the -3 sample presented in §4 also are suggestive of larger sizes for the -3 sample, given the higher values of the completeness at low shear factors and lower values at high shear factors. The observed trend presented in Figure 6 agrees best with the 15-mas model, but the numbers in the -3 sample are sufficiently low that we cannot rule out 34-mas and 60-mas sizes for faint -3 sources at 68% and 91% confidence, respectively.
6. Discussion
The results of the tests we have performed in the previous two sections strongly suggest that the faintest galaxies accessible from the HFF program are very small, with probable intrinsic half-light radii of 165 pc at and 240 pc at -3. Direct fits to the sizes of many individual sources result in much smaller sizes, i.e., from 3 mas to 14 mas. Table 3 provides a summary of the different tests we have performed to try to constrain the size distribution in faint -8 galaxies.
6.1. Comparison with Previous Results
Before interpreting the implications of the present results on the sizes of extremely faint galaxies over the HFF, it is useful to compare with previous work on the sizes of galaxies, as inferred from the HUDF, CANDELS, and the first HFF cluster and parallel field.
The most comprehensive recent work on the sizes of star-forming galaxies in the distant universe is by Shibuya et al. (2015), who looked at 180,000 individual sources found over the CANDELS fields, the first 2 HFF clusters and parallels, and the HUDF and systematically quantified the size distribution of galaxies as a function of redshift, luminosity, stellar mass, and also rest-frame color. Shibuya et al. (2015) found that the half-light radius of galaxies in the distant universe is approximately 1 kpc, with correlating with luminosity as , such that sources with absolute magnitudes of , , and mag would have sizes of 0.38 kpc, 0.23 kpc, and 0.14 kpc, respectively (assuming kpc at mag as indicated by their Figure 10).
The observed sizes of galaxies from other recent studies (e.g. Huang et al. 2013) are comparable to what was found by Shibuya et al. (2015). Ono et al. (2013) reported stacked sizes of 0.3 to 0.35 kpc for -8 galaxies found in the HUDF at 28.2 mag and 29.2 mag. The measured half-light radii of -8 sources from Kawamata et al. (2015) occupy a similar locus in the half-light radii vs. luminosity plane as found by Ono et al. (2013). In general these sizes are 3-4 larger than we find using the present constraints.
Intriguingly though, Kawamata et al. (2015) find a few lensed galaxies over the first HFF cluster field with inferred sizes very similar to what we find here, e.g., 30-50 pc. Given the presence of surface brightness selection effects against larger, lower surface brightness galaxies, Kawamata et al. (2015) could not know whether the small sizes they measured for galaxies in their faintest luminosity subsample, i.e., 30-100 pc, were representative or not. The present results suggest that such small sources are indeed ubiquitous in faint samples of -8 galaxies, with many sources in our samples having apparent sizes of 3-10 mas (17-55 pc at ). Moreover, indicative fits to the size - luminosity relation yield a steeper dependence on luminosity than derived by Shibuya et al. (2015) based on more luminous samples.
It is unclear why the sizes of extremely faint galaxies might differ so dramatically from what is found at the bright end of the UV LF. Interesting, these new results could be revealing that the lowest luminosity galaxies are really dominated at any time by one or two localized regions of star formation. These star forming regions are also striking in that they appear to be so compact, with many having apparent sizes consistent with just 20-50 pc. This is similar or smaller than the sizes (10-100 pc) of many giant molecular clouds (GMCs) and also most of the star-forming clumps seen in the local universe by SINGS (Kennicutt et al. 2003) or in lensed galaxies at -4 (Livermore et al. 2012, 2015).
| Description | Constraint |
|---|---|
| Completeness vs. Shear Factor (§4) | |
| Assuming Identical Sizes | 30 mas (87%) |
| 60 mas (99%) | |
| Log-Normal, Width=0.3dex | 30 mas (74%) |
| 60 mas (99%) | |
| Direct Fits (§5: galfit)aaThese size measures would include the selected sources, and hence could potentially miss larger, lower-surface brightness galaxies | |
| Individual Sizes (Figure 7) | 3 mas |
| Size of Stack (Figure 8) | 4 mas |
| Size Distribution (Figure 12) | 14 mas |
| (-32) | |
6.2. Impact on the Completeness of Faint Samples
The small source sizes for galaxies inferred here have significant implications on the derived completeness of faint galaxies, and thus on the derivation of the faint-end slope of the UV LFs. Assumptions made about the size distribution can have a dominant impact on the derived faint-end slope (see Figure 2).
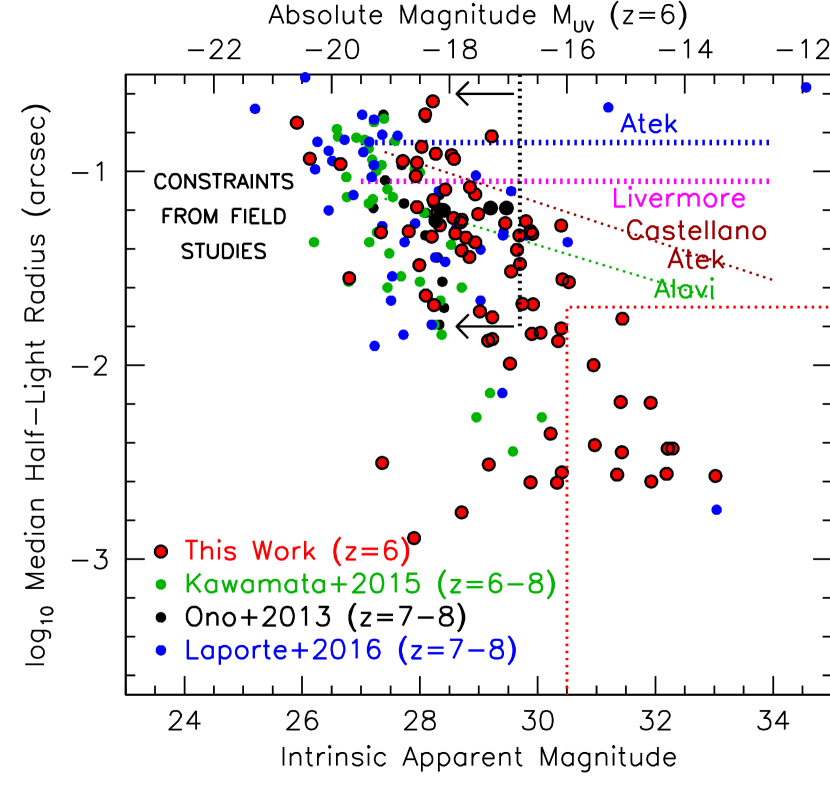
The present findings imply that faint -3 + -8 galaxies would be much easier to select than has assumed to be the case in many previous studies, where almost universally larger source sizes for extremely faint galaxies have been assumed. Source sizes from -130 mas (Castellano et al. 2016b) to 150 mas have been assumed (Atek et al. 2015). In Figure 12, we indicate the assumptions that have been utilized in different studies and contrast those assumptions with what we have found here and with the measured sizes of many sources in the literature (Ono et al. 2013; Kawamata et al. 2015; Laporte et al. 2016).
Inspecting the results of Alavi et al. (2016), we see that their estimated completeness is 80-90% and 30% at 28 and 29 mag, respectively, while for the Atek et al. (2015) studies the approximate completeness is 60% and 10%, respectively, from their Figure 5. The Castellano et al. (2016b) catalogs become significantly incomplete (50%) at 28.5 mag even adopting point source profiles. Livermore et al. (2017) do not provide a figure showing their estimates of completeness at 29 mag, but making similar assumptions about the intrinsic sizes of galaxies to what they report in their paper, the completeness would not appear to be higher than 15% at 29 mag.
In general, we would expect errors in the selection volumes to become large faintward of 28.5 mag and especially at 29 mag. We illustrate this by plotting the selection volumes we estimate using different assumed intrinsic half-light radii in Figure 13 for a selection. The completeness corrections that need to be applied in the derivation of the UV LF from the HFF data often exceed a factor 5 at 29 mag. This correction is highly sensitive to assumptions about the galaxy sizes. Clearly, it can be very risky to include such sources in estimates of the LF (especially when the size distribution of sources is not yet clear).444For the most accurate results, of course, the selection volumes and completeness must be derived from a forward modeling procedure that incorporates the impact of a model faint-end slope and photometric scatter.
As the Atek et al. (2015) and Castellano et al. (2016b) studies include only modest numbers of sources fainter than 28.5 mag, we would expect their LF results to be less impacted by the size distribution they assume. For Alavi et al. (2016), no presentation of the apparent magnitude distribution is provided, so its importance is not clear, but it is repeatedly emphasized as a large uncertainty in their derived LF results.
One case where the size distribution is likely to have a large impact is for the Livermore et al. (2017) study. Their samples extend to 29.3 mag. 30% of their sample lies faintward of 29 mag where the completeness corrections are large and uncertain (see histogram in the lower panel of Figure 13 and compare with the completeness corrections shown in the top panel).
Livermore et al. (2017) assume that faint sources have a median half-light radius of 90 mas (0.5 kpc at ).555Interestingly, the faintest source in the Livermore et al. (2017) sample points to a source size smaller than they assume is typical for the faint population. Fitting this galaxy with the profile-fitting software galfit, we find a half-light radius of 70 mas in the image plane. Taking a magnification factor of 50 from the Ishigaki et al. (2016) glafic (Oguri 2010) model, this translates to the source having an intrinsic half-light radius of 10 mas, consistent with what we are finding in this paper (and small compared to 90 mas). With the smaller sizes for very faint galaxies implied by the current results (20-30 mas) we would expect the volume density of faint sources that Livermore et al. (2017) derive to be significantly higher than what we derive. We would also expect their faint-end slope results to be biased towards steeper values (as in Figure 2.)
As we consider such an assessment of the Livermore et al. (2017) LF results, it is useful to understand a little about how these results were derived. The faint-end slope that would be obtained from a fit to the individual points in their LF points is (see their Figure 10). Livermore et al. (2017) then apply an Eddington bias correction that reduces this slope. The Eddington bias correction Livermore et al. (2017) apply is quite large in specific magnitude ranges, i.e., 0.5-0.8 mag, and results in a faint-end slope of . [This estimate for the applied Eddington bias correction is derived based on the horizontal offset between the solid and dotted purple lines in their Figure 11.] Based on our own simulations we cannot justify such large Eddington bias corrections and suggest that 0.075 mag may be more appropriate. This would imply more minimal corrections to the LF. Unless we have missed something, it would appear that Livermore et al. (2017) applied a correction which was too strong in reducing their faint-end slope results from 2.3 to 2.1.
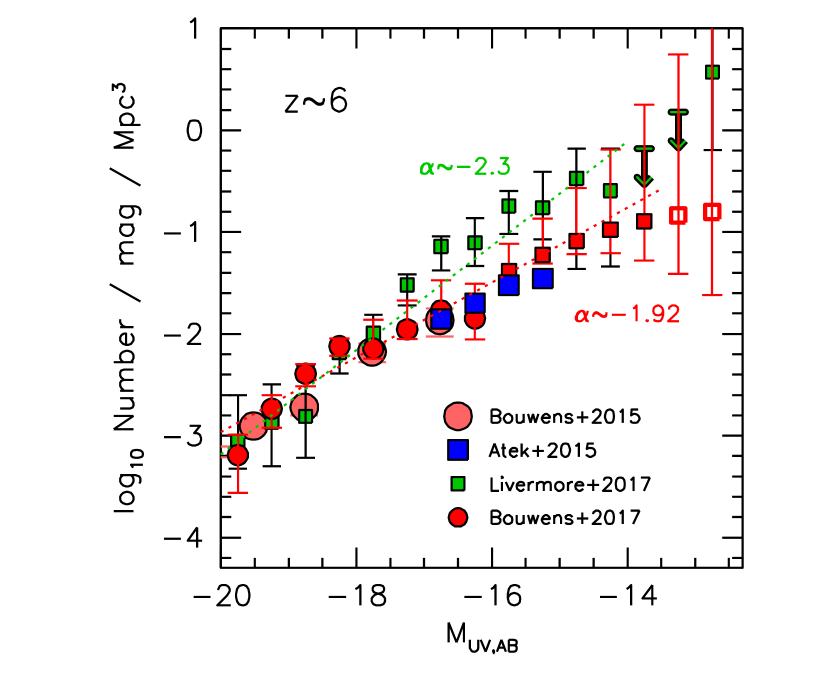
With this background, we now present in Figure 14 a comparison of the Livermore et al. (2017) LF with other determinations of this LF from Atek et al. (2015), Bouwens et al. (2015), and Bouwens et al. (2017). No correction is made for Eddington bias to ensure all four LF results are treated similarly.
What is striking about this comparison is that it demonstrates again (as in Figure 2) the crucially important role played by using the actual sizes of very faint galaxies when deriving LF constraints (and the need for special caution around the completeness limit because of the large corrections required).
6.3. Implications of these results for state-of-the-art selection volume methods
Results from this paper suggest a steep size-luminosity relation at high redshift, with faint galaxies being very small in physical size, having morphologies that are much more akin to point sources than we previously expected (5-10 mas intrinsic half-light radii, equivalent to 20-50 pc at z6 and 40-80 pc at z2-3).
For such small source sizes, we would expect that the most discernible impact of lensing to be on the total fluxes. The impact of shear is less important. This is of enormous convenience to know if one is running simulations, since it means that we can perhaps model galaxies as if they were point sources, and for many applications it appears this produces reasonable results. The advantage is that simulations can be run much more similarly to those for blank fields such as the HUDF.666Given that real galaxies must have non-zero sizes, it is clear that this is an approximation and therefore it must break down in certain regimes. However, the point we make in the current paper is that one can obtain surprisingly reasonable selection volume estimates by simply treating galaxies as point sources.
As the current observational results have illustrated, there appears to be no strong empirical motivation to accurately model the impact of lensing on the spatial profiles or morphologies of galaxies for estimating completeness. Even after considering every faint -8 source in the high magnification regions behind 4 HFF clusters, we recover essentially equal surface densities of galaxies in regions of both low and high shear, as illustrated by Figure 6. No statistically significant trend is present vs. shear factor. Along similar lines, a stack of faint sources predicted to be highly sheared reveals little elongation along the axis of maximum shear. This suggests that the faintest galaxies are not only very compact, but also show no evidence for diffuse, lower-surface brightness structure.
If we cannot (after considerable effort) detect such spatial distortion effects from lensing in our total sample of faint -8 galaxies identified behind the first 4 HFF clusters, it suggests that such effects may only have modest impact on the visibility of sources behind lensing clusters, and one could potentially ignore the impact of lensing in running selection volume simulations to estimate the luminosity function.
We emphasize that the recommendation we provide above is based on the study of very faint sources with absolute magnitudes mag. For larger, brighter sources, lensing shear is almost certainly more important, and detailed simulations (which include lensing transformations) are likely required to derive accurate selection volume and completeness estimates, as recommended earlier by Oesch et al. (2015).
7. Summary
In this paper, we present an entirely new approach for deriving constraints on the size distribution of extremely faint galaxies seen behind the HFF clusters. Strong constraints on this size distribution are essential for estimating the efficiency (or completeness) with which we can find such faint galaxies behind the HFF clusters and hence obtaining accurate constraints on their prevalence.
The approach keys on the idea that highly-magnified galaxies should be significantly easier to find in regions with low shear than high shear. Large intrinsic sizes would result in the largest differences between the two shear regions, while small, almost point-like sizes would result in essentially no differences in the observed surface densities in the two regions.
Using sophisticated image construction and source recovery simulations, we quantify how the selection efficiency of galaxies would depend on the predicted shear for S/N appropriate for the HFF clusters, for a variety of different assumptions about the intrinsic sizes.
Taking advantage of a large sample of 87 high-magnification (-100) -8 galaxies identified behind the first four HFF clusters, we look at how the surface density of high-magnification -8 galaxies depends on the predicted shear. Remarkably, we find that our observed samples show no statistically-significant dependence on shear. Leveraging our simulation results to interpret this observational finding, we conclude that extremely faint (15 mag) galaxies have intrinsic half-light radii less than 30 mas and 60 mas (87% and 99% confidence, respectively).
The constraints we can set on the overall size distribution weakens if we consider galaxies to have a range of sizes, due to our tendency to preferentially select the smallest galaxies. For a lognormal size distribution with 0.3 dex scatter, we infer that the median intrinsic half-light radius is no larger than 30 mas and 60 mas (74% and 99% confidence, respectively).
As a basic check on the size constraints we obtained using this new shear-based technique, we also examined the spatial profiles of 26 intrinsically-faint ( mag) -8 galaxies expected to be stretched by 10 along one dominant shear axis. We compared the spatial profile of these galaxies with what one would expect for various assumptions about the intrinsic half-light radius and also using the CATS lensing model.
Amazingly, sources showed essentially no evidence for spatial extension along the major shear axis. This was true both on an individual basis – with suggestive half-light radii of 3-10 mas – and after stacking the spatial profile of many sources expected to be elongated by 10 along a dominant shear axis. Our stack results suggest intrinsic half-light radii of 4 mas for the faint galaxies, which corresponds to 20 pc at . Remarkably, this is even smaller than many GMCs or star-forming clumps seen in galaxies from to 4 (Kennicutt et al. 2003; Livermore et al. 2012, 2015).
These results are of enormous importance for determinations of the faint end of the LF at -9, as they allow for a proper quantification of the probable selection efficiencies and volumes for faint -9 galaxies. Without such a quantification, the faint-end slope determinations need to factor in large uncertainties resulting from the lack of knowledge of the size distributions for faint galaxies. In such cases, assumptions are made about the sizes that can lead to incorrect determinations of the volume density and LF shape.
In this context, it is clear that many recent LF results at mag are significantly impacted by the typically large sizes of 100 mas assumed for faint sources. For example, accounting for the much smaller sizes found here, we would expect dramatically lower volume densities for very faint sources and also flatter faint-end slopes than has been reported in many recent works. The differences can be as much as -0.3 or larger, which makes a very large difference to the UV luminosity density computed from galaxies in the reionization epoch (Figure 2). In Bouwens et al. (2017), we present determinations of the faint-end slope of the LF using the present size constraints and find 1.920.04.
The steep size-luminosity relations suggested by the present results have important implications for the simulations that must be run to estimate the selection volumes behind lensing clusters. Indeed, if we take as representative our current results where almost all faint sources are small, i.e., 20 mas, we can arrive at surprisingly accurate estimates of the selection volume, simply by treating faint (30 mag) galaxies as point sources. This simplification is of great value to anyone deriving the needed selection volumes, since it means that one can, for all practical purposes, ignore the impact of lensing on the spatial profiles or morphologies of galaxies and simply make use of selection volume simulations such as we use on the HUDF.
In drawing the present conclusions on source sizes, we remind our audience that we exercise a significant reliance on the lensing models that have been made publicly available over the HFF clusters. If there exist any large systematic inaccuracies in those models, it would impact the conclusions drawn in this paper.
An important priority for future work would be to extend the current study to brighter sub- sources where the impact of lensing can clearly be seen in the morphologies and then to study the transition from extremely faint galaxies behind the HFF clusters to galaxies which are slightly brighter.
While it clearly remains desirable to enhance the sample size and to
derive more accurate constraints on the size distribution as a
function of magnitude for high redshift galaxies at , the
bottom line from the present study indicates quite strongly that for
high redshift galaxies fainter than 30 mag, the half-light sizes
should be taken to be 30 mas (200 pc) with the likelihood
that half-light sizes around 5-10 mas (30-60 pc) may well be quite
common.
References
- Alavi et al. (2014) Alavi, A., Siana, B., Richard, J., et al. 2014, ApJ, 780, 143
- Alavi et al. (2016) Alavi, A., Siana, B., Richard, J., et al. 2016, ApJ, 832, 56
- Atek et al. (2014) Atek, H., Richard, J., Kneib, J.-P., et al. 2014, ApJ, 786, 60
- Atek et al. (2015) Atek, H., Richard, J., Kneib, J.-P., et al. 2015a, ApJ, 800, 18
- Atek et al. (2015) Atek, H., Richard, J., Jauzac, M., et al. 2015b, ApJ, 814, 69
- Beckwith et al. (2006) Beckwith, S. V. W., Stiavelli, M., Koekemoer, A. M., et al. 2006, AJ, 132, 1729
- Bertin and Arnouts (1996) Bertin, E. and Arnouts, S. 1996, A&AS, 117, 39
- Bouwens et al. (2007) Bouwens, R. J., Illingworth, G. D., Franx, M., & Ford, H. 2007, ApJ, 670, 928
- Bouwens et al. (2011) Bouwens, R. J., Illingworth, G. D., Oesch, P. A., et al. 2011, ApJ, 737,
- Bouwens et al. (2012) Bouwens, R. J., Illingworth, G. D., Oesch, P. A., et al. 2012, ApJ, 754, 83
- Bouwens et al. (2014) Bouwens, R. J., Illingworth, G. D., Oesch, P. A., et al. 2014, ApJ, 793, 115
- Bouwens et al. (2015) Bouwens, R. J., Illingworth, G. D., Oesch, P. A., et al. 2015, ApJ, 803, 34
- Bouwens et al. (2017) Bouwens, R. J., Oesch, P. A., Illingworth, G. D., Ellis, R. S., & Stefanon, M. 2017, submitted, arXiv:1610.00283
- Bradač et al. (2009) Bradač, M., Treu, T., Applegate, D., et al. 2009, ApJ, 706, 1201
- Bradley et al. (2012) Bradley, L. D., Trenti, M., Oesch, P. A., et al. 2012, ApJ, 760, 108
- Calvi et al. (2013) Calvi, V., Pizzella, A., Stiavelli, M., et al. 2013, MNRAS, 432, 3474
- Castellano et al. (2016) Castellano, M., Amorín, R., Merlin, E., et al. 2016a, A&A, 590, A31
- Castellano et al. (2016) Castellano, M., Yue, B., Ferrara, A., et al. 2016b, ApJ, 823, L40
- Choudhury et al. (2015) Choudhury, T. R., Puchwein, E., Haehnelt, M. G., & Bolton, J. S. 2015, MNRAS, 452, 261
- Coe et al. (2015) Coe, D., Bradley, L., & Zitrin, A. 2015, ApJ, 800, 84
- Duncan et al. (2014) Duncan, K., Conselice, C. J., Mortlock, A., et al. 2014, MNRAS, 444, 2960
- Dunlop et al. (2013) Dunlop, J. S., Rogers, A. B., McLure, R. J., et al. 2013, MNRAS, 432, 3520
- Finkelstein et al. (2012) Finkelstein, S. L., Papovich, C., Salmon, B., et al. 2012, ApJ, 756, 164
- Finkelstein et al. (2014) Finkelstein, S. L., Ryan, R. E., Jr., Papovich, C., et al. 2014, ArXiv e-prints
- Graus et al. (2016) Graus, A. S., Bullock, J. S., Boylan-Kolchin, M., & Weisz, D. R. 2016, MNRAS, 456, 477
- Grazian et al. (2011) Grazian, A., Castellano, M., Koekemoer, A. M., et al. 2011, A&A, 532, A33
- Hathi et al. (2008) Hathi, N. P., Jansen, R. A., Windhorst, R. A., et al. 2008, AJ, 135, 156
- Huang et al. (2013) Huang, K.-H., Ferguson, H. C., Ravindranath, S., & Su, J. 2013, ApJ, 765, 68
- Ishigaki et al. (2015) Ishigaki, M., Kawamata, R., Ouchi, M., et al. 2015, ApJ, 799, 12
- Jauzac et al. (2015) Jauzac, M., Jullo, E., Eckert, D., et al. 2015a, MNRAS, 446, 4132
- Jauzac et al. (2015) Jauzac, M., Richard, J., Jullo, E., et al. 2015b, MNRAS, 452, 1437
- Johnson et al. (2014) Johnson, T. L., Sharon, K., Bayliss, M. B., et al. 2014, ApJ, 797, 48
- Jullo & Kneib (2009) Jullo, E., & Kneib, J.-P. 2009, MNRAS, 395, 1319
- Kennicutt et al. (2003) Kennicutt, R. C., Jr., Armus, L., Bendo, G., et al. 2003, PASP, 115, 928
- Koekemoer et al. (2013) Koekemoer, A. M., Ellis, R. S., McLure, R. J., et al. 2013, ApJS, 209, 3
- Kuhlen & Faucher-Giguère (2012) Kuhlen, M., & Faucher-Giguère, C.-A. 2012, MNRAS, 423, 862
- Laporte et al. (2016) Laporte, N., Infante, L., Troncoso Iribarren, P., et al. 2016, ApJ, 820, 98
- Liesenborgs et al. (2006) Liesenborgs, J., De Rijcke, S., & Dejonghe, H. 2006, MNRAS, 367, 1209
- Livermore et al. (2012) Livermore, R. C., Jones, T., Richard, J., et al. 2012, MNRAS, 427, 688
- Livermore et al. (2015) Livermore, R. C., Jones, T. A., Richard, J., et al. 2015, MNRAS, 450, 1812
- Livermore et al. (2017) Livermore, R., Finkelstein, S., Lotz, J. 2017, ApJ, 835, 113
- Lotz et al. (2017) Lotz, J. M., Koekemoer, A., Coe, D., et al. 2017, ApJ, 837, 97
- Kawamata et al. (2015) Kawamata, R., Ishigaki, M., Shimasaku, K., Oguri, M., & Ouchi, M. 2015, ApJ, 804, 103
- Kawamata et al. (2016) Kawamata, R., Oguri, M., Ishigaki, M., Shimasaku, K., & Ouchi, M. 2016, ApJ, 819, 114
- McLure et al. (2013) McLure, R. J., Dunlop, J. S., Bowler, R. A. A., et al. 2013, MNRAS, 432, 2696
- Merlin et al. (2016) Merlin, E., Amorín, R., Castellano, M., et al. 2016, A&A, 590, A30
- Oesch et al. (2012) Oesch, P. A., Bouwens, R. J., Illingworth, G. D., et al. 2012, ApJ, 759, 135
- Oesch et al. (2015) Oesch, P. A., Bouwens, R. J., Illingworth, G. D., et al. 2015, ApJ, 808, 104
- Oguri (2010) Oguri, M. 2010, PASJ, 62, 1017
- Oke & Gunn (1983) Oke, J. B., & Gunn, J. E. 1983, ApJ, 266, 713
- Parsa et al. (2016) Parsa, S., Dunlop, J. S., McLure, R. J., & Mortlock, A. 2016, MNRAS, 456, 3194
- Peng et al. (2002) Peng, C. Y., Ho, L. C., Impey, C. D., & Rix, H.-W. 2002, AJ, 124, 266
- Planck Collaboration et al. (2015) Planck Collaboration, Ade, P. A. R., Aghanim, N., et al. 2015, arXiv:1502.01589 [PC15]
- Priewe et al. (2017) Priewe, J., Williams, L. L. R., Liesenborgs, J., Coe, D., & Rodney, S. A. 2017, MNRAS, 465, 1030
- Richard et al. (2014) Richard, J., Jauzac, M., Limousin, M., et al. 2014, MNRAS, 444, 268
- Robertson et al. (2013) Robertson, B. E., Furlanetto, S. R., Schneider, E., et al. 2013, ApJ, 768, 71 [R13]
- Rogers et al. (2014) Rogers, A. B., McLure, R. J., Dunlop, J. S., et al. 2014, MNRAS, 440, 3714
- Schenker et al. (2013) Schenker, M. A., Robertson, B. E., Ellis, R. S., et al. 2013, ApJ, 768, 196
- Schmidt et al. (2014) Schmidt, K. B., Treu, T., Trenti, M., et al. 2014, ApJ, 786, 57
- Sebesta et al. (2016) Sebesta, K., Williams, L. L. R., Mohammed, I., Saha, P., & Liesenborgs, J. 2016, MNRAS, 461, 2126
- Shibuya et al. (2015) Shibuya, T., Ouchi, M., & Harikane, Y. 2015, ApJS, 219, 15
- van der Wel et al. (2014) van der Wel, A., Franx, M., van Dokkum, P. G., et al. 2014, ApJ, 788, 28
- Vulcani et al. (2017) Vulcani, B., Trenti, M., Calvi, V., et al. 2017, ApJ, 836, 239
- Wilkins et al. (2011) Wilkins, S. M., Bunker, A. J., Stanway, E., Lorenzoni, S., & Caruana, J. 2011, MNRAS, 417, 717
- Yan & Windhorst (2004) Yan, H., & Windhorst, R. A. 2004, ApJ, 612, L93
- Zitrin et al. (2012) Zitrin, A., Broadhurst, T., Bartelmann, M., et al. 2012, MNRAS, 423, 2308
- Zitrin et al. (2013) Zitrin, A., Meneghetti, M., Umetsu, K., et al. 2013, ApJ, 762, L30
- Zitrin et al. (2015) Zitrin, A., Fabris, A., Merten, J., et al. 2015, ApJ, 801, 44
Appendix A A. Size Measurements for Brighter sub-L∗ Galaxies and Comparisons with Sizes Measurements of Field Galaxies
In §5, we attempted to obtain direct constraints on the sizes of sources in the high magnification regions. Amazingly, the half-light radii we inferred for faint sources from direct size measurements was 4 mas for -8. 4 mas is equivalent to physical sizes of 25 pc for individual galaxies for very faint galaxies.
Given the possibility that such extreme size inferences are the result of systematic errors in the lensing models, it is useful to attempt to constrain the sizes of more luminous sources where the size distribution is more well established from studies over fields like the HUDF.
We therefore repeat the exercise from §5 but this time only considering those sources with intrinsic magnitudes in the range 27.0 mag to 29.4 mag, where size constraints are already available from fields like the HUDF. As in §5, we again treat sources as having an approximate circular profile, with half-light radii of 3 mas, 10 mas, 30 mas, and 100 mas, as well as source sizes given by the Shibuya et al. (2015) size-luminosity relations. The results are presented in Figure 15 for the six well-separated sources in the magnitude range in question.
As should be clear from Figure 15, the observed sources generally have sizes and spatial profiles that are reasonably consistent with expectations for 28 mag galaxies. We can look at this comparison more quantitatively by using galfit to fit the profiles of the sources shown in Figure 15. Fitting to each of the sources plotted here accounting for the impact of lensing as in §5.1, we measure a mean intrinsic half-light radius of 0.35 kpc vs. an expected mean half-light radius of 0.42 kpc, which is excellent agreement overall.