Preprint for accepted SPIE Medical Imaging Conference 2016 manuscript. DOI: 10.1117/12.2217003
Multimodal Brain Visualization
Abstract
Current connectivity diagrams of human brain image data are either overly complex or overly simplistic. In this work we introduce simple yet accurate interactive visual representations of multiple brain image structures and the connectivity among them. We map cortical surfaces extracted from human brain magnetic resonance imaging (MRI) data onto 2D surfaces that preserve shape (angle), extent (area), and spatial (neighborhood) information for 2D (circular disk) and 3D (spherical) mapping, split these surfaces into separate patches, and cluster functional and diffusion tractography MRI connections between pairs of these patches. The resulting visualizations are easier to compute on and more visually intuitive to interact with than the original data, and facilitate simultaneous exploration of multiple data sets, modalities, and statistical maps.
keywords:
Brain, multimodal, visualization, tractography, statistical maps, MRI1 INTRODUCTION
The human brain is notoriously complex in its shape and connectivity, even at scales at which magnetic resonance imaging (MRI) can measure. Visualization is a natural means of exploring possible relationships across scan types (multimodal data) or statistical variables (multivariate data). However, visualizing brain image data in the original form of the brain can result in dense, cluttered, and uninterpretable images, whereas visualizing an abstract representation of information extracted from the same data can result in over-simplified images that are too removed from their source to be intuitive and meaningful [1]. In this article, we introduce novel methods for representing brain image data that are conducive to interactive visualizations that retain some of the benefits of the data in their original space while taking advantage of the simplicity and elegance of more abstract formats. To attain this balance, we map cortical surfaces extracted from human brain image data onto 2D surfaces that preserve shape (angle), extent (area) and spatial (neighborhood) information, split these surfaces into separate patches, and cluster connections between pairs of these patches. We maintain that the resulting visualizations are more intuitive and comprehensible than conventional native brain images or information graphics such as abstract network diagrams. The reason we are interested in visualizations of brain image data that are intermediate between realistic and abstract representations is not only that they could be easier to compute on than the original data and more visually intuitive to interact with than the abstract form, but they also have the potential to make it easier to simultaneously explore multiple data sets, modalities, and statistical maps.
2 MULTIMODAL BRAIN VISUALIZATIONS
Our focus in this work is to open up avenues to study the brain in simpler topological domains (disk or sphere), keeping the integrity of the original data. This will allow the user to explore the brain in the native and transformed space seamlessly, and hence be able to confirm the findings from the transformed space in the native space and vice versa. Apart from providing an easier way to visualize the brain data, the transformation to simpler topological domains also allows easier ways to compute on the brain data. In the following sections, we outline the details for our pipeline and the resultant visualizations.
2.1 Pipeline
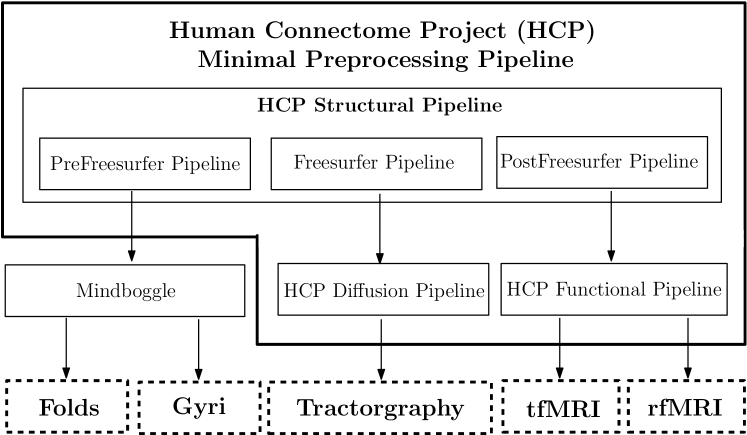
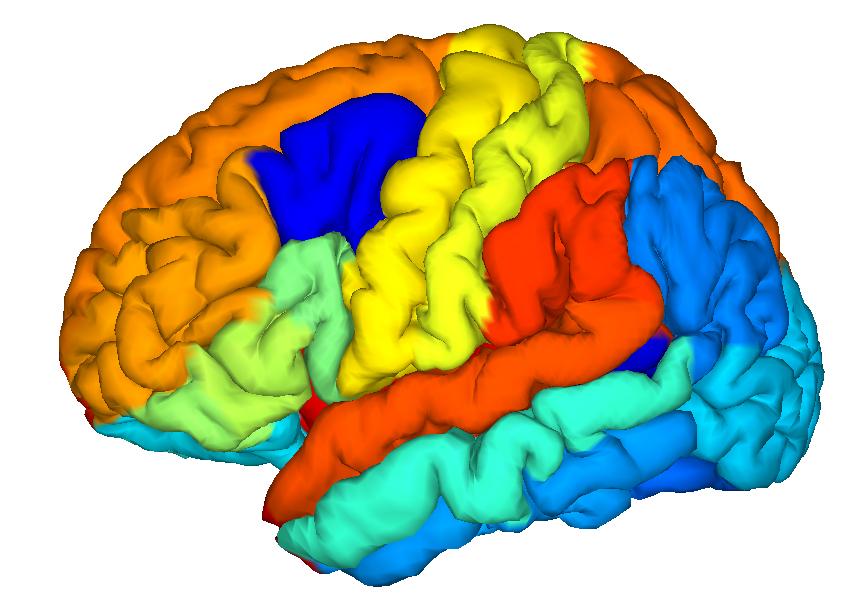
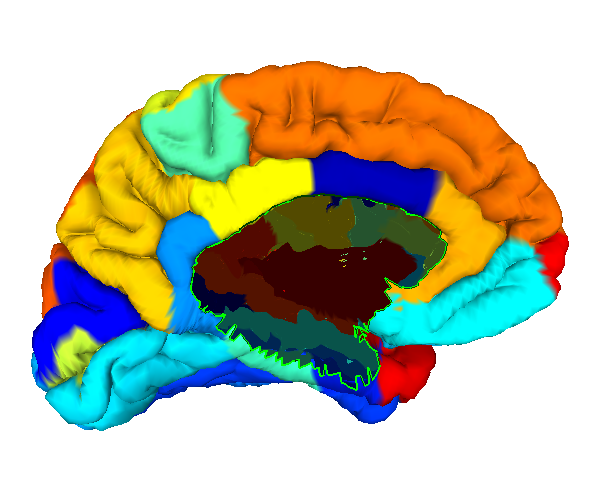
We use the Human Connectome Project (HCP) [2] data and a minimal preprocessing pipeline [3] along with Mindboggle [4], ANTS [5], and DSI Studio [6] to obtain the highest fidelity structural, functional, and diffusion data for our visualizations. The transformation of the brain data from the initial brain MRI scans to the registered brain cortical surfaces (triangular meshes), tractography data, and functional clusters is outlined in Figure 1. The HCP pipeline produces separate left and right brain cortical surfaces to allow their exploration in isolation. We remove the extraneous region added to these resultant cortical surfaces (Figure 2b) to allow for easier disk and spherical mapping, as demonstrated in the next section.
 |
 |
 |
 |
| (a) | (b) | (c) | (d) |
 |
 |
 |
| (a) | (b) |
2.2 Disk and Spherical Mapping
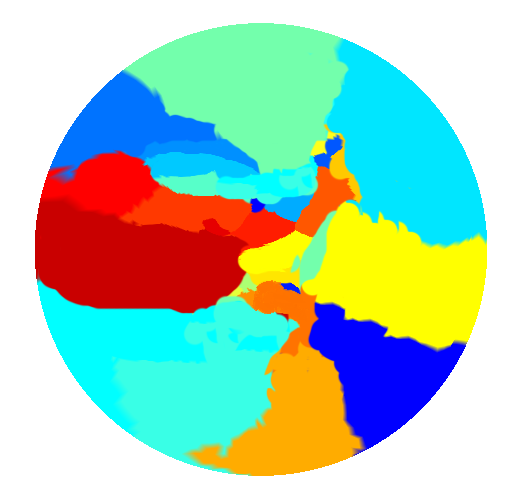
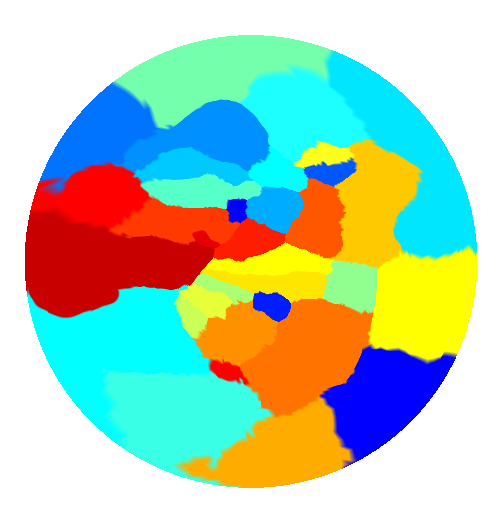
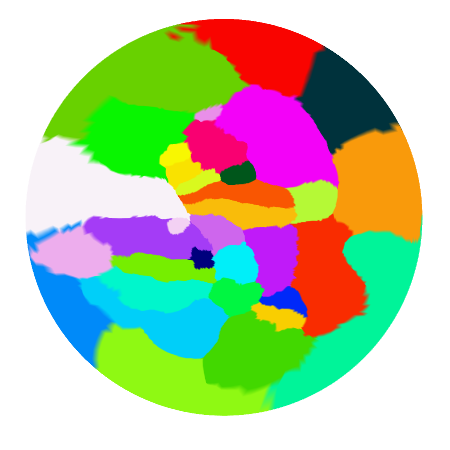
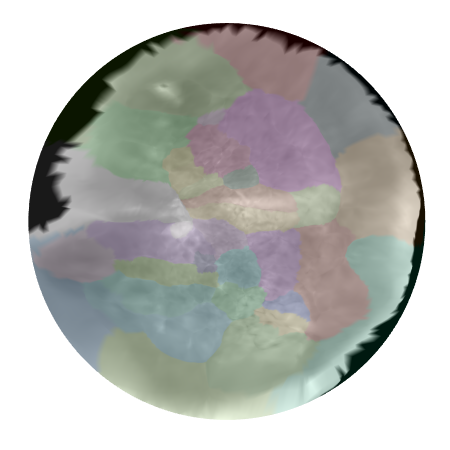
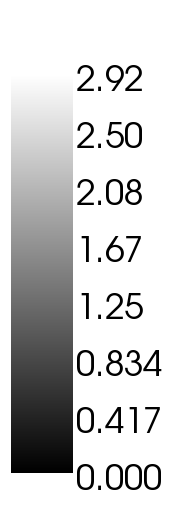
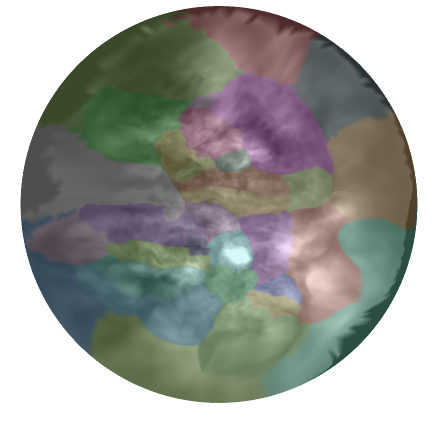
We use 2D angle-area preserving mapping [8] to transform the complex 3D geometry of a right or left brain hemisphere (computed from our pipeline 1) into a simpler 2D disk map, as shown in Figure 2. The simultaneous angle and area preservation of the brain hemispheres is critical to study the overlaid statistical maps from the functional MRI data since these are of low resolution and the smallest distortions in area or angle can lose critical brain activity information. Moreover, the angle-area preserving mapping retains the original brain geometry information as closely as possible, hence allowing it to be mapped back to the original 3D geometry using simple sampling techniques. We demonstrate the 2D mapping overlaid with myelin deposits, which has been associated with autism and Alzheimer’s, in a grayscale colormap in Figure 3.
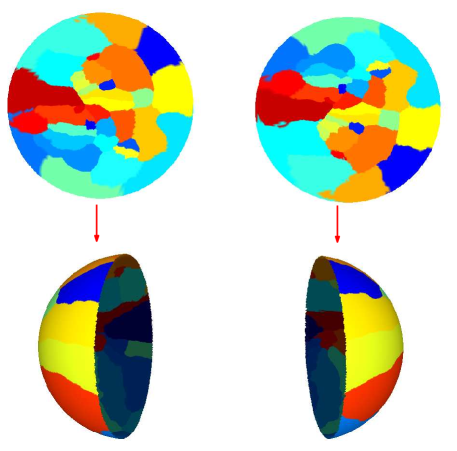
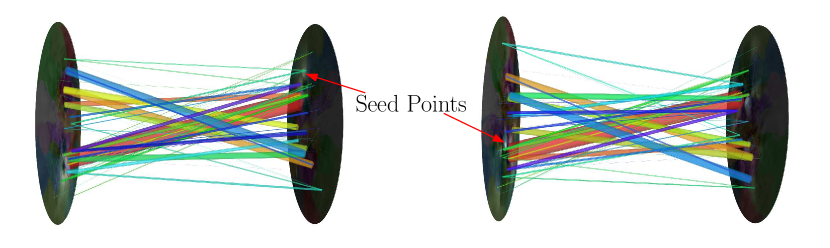
We also present a spherical mapping approach to combine the two brain hemispheres from our pipeline using inverse stereographic projection and alignment along the boundary vertices, as shown in Figure 4. The spherical mapping allows us to visualize the complete brain – combined left and right hemispheres – (which is a genus-0 surface) in its true parametric domain, that is, a sphere. We can now add diffusion, functional and other information onto these simpler topological domains, as demonstrated in the next section.
 |
 |
 |
| (a) | (b) | (c) |
 |
 |
| (a) | (b) |
 |
 |
 |
| (a) | (b) | (c) |
2.3 Structural and Functional Connectivity
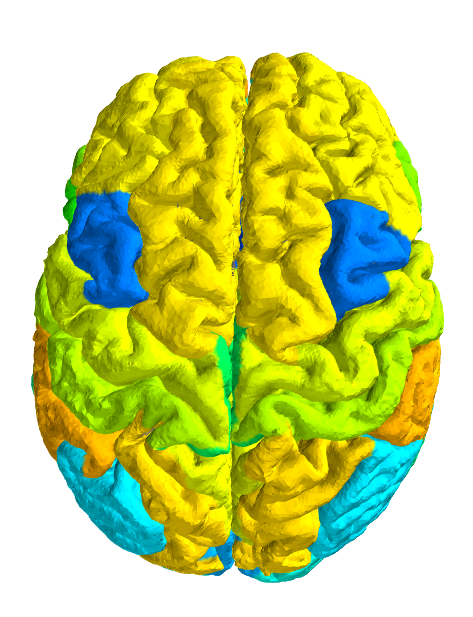
From our pipeline described in Section 2.1, we can retrieve structural data (gyri and folds), deterministic tractography data, resting-state functional MRI data, and task-based functional MRI data. These datasets are already registered to the cortical surfaces retrieved from the Mindboggle pipeline and hence, can be explored in the same space, in tandem.
 |
 |
|
| (a) | (b) | |
 |
 |
|
| (c) | (d) |
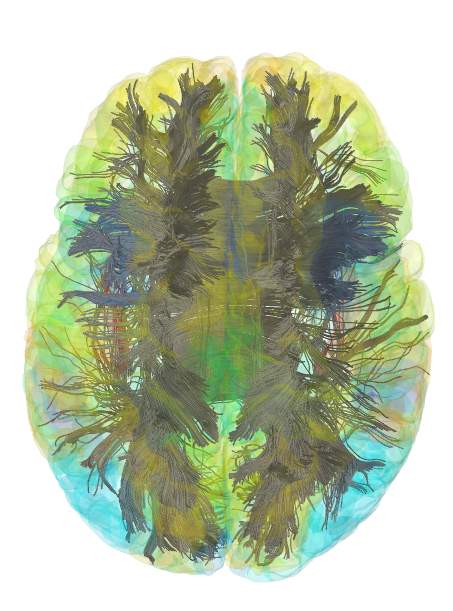
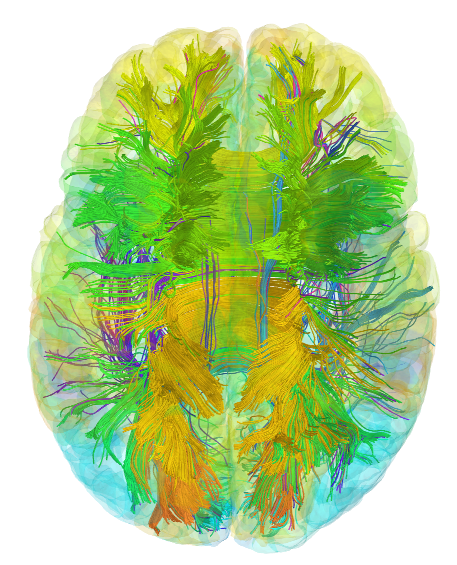
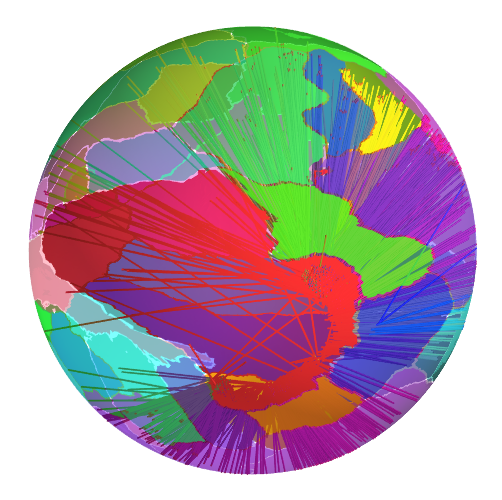
We have opted for deterministic tractography, as opposed to probabilistic tractography, in our current work, since it provides the most precise connections between respective regions of interest (ROIs). To compute the structural/anatomical connectivity visualizations in this paper, we have used the corpus callosum as a seed region.
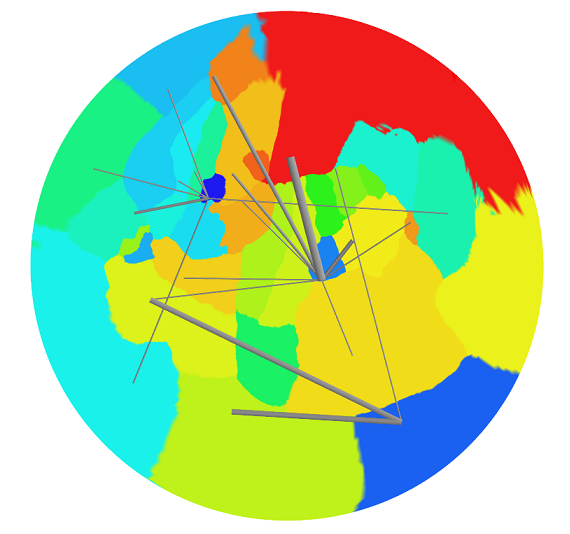
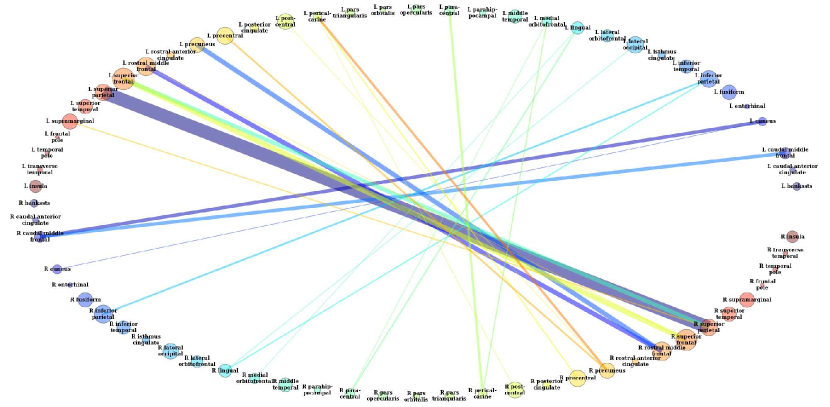
Moreover, in the disk and spherical parametric space, we coalesce tracts into individual coalesced fiber bundles based on the quickbundle fiber clustering algorithm [9]; where there are multiple strategies for coalescing tracts, while in this work we coalesce at the endpoints of the cluster. The quickbundle cluster computation is shown in Figure 5 and the coalescing of tubes with 2D disks is shown in Figure 6. The network graph corresponding to the anatomical connectivity diagram (in Figure 6) is given in Figure 7 with appropriate region labels.
 |
|
| (a) | (b) |
| (c) | (d) |
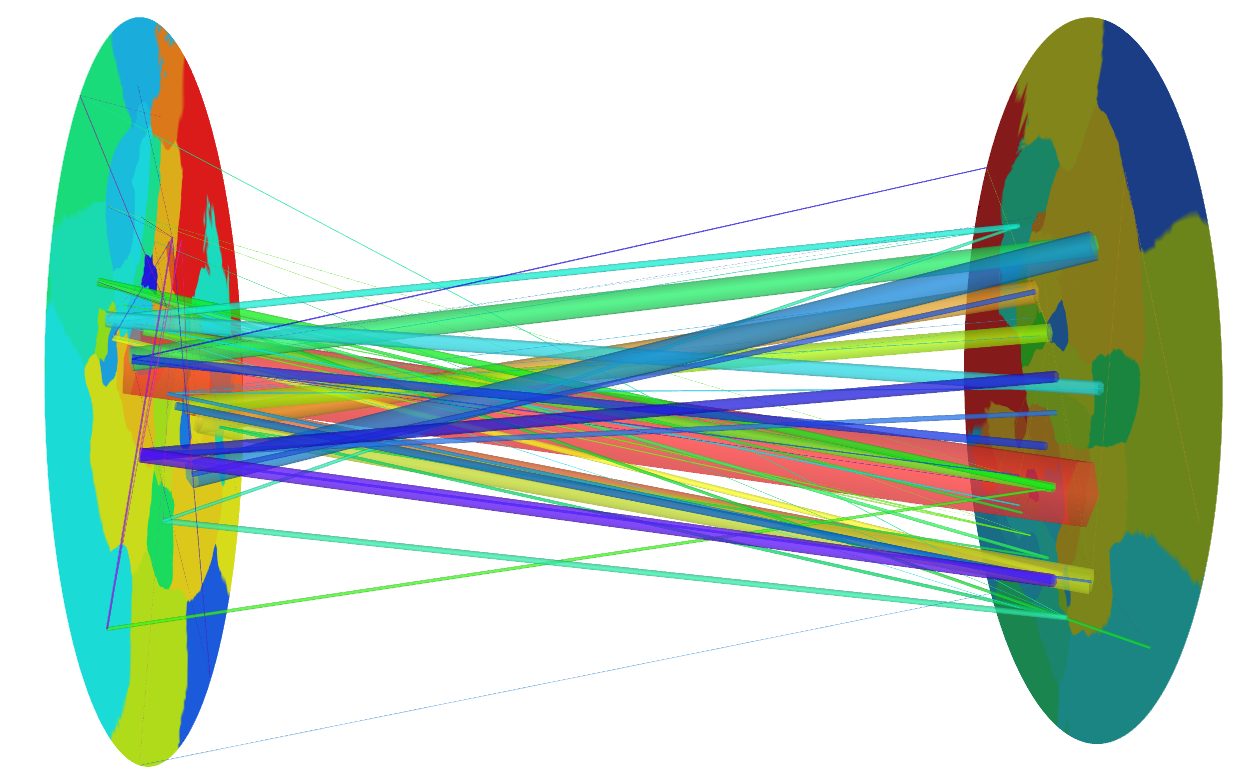
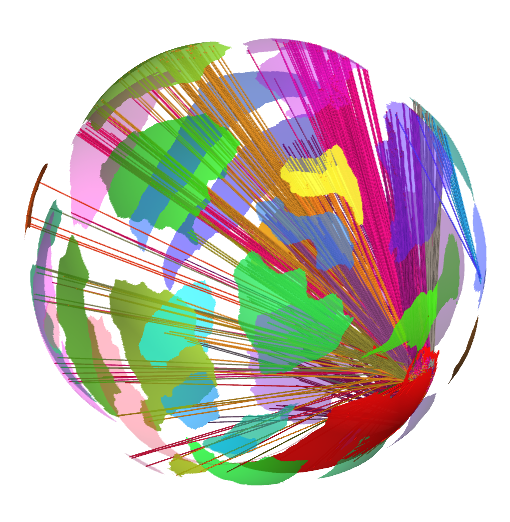
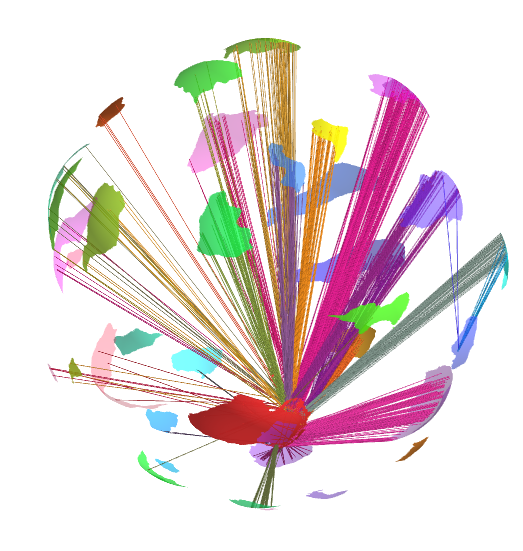
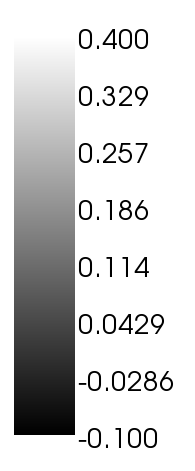
Using the spherical mapping described in Figure 4, we can now map the stretched tracts in different exploded views to delineate the connections clearly, as demonstrated in Figure 8. This allows the user to select and interact with individual coalesced fiber bundles in the transformed space.
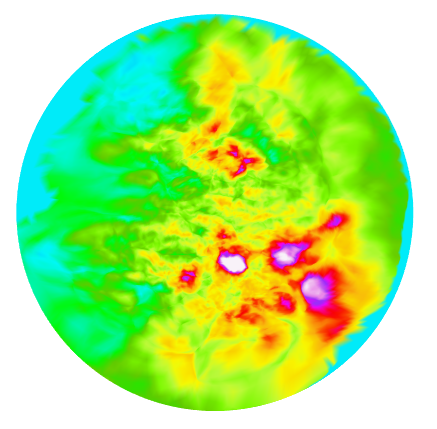
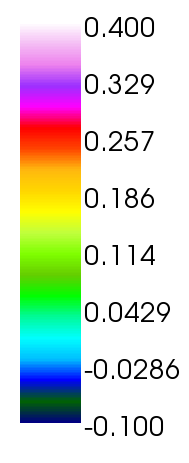
Furthermore, we can overlay statistical activity maps from functional MRI data onto the cortical surfaces and based on the seed points selected be able to see corresponding high activity area on the cortical surface, as shown in Figure 9. This can be used to create connectivity diagram in Figure 6, but with functional statistical activity maps overlaid on the two disks, as shown in Figure 10. Finally, we can consolidate all these modalities into a complete brain spherical map visualization, shown in Figure 11.
3 CONCLUSION
We introduced multimodal visualizations of the brain using the disk and spherical area-angle preserving mapping. The rest of the data is presented in different views on this domain. In this work, we have focused on the cortical surface regions. In the future, we will include subcortical regions in our visualizations. We have used deterministic tractography because it provides a better granularity to study the brain than probabilistic tractography.
We are currently working to include subcortical structures and probabilistic tractography with our current visualizations. In the future, we will incorporate information from other modalities, for example, positron emission tomography, magnetoencephalography, and electoencephalography. We will also extend our multimodal visualizations to other organs, such as prostate and pancreas.
4 ACKNOWLEDGEMENTS
This project is partially funded by Marcus Foundation Inc. Data were provided by the Human Connectome Project, WU-Minn Consortium (PIs: David Van Essen and Kamil Ugurbil) funded by the 16 NIH Institutes and Centers that support the NIH Blueprint for Neuroscience Research; and by the McDonnell Center for Systems Neuroscience at Washington University.
References
- [1] Margulies, D. S., Böttger, J., Watanabe, A., and Gorgolewski, K. J., “Visualizing the human connectome,” NeuroImage 80, 445–461 (2013).
- [2] Van Essen, D. C., Smith, S. M., Barch, D. M., Behrens, T. E., Yacoub, E., Ugurbil, K., and Consortium, W.-M. H., “The WU-Minn human connectome project: An overview,” Neuroimage 80, 62–79 (2013).
- [3] Glasser, M. F., Sotiropoulos, S. N., Wilson, J. A., Coalson, T. S., Fischl, B., Andersson, J. L., Xu, J., Jbabdi, S., Webster, M., Polimeni, J. R., Van Essen, D. C., and Jenkinson, M., “The minimal preprocessing pipelines for the human connectome project,” NeuroImage 80, 105–124 (2013).
- [4] Mindboggle. http://mindboggle.info/.
- [5] ANTS. http://www.nitrc.org/projects/ants/.
- [6] Studio, D. http://dsi-studio.labsolver.org/.
- [7] Fischl, B., “Freesurfer,” NeuroImage 62(2), 774–781 (2012).
- [8] Zhao, X., Su, Z., Gu, X., Kaufman, A., Sun, J., Gao, J., and Luo, F., “Area-preservation mapping using optimal mass transport,” IEEE Transactions on Visualization and Computer Graphics 19(12), 2838–2847 (2013).
- [9] Garyfallidis, E., Brett, M., Correia, M. M., Williams, G. B., and Nimmo-Smith, I., “Quickbundles, a method for tractography simplification,” Frontiers in Neuroscience 6(175) (2012).