Phase-sensitive amplification via coherent population oscillations in metastable helium at room temperature
Abstract
In this letter, we report our experimental results on phase-sensitive amplification (PSA) in non-degenerate signal-idler configuration using ultra-narrow coherent population oscillations in metastable helium at room temperature. We achieved a high PSA gain of nearly 7 with a bandwidth of 200 kHz, by using the system at resonance in a single-pass scheme. Further, the measured minimum gain is close to the ideal value, showing that we have a pure PSA. This is also confirmed from our phase-to-phase transfer curves measurements, illustrating that we have a nearly perfect squeezer, which is interesting for a variety of applications.
Over the last few years, phase-sensitive amplification (PSA) has been a subject of wide research in a variety of fields due to its unique noise properties. It enables amplification of a weak signal without adding any extra noise, i.e. without degrading its signal to noise ratio Caves , and thus finds applications in metrology metrolgy , imaging industry imaging and telecommunication PA2011 . Further, this noiseless amplification is associated with the generation of squeezed states of light, which makes this parametric process very interesting for quantum optics and quantum information experiments Agarwal . PSA has been successfully achieved in nonlinear crystals and waveguides levenson through three-wave mixing ( process), and in fibers TongIEEE2012 and alkali vapors such as rubidium PLprl ; PLOE1 through four-wave mixing (FWM) ( process). Although a very large quantum noise reduction has been achieved using crystals Hemmer , it is difficult to directly couple the down-converted photons with atomic systems because of their frequency and bandwidth, while it would be useful for many applications in quantum information such as realization of atomic memories, processing of atomic qubits through quantum light, entanglement swapping, etc. Realizing PSA in the same atomic system is thus interesting as the generated non-classical light is automatically within the bandwidth of the atomic transition, spectrally narrow, and can moreover be spatially multimode PLOE1 ; JingPRL ; Novikova16 .
Motivated by these works, we report our results on PSA in metastable helium (He4) at room temperature, through coherent population oscillation (CPO) assisted FWM processes in a scheme at resonance. In other atomic systems (e.g. alkali vapors), the FWM process relies on the coherence between the two ground states of the system PLprl ; PLOE1 ; JingPRL . In comparison to this, we use a particular kind of CPO resonance, which involves the dynamics of the population difference of the atoms in the two ground states thomas12 to enhance the non-linearity of the system. It enables us to achieve comparable PSA gains with approximately 2 1011 cm-3 of atomic density, which is at least two orders of magnitude less than rubidium PLOL1 . Further, 4He has other favorable properties such as absence of nuclear spin resulting in a simplified energy level structure without any hyperfine levels. This has an important consequence as it eliminates unwanted FWM processes, which usually arise due to transitions in the nearby hyperfine levels and add extra noise and degrade squeezing PLOE1 . Thus, using this simple system, we expect to achieve high PSA gains, close to resonance, within the Doppler width and implement a perfect squeezer.
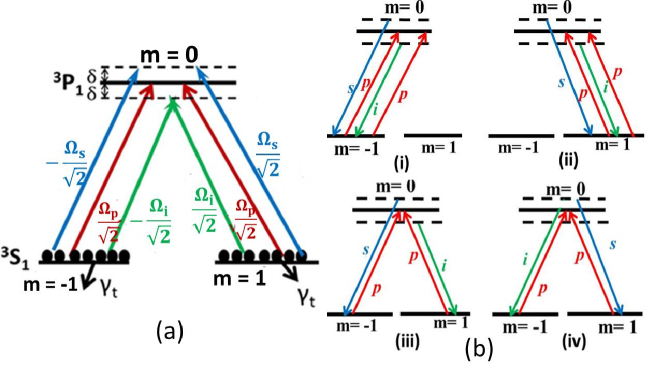
The experiment is based on the (D1) transition of He4, and the system is constituted by two transitions corresponding to and polarizations (see Fig. 1a). We excite this system with linearly polarized pump, signal, and idler beams with co-polarized signal and idler beams orthogonal to the pump beam. A FWM process takes place when two pump photons are annihilated and a signal and an idler photon are generated, or vice versa: due to the chosen polarizations of the beams, there are four FWM channels possible in this system, each conserving energy and momentum (both linear and angular), as shown in fig. 1b. In process (i), two pump (p) photons are absorbed in the left arm and a signal () and a idler () photon are emitted in the same arm. Likewise, in process (ii) all photons are and are on the right arm. These two processes are based on CPO in the coupled open system thomas12 . In process (iii) (and (iv)) two pump photons, a and a , are absorbed and a () signal and a () idler photon are emitted. Processes (iii) and (iv) involve the excitation of Raman coherence between the two ground states. For the present work, we have not performed any quantum measurements and thus, the system can be modeled using classical approach. But in view of the future applications in the quantum domain, we adopt here a quantum-mechanical approach and the qualitative behavior of the PSA can be explained using a similar formalism as in levenson ; Jingth . Considering the pump as a strong classical field and signal and idler beams as quantum mechanical operators, the FWM interaction Hamiltonian can be written as Jingth
| (1) |
where is the annihilation operator corresponding to the signal (idler), is the strength of the FWM process, proportional to the third order susceptibility and the intensity of the pump beam and is the input phase of the pump. In the Heisenberg picture, using the Hamiltonian (Eq. 1), the rate equation for is given as dd, from which its time evolution can be evaluated as:
| (2) |
Neglecting pump depletion, PSA gain for the signal is then computed by calculating the ratio between the average number of signal photons at the output and the input and is found to be
| (3) |
where and is the relative phase between the three beams: pump, signal and idler. Thus, from the above equation (Eq.(3)), we see that the gain is maximum () when and minimum () when and that for an ideal PSA, levenson .
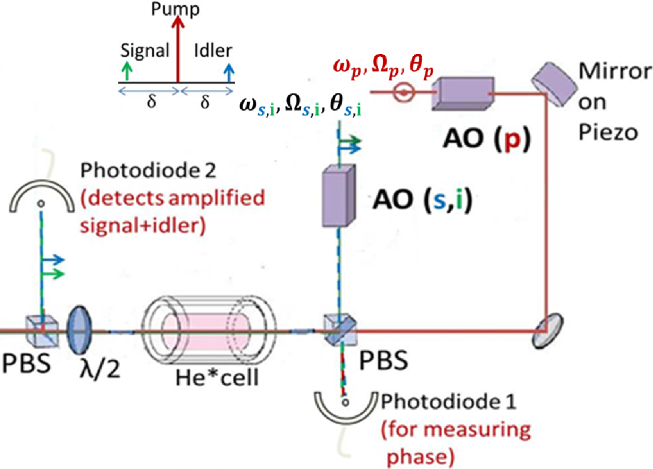
Our experimental set up is shown in fig. 2. The helium cell is 6 cm long, filled with 1 Torr of He4 and is at room temperature. It is placed in a three-layer -metal shield to remove magnetic field gradients. Helium atoms are excited to the metastable state by an RF discharge at 27 MHz. The Doppler width corresponding to the optical transition (D1) is around 0.9 GHz (half width at half maximum). For the non-degenerate signal-idler PSA configuration, signal and idler photons have a frequency separation of and they are symmetrically located on either side of the pump frequency () as shown in fig. 2. Both beams are derived from the same laser at 1.083 m and have nearly the same diameter of about 2 mm. They are controlled in frequencies and amplitudes by two acousto-optic modulators (AO) and recombined using a polarizing beam splitter (PBS). The pump power can be varied from 5 mW to 80 mW using a tapered amplifier while the signal and idler have equal powers at the input of the cell, around 30 W. The input relative phase () between the pump, signal and idler is scanned using a piezo actuator attached to a mirror in the pump path and is measured using the beatnote detected by the photodiode 1 before the cell (see fig. 2). After the cell, polarization optics allows the detection of mainly the amplified signal and idler along with a small amount of coupling. Using this residual coupling as the local oscillator, we perform heterodyne detection and measure the output relative phase of the amplified signal/idler with respect to the pump. Thus, at photodiode 2, we detect the beating between the three beams: signal, idler and residual pump, reading:
| (4) |
where is defined to be the signal (idler) gain, as the ratio of the output signal (idler) intensity to the input signal (idler) intensity. and correspond to the input signal and idler intensities, respectively, and is the residual pump intensity. For PSA operation, we send equal intensities of signal and idler with the same phase, i.e. (and ). We checked that the relative phase between signal and idler is still 0 at the output when is small enough (< 25 kHz), i.e. . This also results in the same phase for the pump-signal and pump-idler beatnote at the output, i.e. . Thus Eq.(4) reduces to
| (5) |
In order to evaluate PSA gain , we perform Fourier transform of the data, which gives us peaks at and frequencies. The gain is then calculated by computing the ratio of the amplitudes of the peak at frequency for the cell-on and cell-off conditions.
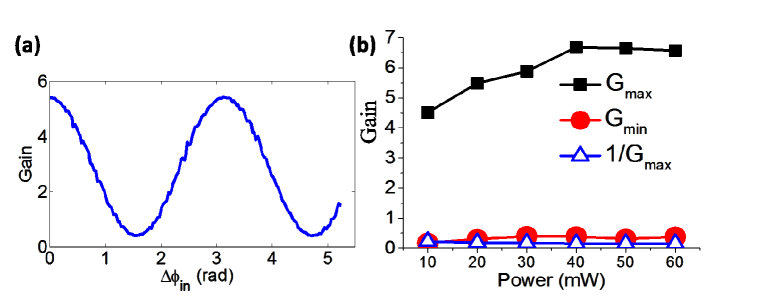
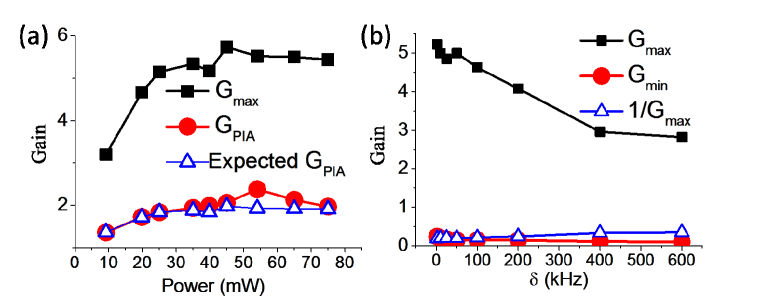
For PSA, as the relative phase () between the pump, signal and idler at the input is scanned, the signal successively undergoes amplification () and deamplification (). Note that in the present case, by our definition, , where is the relative phase between pump and signal at the input. In the experiment, the piezo actuator attached to the mirror in the pump path scans the relative phase and we study the variation of the gain as shown in fig. 3a, which is as expected theoretically (Eq.(3)). The maximum obtainable PSA gain depends on the input pump power, the overlap between the spatial modes of the beams and the optical detuning. We have studied the variation of the maximum and minimum gains ( and , respectively) as a function of pump power as shown in fig. 3b. A maximum gain of around 7 can be achieved for 40 mW of pump power and a pump-signal detuning () of 2 kHz. With better alignment and larger optical thickness, we may achieve even larger gains, for example through a multi-pass scheme. From fig. 3b, it is visible that the measured is close to the ideal value (=1/) for a wide range of pump powers. Further, we have also performed phase insensitive amplification (PIA) in our scheme, by sending only the signal (and no idler) at the input of the cell. In this case, the idler is generated at a frequency () from the vacuum fluctuations and the signal is amplified in the process. Under these conditions, PIA gain can be similarly found using Eq.(2) with no idler at the input, i.e. by substituting . The resulting PIA gain is then given as =g= and from Eq.(3), the relationship between the maximum PSA and PIA gain is: . In the experiment, the PIA gain is measured for different pump powers and is found to be close to its ideal value obtained from the corresponding as shown in fig.4a. We have also investigated the variation of gain with the pump-signal detuning, (fig. 4b, for pump power=30 mW). We define the PSA bandwidth as the maximum value of separation for which is very close to its ideal value (1/). As shown in fig. 4b, the system has a large gain bandwidth of more than 200 kHz. It is to be noted that this agrees well with the bandwidth of the CPO resonance at the corresponding pump power thomas12 . For larger separation, the signal frequency goes out of the transparency window and gets absorbed and thus both maximum and minimum gains tend to drop as shown in fig. 4b. The gain bandwidth can be increased by improving the spatial modes of the beams and the alignment at the input.
.
We must stress here that unlike other atomic systems, our scheme does not suffer from ’unwanted’ FWM processes PLprl ; PLOE1 . This is evidenced from (a) the absence of any additional peaks at any undesired frequency in the Fourier transform of the beatnote pattern detected at photodiode 2, (b) the fact that, in our system, 1/ for a wide range of experimental parameters.
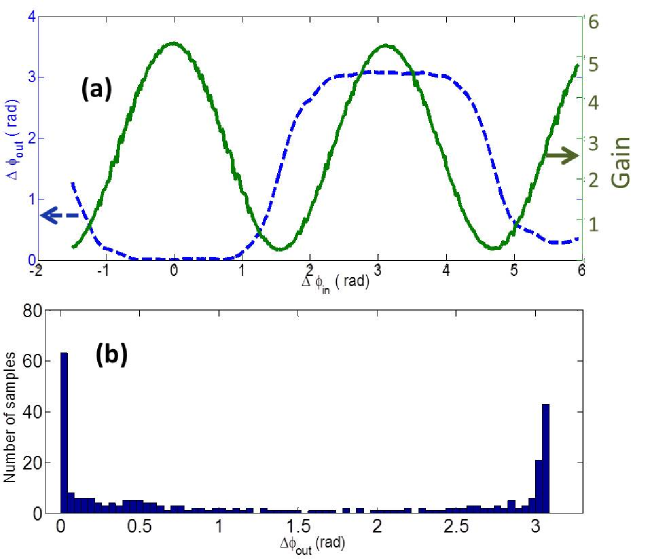
In order to further explore the quality of this phase sensitive amplifier, we investigate the phase-to-phase transfer characteristics of our PSA. Such measurements have been performed earlier in fiber based PSA in the context of phase regeneration PA2011 but for an atom-based PSA, this is being reported for the first time to the best of our knowledge. Such transfer curves can be used to characterize the performance of the amplifier. Figure 5a shows the transfer curves (experimental) for a pump power of 30 mW. The blue (dashed) curve shows the phase transfer which is the variation of the output relative phase () between the pump and signal with the input relative phase (), while the green (solid) curve is the corresponding variation of the PSA gain. As we can see, is either close to 0 or for a wide range of input phases. For an ideal PSA, when the gain is large, the phase transfer curve is like a square wave, oscillating between 0 and , which is called phase squeezing in the telecommunication field PA2011 . In terms of a histogram, the output phase is localized around 0 and as shown in fig. 5b. Such transfer curves are characteristic of a squeezer symplec : the more localized the output phase, the better the performance of the squeezer.
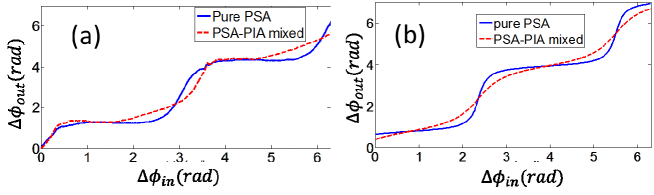
In fig. 6a, we have plotted such phase-to-phase transfer curves (experimental) for two different cases: in the first case, we send in equal intensities of signal and idler at the input and the measured maximum gain is 5.3. The minimum gain is 0.25, which is close to its ideal value (=0.19). This corresponds to a nearly pure PSA and is represented by the blue solid curve in fig. 6a. The second case (red dashed curve) is a mixed PSA-PIA, as signal and idler intensities at the input are not the same: =1.78. We can see from fig. 6a that for a pure PSA, the output phase is quite flat while for mixed PSA-PIA, the output phase exhibits a higher slope. It should be noted that here for a better physical understanding and a clear comparison, we have not wrapped the output phase like in fig. 5a. The corresponding theoretical curves plotted in fig. 6b are obtained considering the fields to be classical PA2011 and agree well with the experimental curves of fig. 6a. The small mismatch of the experimental curve in the case of mixed PSA-PIA with the theoretical curve is probably due to the added uncertainity of the output relative phase between signal-idler which is not completely preserved in the presence of PIA and limits our data processing. Notwithstanding these minor discrepancies, these phase transfer curves qualitatively give an idea of the purity of the PSA. Indeed, we found that these curves are very sensitive to a small mismatch: the output phase is quickly less localized, while is still close to 1. From these results, we expect a high degree of quantum squeezing in our output, which will be very interesting for performing quantum information processing tasks using metastable helium. Further, in order to completely model the system, one needs to consider full density matrix for the system and solve Maxwell-Bloch equations: this work is in progress and will be reported later but from our preliminary simulation results, we have found that the Raman coherence does not play much role in the PSA: it is the CPO based processes which mainly contribute to the PSA gain.
In conclusion, we have demonstrated phase-sensitive amplification in metastable helium using ultra-narrow CPO resonance with a maximum gain of nearly 7 and 200 kHz bandwidth, at resonance and within the Doppler width. The measured PSA and PIA gains are well consistent with each other and close to the ideal values, illustrating that we have a pure PSA without any additional unwanted FWM processes. Such large gains in the absence of an external cavity have been made possible due to inherently large CPO-enhanced offered by the system. Further, we have investigated phase-to-phase transfer characteristics which confirm that this system is a very good squeezer. This ensures that we can realize a pure phase-sensitive amplifier which should lead to the generation of non-classical states of light. Since the gain of the PSA is closely related to the degree of squeezing, we believe that we can generate highly squeezed states at low frequencies over some hundreds of kHz. Since optical storage has already been successfully implemented in this system MACPO , it opens the way to realizing an efficient quantum memory Lvovsky using metastable helium with two cascaded 4He cells. Further, the system is quite versatile and can be used to implement PSA in the degenerate signal-idler configuration, giving rise to the possibility of twin beam generation PL2 .
Funding Indo-French CEFIPRA, labex PALM, Délégation Generale à l’Armement (DGA) and the Region Ile-de-France DIM Nano-K, Institut Universitaire de France (IUF), Chinese Scholarship Council (CSC).
References
- (1) C. M. Caves, Phys. Rev. D 26, 1817 (1982).
- (2) K. McKenzie, D. Shaddock, D. McClelland, B. Buchler, and P. K. Lam, Phys. Rev. Lett. 88, 231102 (2002).
- (3) I. Sokolov and M. Kolobov, Opt. Lett. 29, 703 (2004).
- (4) C. Lundstrom, Z. Tong, M. Karlsson, and P. A. Andrekson, Opt. Lett. 36, 20149 (2011).
- (5) G. S. Agarwal, Quantum optics (Cambridge University Press, 2013).
- (6) J. A. Levenson, I. Abram, T. Rivera, and P. Grangier, J. Opt. Soc. Am. B 10, 2233 (1993).
- (7) Z. Tong, C. Lundstrom, P. A. Andrekson, M. Karlsson, and A. Bogris, IEEE J. Sel. Top. Quantum Electron 18, 1016 (2012).
- (8) N. V. Corzo, A. M. Marino, K. M. Jones, and P. D. Lett, Phys. Rev. Lett. 17, 043602 (2012).
- (9) N. Corzo, A. M. Marino, K. M. Jones, and P. D. Lett, Opt. Exp. 17, 21358 (2011).
- (10) Z. Qin, L. Cao, H. Wang, A. M. Marino, W. Zhang, and J. Jing, Phys. Rev. Lett. 113, 023602 (2014).
- (11) M. Zhang, R. N. Lanning, Z. Xiao, J. P. Dowling, I. Novikova, and E. E. Mikhailov, Phys. Rev. A 93, 013853 (2016)
- (12) H. Vahlbruch, M. Mehmet, S. Chelkowski, B. Hage, A. Franzen, N. Lastzka, S. Goßler, K. Danzmann, and R. Schnabel, Phys. Rev. Lett. 100, 033602 (2008).
- (13) T. Lauprêtre, S. Kumar, P. Berger, R. Faoro, R. Ghosh, F. Bretenaker, and F. Goldfarb, Phys. Rev. A 85, 051805 (2012).
- (14) C. F. McCormick, V. Boyer, E. Arimondo, and P. D. Lett, Opt. Lett. 32, 178 (2007).
- (15) Y. Fang and J. Jing, New J Phys 17, 023027 (2015).
- (16) G. Ferrini, I. Fsaifes, T. Labidi, F. Goldfarb, N. Treps, and F. Bretenaker, J. Opt. Soc. Am. B 31, 1627 (2014).
- (17) M.-A. Maynard, F. Bretenaker, and F. Goldfarb, Phys. Rev. A 90, 061801(R) (2014).
- (18) J. Appel, E. Figueroa, D. Korystov, M. Lobino, and A. I. Lvovsky, Phys. Rev. Lett. 100, 093602 (2008).
- (19) A. M. Marino, V. Boyer, R. C. Pooser, P. D. Lett, K. Lemons, and K. M. Jones, Phys. Rev. Lett. 101, 093602 (2008).