Zenodo
\conferenceThe 19th Cambridge Workshop on Cool Stars, Stellar Systems, and the Sun
\conferencedate2016
\abs
Superflares are flares that release total energy 10104 times greater than
that of the biggest solar flares with energy of 1032 erg.
We searched superflares on solar-type stars (G-type main sequence stars)
using the Kepler 30-min (long) and 1-min (short) cadence data.
We found more than 1500 superflares on 279 stars from 30-min cadence data (Q0-6)
and 187 superflares on 23 stars from 1-min cadence data (Q0-17).
The bolometric energy of detected superflares ranges from the order of 1032 erg to 1036 erg.
Using these data, we found that the occurrence frequency () of superflares is
expressed as a power-law function of flare energy () with the index of -1.5 for erg.
Most of the superflare stars show quasi-periodic light variations with the amplitude of a few percent,
which can be explained by the rotation of the star with large starspots.
The bolometric energy released by flares is consistent with the magnetic energy stored around such large starspots.
Furthermore, our analyses indicate that the occurrence frequency of superflares depends on the rotation period,
and that the flare frequency increases as the rotation period decreases.
However, the energy of the largest flares observed in a given period bin does not show any clear correlation with the rotation period.
We also found that the duration of superflares increases with the flare energy as .
This can be explained if we assume the time-scale of flares is determined by the Alfvn time.
Statistical properties of superflares on solar-type stars with Kepler data
††editors: G. A. Feiden1 Introduction
Solar flares are energetic explosions in the solar atmosphere
and are thought to occur by impulsive releases of magnetic energy stored around sunspots (e.g., Priest 1981; Shibata & Magara 2011; Shibata & Takasao 2016).
Typical total energy released by solar flares are erg.
The occurrence frequency of solar flares decreases as the flare energy increases.
The frequency energy distribution of solar flares can be fitted by a simple power-law function ()
with an index () of in the flare energy range between 1024 and 1032 erg
(e.g., Aschwanden et al. 2000; Shimizu 1995; Crosby et al. 1993).
The total bolometric energy released by the largest solar flares
is estimated to be the order of 1032 erg (Emslie et al., 2012),
and the occurrence frequency of such flares is about once in 10 years.
Stars other than the Sun show flares similar to solar flares (e.g., Gershberg 2005).
Many young stars,
active M-dwarfs known as flare stars,
and binary stars such as RS CVn-type binary stars have “superflares".
Superflares are flares that have a total energy of erg (Schaefer et al., 2000),
10- times larger than that of the largest solar flares on the Sun (erg; Emslie et al. 2012).
Such stars generally rotate fast (a few days and 10km s-1)
and magnetic fields of a few kG are considered to be distributed in large regions on the stellar surface (Gershberg 2005).
In contrast, the Sun slowly rotates (25 days and 2km s-1),
and the mean magnetic field is weak (a few G).
Then it had been thought that superflares cannot occur on slowly-rotating G-type main-sequence stars like the Sun.
Schaefer et al. (2000) reported nine superflare candidates on ordinary solar-type stars
(F8-G8 main-sequence stars).
The data sources of their study were, however, various and somewhat ambiguous
(e.g., photography, X-ray, visual), and the number of discovered
flares is too small to investigate statistical properties, such as the frequency and energy distribution of superflares.
Considering these previous researches, we have analyzed the lightcurve data of solar-type
stars obtained with the Kepler space telescope.
We have aimed to find superflares on ordinary solar-type stars, and to investigate
whether such superflares can occur on the Sun from the statistical points of view.
In the following, we summarized these results, which we have reported on the basis of our analyses of Kepler photometric data
(cf., Maehara et al. 2012 & 2015; Shibata et al. 2013; Shibayama et al. 2013; Notsu et al. 2013b).


2 Data and discovery of superflares
We first searched for superflares on solar-type (G-type main sequence) stars using the long-cadence (30-min time resolution) data of Kepler space telescope observed for the first 500 days (Quarters 06) (Koch et al., 2010). Kepler is very useful for detecting small increases in the stellar brightness caused by stellar flares, because Kepler realized high photometric precision exceeding 0.01% for moderately bright stars, and obtained continuous time-series data of many stars over a long period (Koch et al., 2010). As a result, we discovered 1547 superflare events on 279 solar-type (G-type main-sequence) stars from the data of 90,000 solar-type stars (Maehara et al. 2012; Shibayama et al. 2013). This number is much larger than the 9 flare candidates on solar-type stars discovered by Schaefer et al. (2000). We here define “solar-type stars" as stars that have a surface temperature of K and a surface gravity of on the basis of Kepler Input Catalog (Brown et al., 2011). Figure 1 shows typical examples of superflares observed by Kepler, which show spike-like brightness increases whose amplitude and duration are several percent and several hours, respectively. It should be noted that even one of the largest solar flares in recent 20 years (28 October 2003 X17 flare) showed only 0.03 percent increase in the total solar irradiance (Kopp et al. 2005). The total energy of these superflares in Figure 1 are estimated to be erg and erg (Maehara et al., 2012), which are 1001000 times larger than the largest solar flare (1032 erg).

In the above analyses (Maehara et al. 2012; Shibayama et al. 2013), we only used the Kepler long time cadence data with 30-min sampling, and it was difficult to detect superflares with energy between 1032 to 1034 erg due to low time resolution of the data. Then in Maehara et al. (2015), we newly analyzed the Kepler short time cadence data with 1-min sampling (Gilliland et al., 2010). We found 187 superflares on 23 solar-type stars from the data of 1547 solar-type stars. Figure 2 shows typical light curves of superflares detected from short-cadence data. The amplitude of flares normalized by the average brightness of the star range from to and the bolometric energies of flares range from to erg. The lower end of the amplitude of detected flare is comparable to that of the X17 class solar flare (normalized amplitude ) occurred on Oct 28, 2003 (Kopp et al., 2005). As shown in Figures 2 (b) & (d), some flares show multiple peaks with the peak separation of 100 - 1000 seconds. On the analogy of the solar flare oscillations, these multiple peaks may be caused by coronal oscillations associated with flares (cf. Balona et al. 2015; Pugh et al. 2016).
3 Results and Discussion
3.1 Brightness variation of superflare stars
We then performed more analyses in order to investigate whether properties of superflare stars can be explained by applying our current physical understanding of the Sun. Solar flares are the intense releases of magnetic energy stored around sunspots, as mentioned above. If we assume superflares are the similar magnetic energy releases, large starspots are necessary to explain their large amount of energy. Many of superflare stars show quasi-periodic brightness variations with a typical period of from one day to a few tens of days, as seen in Figures 1 & 2. The amplitude of these brightness variations is in the range of 0.1-10% (Maehara et al., 2012), and is much more larger than that of solar brightness variation (0.01-0.1%; e.g., Lanza et al. (2003)) caused by the existence of sunspots on the rotating solar surface. Such stellar brightness variations can be explained by the rotation of a star with large starspots (Figure 3). Then in Notsu et al. (2013b), we developed this idea by performing simple calculations of brightness variation of the rotating star with large starspots, and showed that these brightness variations of superflare stars can be well explained by the rotation of a star with fairly large starspots, taking into account the effects of the inclination angle and the spot latitude.
These interpretations described here are now supported by the spectroscopic studies. We observed 50 solar-type superflare stars by using Subaru/HDS (Notsu et al. 2013a; Nogami et al. 2014; Notsu et al. 2015a & 2015b; Honda et al. 2015). We first found that more than half of the targets have no evidence of binary system, and stellar atmospheric parameters (temperature, surface gravity, and metallicity) of these stars are in the range of ordinary solar-type stars (Notsu et al., 2015a). Then Notsu et al. (2015b) supported the above interpretation that the quasi-periodic brightness variations of superflare stars are explained by the rotation of a star with large starspots, by measuring (projected rotational velocity) and the intensity of Ca II 8542 line. Existence of large starspots on superflare stars were also supported by Karoff et al. (2016) using Ca II H& K observations with LAMOST telescope. Then in the following, we use rotation period and starspot coverage of each star estimated from the above brightness variations, and discuss statistical properties of superflares and superflare-generating stars.
3.2 Relation between flare energy and area of starspots
Figure 4 shows the scatter plot of flare energy of solar flares and superflares as a function of the area of the sunspot and starspot group (). The area of starspots on superflare stars were estimated from the amplitude of brightness variations. Although there is a large scatter, the majority of energetic flares occur on the stars with large starspots. Since the flares are a result of a sudden conversion of magnetic energy to other forms (i.e., thermal and kinetic energy; cf. Shibata & Magara 2011), the bolometric energy released by flares may be a fraction of the magnetic energy () (Shibata et al. 2013; Notsu et al. 2013b; Maehara et al. 2015).

Here, the energy released by a flare can be written as:
| (1) |
where , , and correspond to the fraction of magnetic energy released by the flare, the magnetic field strength of the starspots, and the scale length of the starspot group, respectively (Shibata et al. 2013; Notsu et al. 2013b). We here also roughly assume (the total area of the starspot group). The Equation (1) suggests that the flare energy is roughly proportional to the area of the starspot group to the power of 3/2. Using the typical values, Equation (1) can be written as:
| (2) | |||||
Solid and dashed lines in Figure 4 represent Equation (2) for , , and , , respectively.
Majority of superflares (Red filled-squares and blue small-crosses)
and almost all solar flares (black small filled-circles) are below these analytic lines.
This suggests that the upper limit of the energy released by the flare is basically
comparable to the stored magnetic energy estimated from the area of starspots.
There are, however, some superflares above these analytic lines.
These superflares would occur on the stars with low-inclination angle or stars with starspots around polar region.
In the case of such stars, the brightness variation caused by the rotation becomes small.
Hence the actual area of starspots should be larger than that estimated from the amplitude of brightness variation.
The effect of stellar inclination on Figure 4 are confirmed with spectroscopic data in Notsu et al. (2015b).
As a result, Figure 4 shows that both solar and stellar flares are caused by the release of
magnetic energy stored around spots.
This result is consistent with the magnetic reconnection model of stellar flares (e.g., Shibata & Magara 2011; Shibata & Takasao 2016).
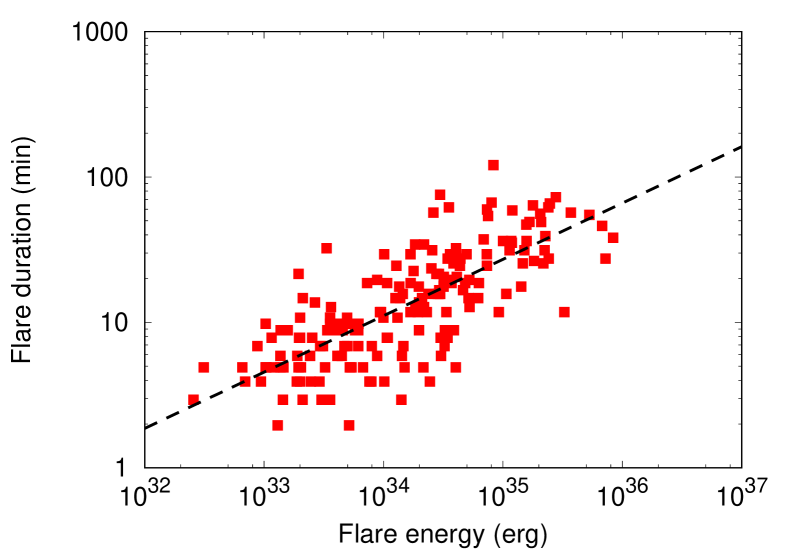
3.3 Correlation between flare duration and flare energy
Figure 5 shows the duration (e-folding decay time) of superflares as a function of the bolometric energy of flares, on the basis of Kepler 1-min (short) cadence data (Maehara et al., 2015). A linear fit for the superflares from short-cadence data in the log-log plot shows
| (3) |
where and are the duration and energy of superflares. Similar correlation between the flare duration and energy was observed in solar flares (e.g., Veronig et al. 2002, Christe et al. 2008) 111 However, there have been no well-known statistical researches discussing the correlation between the flare duration and energy with solar “white light” data, while stellar flares observed by Kepler are all “white light flares”. This is because it has been difficult to observe solar white-light flares since this requires high spatial and temporal resolution. Veronig et al. (2002) used soft X-ray fluence data observed with GOES satellite, and Christe et al. (2008) used the duration and peak flux of RESSI satellite (hard X-ray). We note here that more observations and statistical analyses of solar white-light flares are necessary for more detailed discussions. . These similarity between solar flares and superflares on solar-type stars suggests that solar flares and superflares are caused by the same physical process (i.e., reconnection).
The flare energy is related to the magnetic energy stored around the starspots, as shown in Equation (1). On the other hand, the duration of flares, especially the duration of impulsive phase of flares, is comparable to the reconnection time () that can be written as:
| (4) |
where is the Alfvn time, is the Alfvn velocity, and is the non-dimensional reconnection rate ( in the corona (Petschek, 1964)). If we assume and are not so different among solar-type stars, the duration of flares can be written as
| (5) |
from Equations (1) and (4).
This suggests that the power-law slope for the correlation
between the flare duration and flare energy is about ,
and this is comparable to the observed value of .
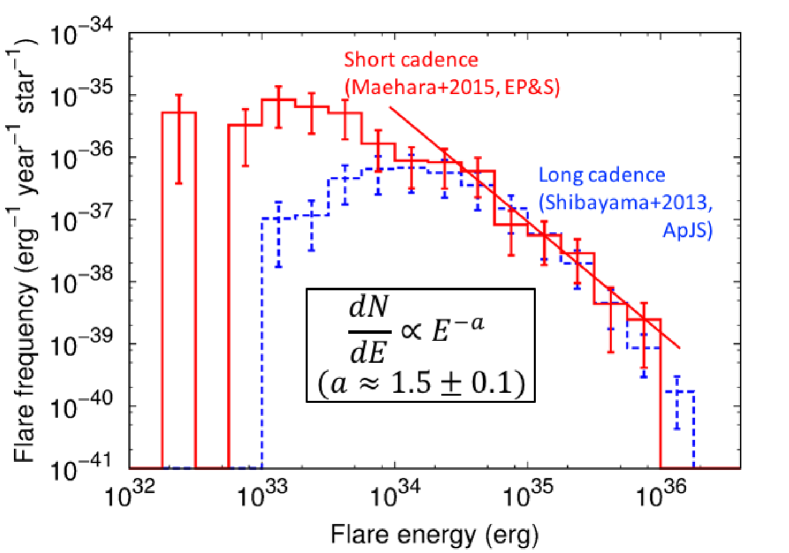
3.4 Occurrence frequency distribution of superflares
The analyses of Kepler data enabled us to discuss statistical properties of superflares
since a large number of flare events were discovered.
Figure 6 shows the occurrence frequency of superflares ()
as a function of the bolometric energy of superflares ().
Red solid histogram in Figure 6 represents the
frequency distribution of superflares on all solar-type stars derived from short-cadence data (Maehara et al., 2015)
and blue dashed histogram represents that from long-cadence data (Shibayama et al. 2013).
The frequency of flares derived from the long-cadence data is less than that from
the short-cadence data for the flare energy below erg.
This difference is caused by the detection limit of flare search method.
We can detect smaller flares more accurately with short-cadence data, which have much better time resolution,
as seen in Figures 2 (f) & (h).
In Figure 6, both frequency distributions from short- and long-cadence data are almost the same for the flare energy
between 1034 erg and 1036 erg,
and can be fitted by a power-law function ().
Using the combined data set from both short- and long-cadence data,
the power-law index is for the flare energy of erg.
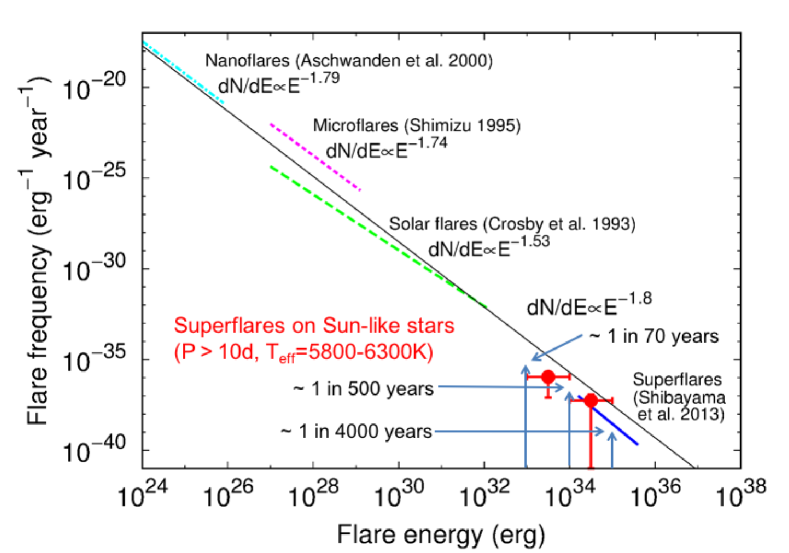
In Figure 7, we compare the frequency distribution of superflares on Sun-like stars (early G-dwarfs with days) derived from both short-cadence (red filled circles) and long-cadence (blue solid line) data with solar flares, microflares and nanoflares (dashed lines). It is remarkable to see that occurrence frequency distributions of superflares on Sun-like stars and solar flares are roughly on the same power-law line (; Shibata et al. 2013) for the wide energy range between erg and erg. This distribution suggests that average occurrence frequency of superflares on Sun-like stars with bolometric energy of erg, erg, and erg are once in years, years, and years, respectively.
3.5 Dependence of the flare energy and flare frequency on rotation period
Previous observations of solar-type stars (e.g., Pallavicini et al. 1981; Pizzolato et al. 2003; Wright et al. 2011) shows that the average coronal X-ray luminosity decreases as the rotation period increases. Just from this previous result of X-ray observations, we may possibly expect that superflare energy have a correlation with the stellar rotation and rapidly rotating stars have more energetic flares. However, Kepler data brought us new results somewhat different from this expectation, as summarized below.


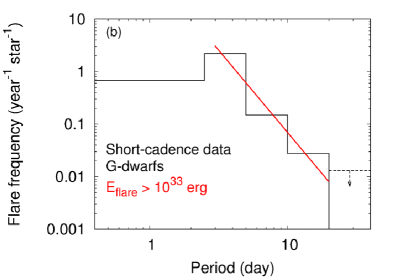
Figures 8 & 9 show the relationship between the rotation period (estimated from the brightness variation) and the feature of superflares (Notsu et al., 2013b). Figure 8 indicates that the most energetic flare observed in a given rotation period bin does not correlate with the stellar rotation period. At first glance, this is different from the expectation on the basis of X-ray observations (cf. Pizzolato et al. 2003) mentioned above. If the superflare energy can be explained by the magnetic energy stored around the starspots (as shown in Figure 4), this figure suggests that the maximum magnetic energy stored around the spot does not have a strong dependence on the rotation period. Figure 9, however, shows that the average flare frequency in a given period bin tends to decrease as the period increases to longer than a few days. The frequency is averaged from all the superflare stars in the same period bin. The frequency of superflares on rapidly-rotating stars is higher than slowly-rotating stars, and this indicates that a star evolves (and its rotational period increases), the frequency of superflares decreases (cf. Similar tendency is also shown in Davenport (2016)). We can now interpret that this correlation between rotation period and flare frequency (not flare energy) is consistent with the correlation between rotation period and average X-ray luminosity seen in previous studies. One amazing discovery from Figures 8 & 9 is that superflares (with energy comparable to erg) can occur on stars rotating as slow as the Sun ( days), even though the frequency is low (one in a few thousand years (cf. Figure 7)), compared with rapidly-rotating stars.
| All stars | Stars with confirmed planets | Stars with candidate and confirmed planets | |
|---|---|---|---|
| All solar-type stars (=53006300K, )222 In Shibayama et al. (2013), we used stellar parameters taken from the original Kepler Input Catalog (Brown et al., 2011), and the selection criteria of solar-type stars are =51006000K, . However the temperatures in Brown et al. (2011) are systematically lower by 200 K than those in Revised Kepler Input Catalog (Huber et al., 2014). In order to reduce the difference in statistical properties caused by the systematic difference in stellar temperature, here we used the selection criteria of =53006300K, . | 102551 | 1029 (1.0%) | 2131 (2.1%) |
| Solar-type superflare stars (Shibayama et al. 2013) | 279 | 1 (Kepler-491b) (0.4%) | 3 (1.1%) |
3.6 Superflare stars having exoplanets
Rubenstein & Schaefer (2000) argued that solar-type stars with a hot Jupiter-like companion are good candidates for superflare stars; i.e., the hot Jupiter may play the role of a companion star in binary stars, such as in RS CVn stars, which are magnetically very active, and produce many superflares. Schaefer et al. (2000) concluded that the Sun has never produced superflares, since there is no hot Jupiter near to our Sun. We found, however, that fraction of superflare stars having planets (in particular, close-in giant planets like hot Jupiters) are not higher than the fraction of ordinary solar-type stars having them, on the basis of Kepler data (Table 1). This suggests hot Jupiter is not a necessary condition for superflares. In addition, Shibata et al. (2013) also found that hot Jupiters do not play any essential role in the generation of magnetic flux in the star itself, if we consider only the magnetic interaction between the star and the hot Jupiter, whereas the tidal interaction remains to be a possible cause of enhanced dynamo activity, though more detailed studies would be necessary. This seems to be consistent with the above observational finding that hot Jupiter is not a necessary condition for superflares.
Acknowledgments
We are very grateful to the organizers of The Cool Stars 19 meeting. YN was supported by JSPS KAKENHI Grant Number JP16J00320 for attending this meeting.
References
- Aschwanden et al. (2000) Aschwanden, M. J., Tarbell, T. D., Nightingale, R. W., et al. 2000, ApJ, 535, 1047
- Aschwanden et al. (2014) Aschwanden, M. J., Xu, Y., & Jing, J. 2014, ApJ, 797, 50
- Balona et al. (2015) Balona, L. A., Broomhall, A.-M., Kosovichev, A., et al. 2015, MNRAS, 450, 956
- Benz (2008) Benz, A. O. 2008, Living Rev. Sol. Phys, 5, 1
- Brown et al. (2011) Brown, T.M., Latham, D. W., Everett, M. E., & Esquerdo, G. A. 2011, ApJ, 142, 112
- Christe et al. (2008) Christe, S., Hannah, I. G., Krucker, S., McTiernan, J., & Lin, R. P. 2008, ApJ, 677, 1385
- Crosby et al. (1993) Crosby, N. B., Aschwanden, M. J., & Dennis, B. R. 1993, Sol. Phys., 143, 275
- Davenport (2016) Davenport, J. R. A. 2016, ApJ, in press (arXiv:1607.03494)
- Emslie et al. (2012) Emslie, A. G., Dennis, B. R., Shih, A. Y., et al. 2012, ApJ, 759, 71
- Gershberg (2005) Gershberg, R. E. 2005, Solar-Type Activity in Main-Sequence Stars (Berlin: Springer)
- Gilliland et al. (2010) Gilliland, R. L., Jenkins, J. M., Borucki, W. J., et al. 2010, ApJ, 713, L160
- Honda et al. (2015) Honda, S., Notsu, Y., Maehara, H., et al. 2015, PASJ, 67, 85
- Huber et al. (2014) Huber, D., Silva Aguirre, V., Matthews, J. M., et al. 2014, ApJS, 211, 2
- Karoff et al. (2016) Karoff, C., Knudsen, M. F., De Cat, P., et al. 2016, Nature Communications, 7, 11058
- Koch et al. (2010) Koch, D. G., Borucki, W. J., Basri, G., et al. 2010, ApJ, 713, L79
- Kopp et al. (2005) Kopp, G., Lawrence, G., & Rottman, G. 2005, Sol. Phys., 230, 129
- Lanza et al. (2003) Lanza, A. F., Rodonò, M., Pagano, I., Barge, P., & Llebaria, A. 2003, A&A, 403, 1135
- Maehara et al. (2012) Maehara, H., Shibayama, T., Notsu, S., et al. 2012, Nature, 485, 478
- Maehara et al. (2015) Maehara, H., Shibayama, T., Notsu, Y., et al. 2015, Earth, Planets, and Space, 67, 59
- Nogami et al. (2014) Nogami, D., Notsu, Y., Honda, S., et al. 2014, PASJ, 2014, 66, L4
- Notsu et al. (2013a) Notsu, S., Honda, S., Notsu, Y., et al. 2013a, PASJ, 65, 112
- Notsu et al. (2013b) Notsu, Y., Shibayama, T., Maehara, H., et al. 2013b, ApJ, 771, 127
- Notsu et al. (2015a) Notsu, Y., Honda, S., Maehara, H., et al. 2015, PASJ, 67, 32
- Notsu et al. (2015b) Notsu, Y., Honda, S., Maehara, H., et al. 2015, PASJ, 67, 33
- Pallavicini et al. (1981) Pallavicini, R., Golub, L., Rosner, R., et al. 1981, ApJ, 248, 279
- Petschek (1964) Petschek, H. E. 1964, “Magnetic Field Annihilation", in The Physics of Solar Flares, Proceedings of the AAS-NASA Symposium held 28-30 October, 1963 at the Goddard Space Flight Center, Greenbelt, MD, (Ed.) Hess, W.N., vol. SP-50 of NASA Special Publications, pp. 425-439, NASA
- Pizzolato et al. (2003) Pizzolato, N., Maggio, A., Micela, G., Sciortino, S., & Ventura, P. 2003, A&A, 397, 147
- Priest (1981) Priest, E. R. 1981, Solar Flare Magnetohydrodynamics (New York; Gordon and Breach Science Publishers)
- Pugh et al. (2016) Pugh, C. E., Armstrong, D. J., Nakariakov, V. M., & Broomhall, A.-M. 2016, MNRAS, 459, 3659
- Rubenstein & Schaefer (2000) Rubenstein, E. P., & Schaefer, B. E. 2000, ApJ, 529, 1031
- Sammis et al. (2000) Sammis, I., Tang, F., & Zirin, H. 2000, ApJ, 540, 583
- Schaefer et al. (2000) Schaefer, B. E., King, J. R., & Deliyannis, C. P. 2000, ApJ, 529, 1026
- Shibata & Magara (2011) Shibata, K., & Magara, T. 2011, Living Rev. Sol. Phys, 8, 6
- Shibata & Takasao (2016) Shibata, K., & Takasao, S. 2016, Astrophysics and Space Science Library, 427, 373
- Shibata et al. (2013) Shibata, K., Isobe, H., Hiller, A., et al. 2013 PASJ, 65, 49
- Shibayama et al. (2013) Shibayama, T., Maehara, H., Notsu, S., et al. 2013 ApJS, 209, 5
- Shimizu (1995) Shimizu, T. 1995 PASJ, 47, 251
- Veronig et al. (2002) Veronig, A., Temmer, M., Hanslmeier, A., Otruba, W., & Messerotti, M. 2002, A&A, 382, 1070
- Wright et al. (2011) Wright, N. J., Drake, J. J., Mamajek, E. E., & Henry, G. W. 2011, ApJ, 743, 48