2S 1553542: a Be/X-ray binary pulsar on the far side of the Galaxy
Abstract
We report the results of a comprehensive analysis of X-ray (Chandra and Swift observatories), optical (Southern African Large Telescope, SALT) and near-infrared (the VVV survey) observations of the Be/X-ray binary pulsar 2S 1553542. Accurate coordinates for the X-ray source are determined and are used to identify the faint optical/infrared counterpart for the first time. Using VVV and SALTICAM photometry, we have constructed the spectral energy distribution (SED) for this star and found a moderate NIR excess that is typical for Be stars and arises due to the presence of circumstellar material (disk). A comparison of the SED with those of known Be/X-ray binaries has allowed us to estimate the spectral type of the companion star as B1-2V and the distance to the system as kpc. This distance estimation is supported by the X-ray data and makes 2S 1553542 one of the most distant X-ray binaries within the Milky Way, residing on the far side in the Scutum-Centaurus arm or even further.
keywords:
stars: individual: 2S 1553542 – X-rays: binaries.1 Introduction
Determining the nature of Galactic X-ray sources through their optical counterparts and measurements of their distance is key not only in the study of individual sources, but also in population studies of different classes of objects. In the case of X-ray emission from a compact object (namely an X-ray binary) the former allows one to understand physical processes near the compact object. Only a good knowledge of the optical counterparts to sources of X-ray emission allows testing of different theoretical models of the emission mechanisms and accretion processes. In turn, properties of different populations of X-ray sources in our and other galaxies contain information about fundamental physical mechanisms responsible for their formation and evolution and about properties of the host galaxy itself.
Distance estimations can be made relatively straightforwardly for X-ray sources in other galaxies, but is a non-trivial task in our own galaxy. There are at least two problems to contend with: the high density of stars, which complicates the process of optical identification, and the large and variable interstellar absorption, which complicates measurements of different properties of the source, including its distance.
These difficulties have led to the situation where a significant number of Galactic X-ray sources are still unclassified or have no reliable distance measurements (Liu et al., 2006, 2007).
In this work we utilize high quality X-ray, optical and near-infrared (NIR) data to localize and identify the poorly studied transient X-ray pulsar 2S 1553542. It was discovered in 1975 by the SAS-3 observatory (Walter, 1976). Later a strong coherent variability, with a period of 9.3 s, was found (Kelley, Ayasli, & Rappaport, 1982) in the source light curve. Subsequent observations of 2S 1553542 revealed strong outbursts in 2007 (Krimm et al., 2007) and most recently in 2015 (Sugizaki et al., 2015). Observations with the NuSTAR observatory and Fermi/GBM monitor during the 2015 outburst led Tsygankov et al. (2016) to the discovery of a cyclotron absorption line in the source spectrum at keV and to improve the accuracy of the binary parameters. Moreover these authors also estimated the distance to the system kpc.
The possible nature of 2S 1553542 as a pulsating Be/X-ray binary system was first suggested on the basis on its transient activity (Kelley, Rappaport & Ayasli, 1983) and X-ray spin modulation. However, no optical or infrared counterpart had been directly determined until now. This made 2S 1553542 one of the first transient X-ray binaries to be discovered with a probable Be-companion, though the confirmation of this and the distance to the system were still to be confirmed. Moreover, the X-ray behaviour of the source is quite unusual – in particular, the source never displays type I outbursts. Okazaki & Negueruela (2001) proposed the model of the truncated disc in which such a behaviour is naturally explained for systems with a low eccentricity. Indeed, current measurements of Tsygankov et al. (2016) revealed a very low eccentricity in this system .
Based on recent data from the Chandra and Swift observatories, Southern African Large Telescope (SALT) and the VVV survey, we have measured for the first time an accurate position for the X-ray pulsar 2S 1553542, leading to the identification of its infrared counterpart and an estimation of its distance.
2 X-ray observations and source position
2.1 Observations and data reduction
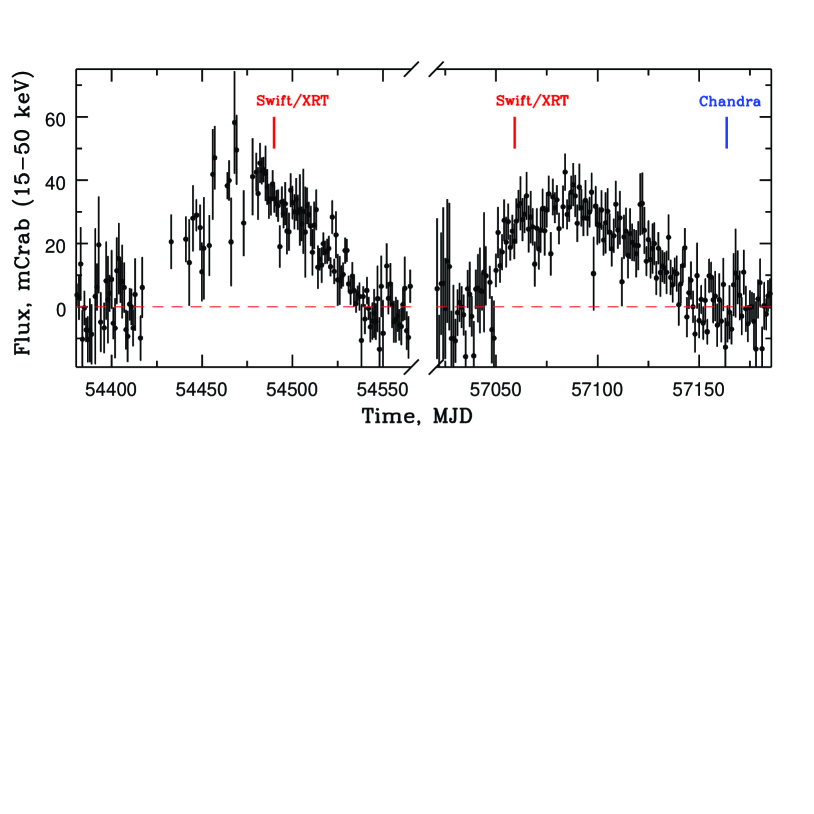
The source light curve obtained with the Swift/BAT telescope in the keV energy band for two outbursts is shown in Fig.1. It is seen that both outbursts are quite similar: the duration is about 3 months and the maximum intensity around mCrab in the keV energy band. The outburst light curves, duration and absence of orbital modulation are all indications that they are type II outbursts.
Observations in soft X-rays were performed twice with the Swift/XRT telescope (Obs.IDs 00031096001 and 00031096002, red lines in Fig.1) and once with the ACIS instrument onboard the Chandra observatory (ObsId. 17662, blue line in Fig.1). Both XRT observations were carried out in the Photon Counting (PC) mode with a relatively high source flux that led to pile-up in the data. It was taken into account in the subsequent analysis according to the XRT Data Analysis threads111http://www.swift.ac.uk/analysis/xrt/index.php. The data collected by the ACIS instrument with a total exposure of ks were reduced with the standard software package CIAO 4.7222http://cxc.harvard.edu/ciao/ with CALDB v4.6.5. Note, that these data did not suffer from pile-up.
2.2 Refinement of the source coordinates
As mentioned above, the optical companion of 2S 1553542 is not yet known, mainly because of the lack of an accurate localization of the X-ray source. The Swift/XRT telescope determined the position of 2S 1553542 during the 2007-2008 outburst to be (J2000): R.A.= 15h57m47.75s, Dec.= -54∘24′52.4′′ with a 3.5 arc-second error (Boyd et al., 2008). This was a significant improvement on the originally determined error circle of 35 arc-seconds (SAS-3 aperture size), but nevertheless did not lead to the determination of the optical counterpart.
To determine the position of 2S 1553542 with a higher accuracy, we triggered a TOO observation with the Chandra observatory on May 21, 2015 (MJD 57163.68). Using the celldetect/CIAO procedure, the pulsar coordinates were determined as R.A.= 15h57m48.3s, Dec.= -54∘24′53.1′′ (J2000) with ′′ uncertainty (90%). These coordinates differ by more than 6′′ from ones mentioned in the SIMBAD database and are about 4.8′′ from those reported by Boyd et al. (2008).
To clarify the situation and to understand the reasons for this difference, we re-analysed both the archival Swift/XRT data (ObsID. 00031096001 from Jan 24, 2008, MJD 54489.84) and the new data obtained during the current outburst on Feb 6, 2015 (ObsID. 00031096002, MJD 57059.13). We calculated the enhanced source position333http://www.swift.ac.uk/user_objects/index.php, where the astrometry is derived using field stars in the UVOT images (Goad et al., 2007; Evans et al., 2009). As a result, the best-fit source position was found as R.A.= 15h57m48.35s, Dec.=-54∘24′52.7′′ (J2000, error radius 1.4′′, 90% confidence), which is in good agreement with the Chandra measurements.
Thus we have determined, for the first time, accurate coordinates of 2S 1553542. These coordinates were then used to search for its optical counterpart.
3 Optical/IR Counterpart
3.1 SALT observations and data reduction
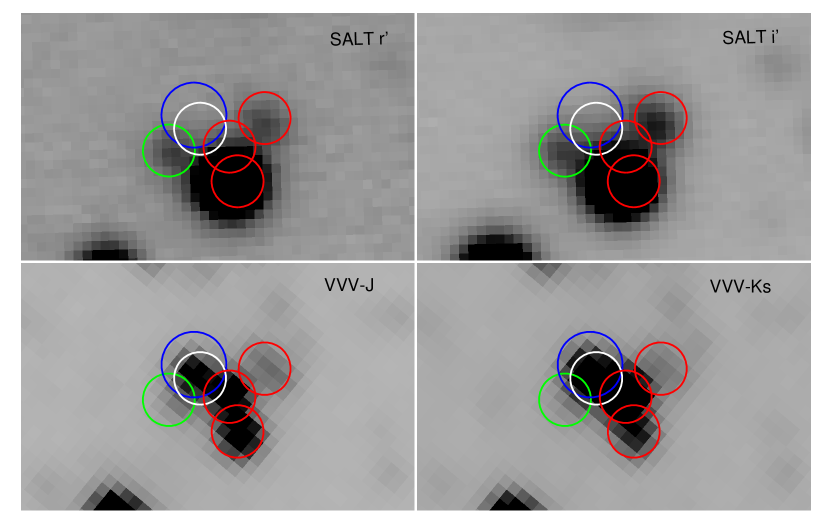
In order to locate the optical counterpart of 2S 1553542, observations were taken of the region indicated by the X-ray error circles from the Swift and Chandra observations with the Southern African Large Telescope (SALT) (Buckley, Swart & Meiring, 2006) using the imaging camera, SALTICAM (O’Donoghue et al., 2006). The first observation was taken on 11 Feb 2015 using and filters with 100 and 200 s exposures, respectively. This was followed by a spectroscopic observation on 22 Feb 2015 of the star ′′ SE of the Swift position, reported by Boyd et al. (2008) (the brightest star in the upper panels of Fig. 2), using SALT/RSS (Burgh et al., 2003; Buckley et al., 2008) with the PG900 grating covering the range 39206990, at an average spectral resolution of 960, with a 1.5 arcsec slit. A single 1300 s exposure revealed a blue star with no emission features and no other compelling signatures indicative of a HMXB optical counterpart. Following from the improved Swift position and the subsequent Chandra observation, an improved positional determination decreased the size of the error circle by a factor of 3.5 in diameter and moved it ′′ to the east, which then formally excluded the star previously observed.
A second, deeper, SALTICAM imaging observation was carried out on 15 Aug 2015 following the determination of the revised position. Five repeat cycles of exposures in the and filters, of 120 s, 120 s and 600 s, respectively, were obtained, plus an additional 120 s -band exposure. These observations were mostly taken in good seeing (1 arcsec), with some degradation for the last few exposures, and in photometric conditions. Fitted star image profiles typically had a FWHM in the range 1.21.4′′. A faint star was detected near the edge of the new Chandra error circle, 2′′ NE of the previously observed star (Fig. 2, green circle), which we term the SALTICAM star.
Photometry of star images in the vicinity of 2S 1553542 was performed in IRAF using standard routines in the DAOPHOT package. Given the reasonably crowded field and the close proximity of the target to a brighter star, we used PSF fitting routines instead of aperture photometry. After several trial fits, we found that a Moffat function better modelled the stellar profiles and so was used to produce the final instrumental magnitudes. Calibration of the instrumental magnitudes was done using stellar catalogues provided by the SuperCOSMOS Sky Survey (Hambly et al., 2001). The catalogue data were positionally matched with the SALTICAM sources using a matched error of 1′′. The and magnitudes of the resulting matches were plotted and fit with a straight line function with gradient set to unity. The intercept was used as a calibration zero-point and was added to the instrumental magnitude of the target to produce the final calibrated magnitudes of the SALTICAM star, namely:
Note, that there is likely an additional systematic uncertainty of about 0.1 mag due to the scatter in the data used to measure the zero-point offset.
To correct for interstellar extinction we adopt the standard relationship (Predehl & Schmitt, 1995) and the measured column density, namely cm-2 (see Sect.4 and Tsygankov et al., 2016). This gives an , and assuming the interstellar absorption law given in Cardelli et al. (1989), leads to and values of 11.3 and 8.7, respectively.
We then derive the following corrected magnitudes and colours for the SALTICAM star:
The colour was derived using the relevant transformations from the Sloan to the Johnson-Cousins systems (Lupton, 2005). Note, that all BeXRBs have spectral types earlier than B2-B3 (Negueruela, 1998; Negueruela & Coe, 2002), with colours redder than the results of our photometry. Together with the upper limits of the near IR magnitudes (see next section), this puts in doubt the connection between 2S 1553542 and the SALTICAM star.
3.2 Analysis of the VVV Survey data
In order to further examine the validity of this potential counterpart to 2S 1553542 and to see if the SALTICAM star is also visible in the near infrared, we downloaded the VVV images for this region. These VVV Survey data were obtained in frames of the ESO programme 179.B-2002, with the VIRCAM instrument, using filters (tile d_061 with 80 s exposure for each filter). Data were obtained thought the https://vvvsurvey.org service, which provides access to reduced or fully calibrated data.
Surprisingly, we found there to be a total of 5 stars in the immediate vicinity of the X-ray source position (Fig. 2, bottom panels) in the -bands image (there are only 3 in the image). To find the correct association between the X-ray source and NIR star, photometry was performed in the same way as described above for the SALTICAM images. The star from the photometric catalogue with a position closest to the Chandra position was chosen as the most likely counterpart. Its coordinates are: R.A.= 15h57m48.28s, Dec.=-54∘24′53.5′′ (J2000, error radius 0.07′′, 90% confidence), just ′′ from the Chandra coordinates. The calibrated magnitudes for this star are:
.
Before constructing a Spectral Energy Distribution (SED) of the proposed counterpart, we need to be sure that the star identified in the VVV images is the most probable counterpart to the X-ray source. On inspection of the images and positions (see Fig.2), we found that not only are the SALTICAM and VVV sources positionally inconsistent with each other (outside of the expected errors from our astrometry – the RMS from the SALTICAM analysis is 0.58′′, averaged over both frames), but the VVV source is within 0.5′′ of the Chandra position. This, along with the colour derived above, suggests that the SALTICAM and VVV sources are in fact separate stars, and that the VVV star is more likely to be the correct counterpart. Further to this, we find that there is no source detected in the VVV image positionally consistent with the SALTICAM source, and vice versa.
We then proceeded by treating the photometry of the two stars separately in the subsequent analysis of the SEDs and distance determinations.
3.3 SED and distance estimations
To derive the SED for each star, we apply upper limits derived from each image. Put simply, we assume that the optical star in the SALTICAM images is not detected in the VVV images, and thus we apply VVV upper limits to this star. These values were available in the headers of the downloaded VVV images. Likewise, we assume that the VVV star within the Chandra error circle was not detected in the SALTICAM images, and thus we apply formal and limits to this star. These were derived by plotting the brightness distribution of all sources in each band, and checking where it turns over, and thus have a statistical uncertainty, of up to 0.5 mags.
These limits were reddening corrected in the same manner as done previously (as above, we used the Cardelli et al. (1989) formulae to determine the interstellar absorption), resulting in interstellar reddening corrected SEDs for both stars. All magnitudes (apparent, de-reddened, absolute for the distances 15 and 20 kpc) as well as appropriate values are presented in Table 1, where (l) denotes an upper limit.
| Band, | SALTICAM star mags | VVV star mags | |||||||
|---|---|---|---|---|---|---|---|---|---|
| Wavelength (nm) | app | dered | 15 kpc | 20 kpc | app | dered | 15 kpc | 20 kpc | |
| , 612 | 11.34 | 21.78 | 10.45 | -5.44 | -6.06 | 23.6(l) | 12.26(l) | -3.62(l) | -4.24(l) |
| , 744 | 8.67 | 20.77 | 12.10 | -3.78 | -4.41 | 22.1(l) | 13.43(l) | -2.45(l) | -3.08(l) |
| , 909 | 6.02 | 20.93(l) | 14.91(l) | -0.97(l) | -1.60(l) | 18.59 | 12.57 | -3.31 | -3.94 |
| , 1020 | 5.00 | 20.40(l) | 15.40(l) | -0.48(l) | -1.11(l) | 17.18 | 12.18 | -3.70 | -4.33 |
| , 1250 | 3.60 | 20.43(l) | 16.83(l) | 0.95(l) | 0.38(l) | 15.78 | 12.18 | -3.70 | -4.33 |
| , 1630 | 2.35 | 19.82(l) | 17.47(l) | 1.59(l) | 0.96(l) | 14.46 | 12.11 | -3.77 | -4.40 |
| , 2150 | 1.51 | 19.43(l) | 17.92(l) | 2.04(l) | 1.42(l) | 13.45 | 11.94 | -3.94 | -4.56 |
It is immediately obvious that we have two very different potential counterparts. To determine which SED is most like an early type Be star (as expected from X-ray data), we converted the apparent magnitudes and limits above into absolute magnitudes and plotted them against template SEDs for B0V and B2V type stars. This result is presented in Fig.3. Note, that these calculations were made under an assumption of a distance to the system of 15 kpc. Such a large distance is expected from the previous analysis of X-ray data of the source (Tsygankov et al., 2016). Below we consider this question based on the optical data. It is clearly seen from Fig.3 that the source detected in the VVV images has an SED much more similar in shape to an early type B star in comparison with the SALTICAM star. Moreover, a moderate infrared excess likely due to a circumstellar disk around the Be star is also apparent from the SED shape.
Confirmation of this hypothesis came after adding some known BeXRBs to the figure. Photometry and distance estimates were found for EXO 2030+375, GX 304-1 and Cep X-4 (Coe et al., 1997; Riquelme, Torrejon & Negueruela, 2012; Reig, 2014). These were converted to absolute magnitudes and plotted with the candidate counterparts in Fig.3. One can see that all three BeXRBs are similar in shape and magnitude to the VVV source, lying between the B2 and B0 templates with moderate NIR excesses from the circumstellar material.
We looked at alternative interpretations for the VVV star in terms of spectral type, distance and reddening, but no satisfactory alternative could be determined. While it was possible to have a closer cooler star with similar IR apparent magnitudes, the optical magnitudes of stars would be many magnitudes brighter than the upper limits of the VVV star imposed by the SALTICAM observations. Only for unrealistic combinations of close distance ( pc) and high reddening () could we approximate the observed magnitudes.
The approach we have made in trying to identify the likely nature of the two possible optical counterparts is as follows. Firstly, we have constructed a spreadsheet consisting of the absolute magnitudes of stars of varying spectral type and luminosity class considered appropriate either as the bona fide optical counterpart of 2S 1553542 or a potential field star, which simply happen to be inside the error circle, unassociated with the X-ray source. For the former we considered stars of spectral type B2V to O8V, while for the latter we considered stars of a range of spectral types, including M dwarfs and white dwarfs, as potential field stars.
We derived the appropriate values for each of the bandpasses () using the formulae in Cardelli et al. (1989). These empirical relations are somewhat of a simplification for the true interstellar extinction, but for the purposes of estimating SEDs, we consider they are adequate. With the determined from (Predehl & Schmitt, 1995), the apparent magnitudes were then determined for a given assumed distance. For a star considered as a potential optical counterpart to 2S 1553542, we fixed the observed value derived earlier and adjusted the distance such that the calculated apparent (reddened) magnitude matched the measured magnitudes
In the case of a field star unrelated to 2S 1553542, we allowed both and distance to be variables to investigate if we could obtain self consistent magnitudes and colours.
As can be seen in Fig. 3, the SALTICAM star is too blue to be consistent with a Be star of spectral type earlier than B2V, which is why we discount it as the likely optical counterpart of 2S 1553542. We investigated the potential nature of the star by looking at the absolute magnitudes and colours of various luminosity class V stars (Pecaut & Mamajek, 2013) and white dwarfs, comparing them to the observed and magnitudes and the upper limits of the magnitudes from the VVV survey. The conclusion from this investigation was that no class V star is able to match the observations. Only for spectral types earlier than G0 are the intrinsic colours consistent with the observations, but the apparent magnitudes would place such a star at a distance of 20 kpc and the interstellar reddening would make the star relatively brighter at IR magnitudes, inconsistent with the VVV upper limits. Cooler spectral types (K or M) would reduce the distance, but even for unreddened M-dwarfs, their colours are much too red to be consistent with the observations. The only possibility we could find to explain the observations is if the SALTICAM star is a nearby ( 100 pc) cool white dwarf, whose (unreddened) magnitude and colours (Chabrier et al., 2000) would be consistent with the observations.
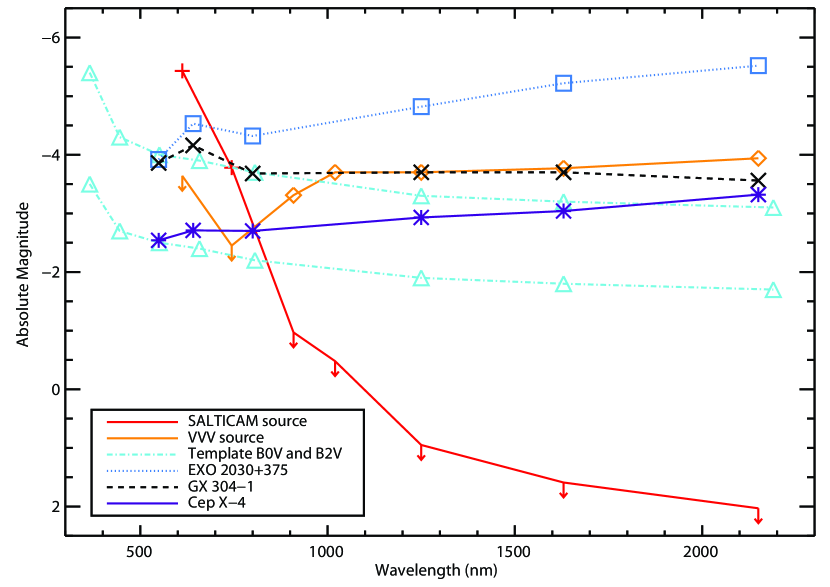
A precise distance estimate to the source is difficult, given only optical limits are placed by the SALTICAM photometry of the VVV star. Figure 3 shows where the SED of the source would sit against the absolute magnitudes of B0V and B2V template stars assuming a real distance of 15 kpc. Assuming that the most likely spectral type of the source is between B0-B2 (given the BeX nature of the source), we expect a distance of less than 15 kpc to be unlikely. Conversely, placing the source SED onto Fig. 3 after assuming a real distance of 20 kpc (see Table 1) is consistent with a B1V star, but is still lower than a B0V star. Thus, we also tentatively suggest that a B0V spectral type is unlikely as the distance would put the source outside of the Galaxy.
The galactic coordinates of 2S 1553542 are and , which places 2S 1553542 on the other side of the Galaxy in the Scutum-Centaurus arm or even further in the Sagittarius arm (Urquard et al., 2014).
4 X-ray spectroscopy
| Parameter | Instrument, MJD | ||
| XRT | XRT | Chandra | |
| 54489.84 | 57059.13 | 57163.68 | |
| , | (fix) | ||
| , keV | |||
| (d.o.f) | |||
| , | (fix) | ||
| Photon index | |||
| (d.o.f) | |||
| Flux (0.5-10 keV) | |||
| erg s-1 cm-2 | |||
The detailed analysis of the broadband (3-79 keV) spectrum of 2S 1553542 was recently performed by Tsygankov et al. (2016) using data from the NuSTAR observatory. It was shown that the spectral continuum contains two components – a thermal black body emission at low energies and a power law with an exponential cutoff at higher energies. Additionally, a cyclotron absorption line at an energy of keV and a fluorescent iron emission line at 6.4 keV were detected (Tsygankov et al., 2016).
The working energy bands of Swift/XRT and Chandra have an upper bound near keV, and the effective area of both of them are significantly reduced at energies above 7-8 keV444http://swift.gsfc.nasa.gov/about_swift/xrt_desc.htm555http://cxc.harvard.edu/proposer/POG/html/chap6.html. Therefore, we found it unnecessary to use such a complex model to fit our data.
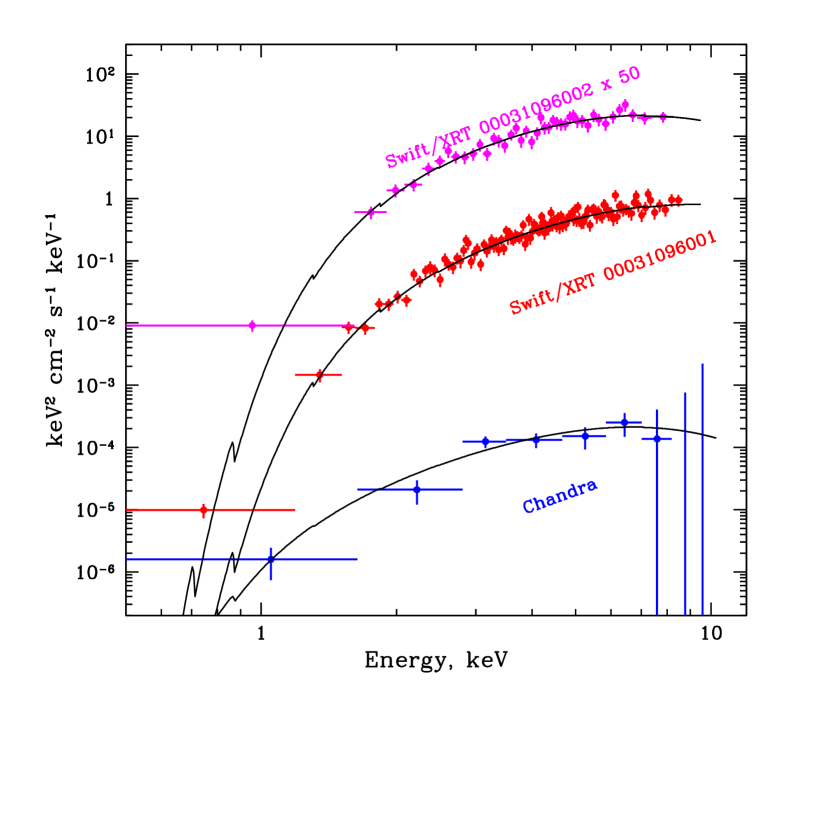
We found that all three source spectra in the 0.5-10 keV energy band can be well approximated by either absorbed black body emission (phabs*bbodyrad model in the XSPEC package) or an absorbed power law (phabs*powerlaw model in the same package). The corresponding best-fit parameters are presented in Table 2 together with measured fluxes and values. Note that the former model describes the spectra slightly better. This is due to the fact that in the spectrum of 2S 1553542 there is a relatively low exponential cutoff at keV (Tsygankov et al., 2016). The inclusion of this parameter in the model formally improves the fit and reduces the absorption value, but does not provide a better determination for the parameters due to the limited energy band of the instruments. It is shown in Table 2 that the spectral parameters (e.g., temperature and absorption) are quite similar for all observations. The measured absorption value in the high state is in good agreement with the NuSTAR results (Tsygankov et al., 2016) and only slightly higher than the one of the galactic interstellar absorption in the direction of 2S 1553542, cm-2 (Kalberla et al., 2005). The absorption value in the low state is determined poorly due to insufficient statistics of the Chandra data. The value varied from to cm-2 depending on the spectral model, but due to large uncertainties it agrees with the interstellar value at the level. Therefore, we fixed to the interstellar value and fitted only the temperature or power law index and corresponding normalization. Note, that the fixing of at cm-2 practically does not significantly change results of the approximation.
The inclusion of an iron emission line didn’t improve the goodness of the fit for the first XRT observation and only improved it insignificantly for the second. Therefore, we obtain only upper limits () for the iron line equivalent width in these observations: 116 and 390 eV, respectively (the line energy and width were fixed at 6.4 and 0.1 keV). X-ray spectra of 2S 1553542 are shown in Fig.4 along with best-fit models in the form of the absorbed black body emission.
Of particular interest is the observation with the Chandra observatory, during which the source flux was almost 4 orders of magnitude lower than that near the peak of the outburst. Observations of very faint X-ray transients can be used for testing different models of the neutron star cooling (see e.g. Wijnands et al., 2013) and its emission in the quiescent state. In particular, based on the spectral shape, it can be determined whether the source is still accreting at low level or whether the heated neutron star is observed. Unfortunately, the statistics of the Chandra observation are not sufficient to distinguish between thermal or non-thermal emission of 2S 1553542 in the low state (Table 2). Additionally, the temporal resolution of the ACIS instrument (about 3.2 sec) makes detection of the 9.3 s spin period in 2S 1553542 very difficult, particularly with so few counts.
5 Conclusions
In this paper we have used Chandra and Swift/XRT data to accurately determine the coordinates of the long known, but poorly studied, transient X-ray pulsar 2S 1553542 for the first time.
The subsequent optical observations with the SALT telescope and a comprehensive analysis of the VVV survey data led to the identification of its likely infrared counterpart, whose spectral energy distribution is consistent with a Be-star, as expected from its previous classification as a BeXRB with an accreting X-ray pulsar. Moreover, a comparison of the measured SED with those of known Be/X-ray binaries demonstrates the latter are similar and has allowed us to estimate the spectral type of the 2S 1553542 companion star as B1-2V and the distance to the system as kpc. This value agrees well with the independent estimations of kpc from the temporal properties of the pulsar (Tsygankov et al., 2016).
These distance estimates place 2S 1553542 in the Scutum-Centaurus arm, on the far side of the Galaxy from the Sun, or even further, depending on the possible spectral type of its companion star. This result can be considered as the first reliable distance determination to 2S 1553542 and, for an outlying Galactic object, makes 2S 1553542 one of the most distant Galactic high-mass X-ray binaries known. We note that estimations of distances to other distant Galactic sources have, as a rule, quite large uncertainties and still require additional confirmations (see, e.g., Tsygankov & Lutovinov, 2005; Shaw et al., 2009; Karasev et al., 2010; Pellizza et al., 2011). In turn, the determination of distances to high-mass X-ray binaries at the furthest regions of the Galaxy, behind the Galactic Center, is very important for determining the space density of such objects (Lutovinov et al., 2013).
The measurement of the distance to 2S 1553542 ( kpc) has allowed us to estimate a lower limit to its unabsorbed luminosity near the outburst maximum as erg s-1 and in the faint state erg s-1, from the Swift/XRT and Chandra data, respectively. Taking into account that the ratio between the X-ray bolometric source flux and its flux in the 0.5-10 keV energy band is about 2 (from the analysis of the source broadband spectrum, obtained by NuSTAR and our results, which demonstrate that its spectral shape is not dependent on the luminosity) we can estimate a lower limit to the maximum (bolometric) X-ray luminosity of the source erg s-1. The value erg s-1, obtained for a distance of 20 kpc, is comparable with that measured for other bright Be/X-ray binary transients such as V 0332+53 and 4U 0115+63, and implies that the observed outbursts from 2S 1553542 are Type II in nature. The corresponding source luminosity in quiescence, namely erg s-1 is high enough for testing different models for the low accretion regime and neutron star cooling scenario, should one obtain sufficiently long exposures in the faint X-ray state.
Acknowledgments
This research has made use of Chandra data and software provided by the Chandra X-ray Center in the application package CIAO. We also used of data supplied by the UK Swift Science Data Centre at the University of Leicester. The optical observations were undertaken with SALT Directors Discretionary Time under programs 2014-2-DDT-004, 2014-2-DDT-005 and 2015-1-DDT-004, for which we are grateful. The obtained results are also based on data products from VVV Survey observations made with the VISTA telescope at the ESO Paranal Observatory under programme ID 179.B-2002. AL, DB acknowledge support by the bilateral Russian-South African grant RFBR 14-02-93965. AL acknowledges support from the Dynasty Foundation and grant NSh-6137.2014.2. DB acknowledges support through the National Research Foundation of South Africa. LJT acknowledges support from the Claude Leon Foundation. We also especially thank to Ignacio Negueruela, who was a referee of this paper, for the very important comments and suggestions to use the VVV data. LJT would like to thank Petri Vaisanen for useful discussions on SALTICAM calibrations and photometric limits.
References
- Allen (1973) Allen, C.W., 1973, Astrophysical Quantities, Athlone Press.
- Boyd et al. (2008) Boyd P. T., Still M., Kennea J., Krimm H. A., 2008, ATel, 1371, 1
- Buckley, Swart & Meiring (2006) Buckley D.A.H., Swart G. & Meiring J., 2006, SPIE, 6267, 32
- Buckley et al. (2008) Buckley D.A.H., Barnes S.L., Burgh E.B., et al. 2008 SPIE, 7014, 07
- Burgh et al. (2003) Burgh E.B., Nordsieck K.H., Kobulnicky H.A., et al. 2003, SPIE, 4841, 1463
- Cardelli et al. (1989) Cardelli J.A., Clayton G.C., Mathis J.S., 1989, ApJ, 345, 245
- Chabrier et al. (2000) Chabrier G., Brassard P., Fontaine G., Saumon D., 2000, ApJ, 543,216
- Coe et al. (1997) Coe M.J., Buckley D.A.H., Fabregat J., Steele L.A., Still M.D., Torrejon J.M., 1997, A&A Suppl. Ser., 126, 237
- Goad et al. (2007) Goad M., et al. 2007, A&A, 476, 1401
- Evans et al. (2009) Evans P., et al. 2009, MNRAS, 397, 1177
- Hambly et al. (2001) Hambly N.C., MacGillivray H.T., Read M.A., et al. 2001, MNRAS, 326, 1279
- Karasev et al. (2010) Karasev D., Lutovinov A., Burenin R., 2010, MNRAS, 409, L69
- Kalberla et al. (2005) Kalberla P., Burton W., Hartmann D., Arnal E., Bajaja E., Morras R., Pöppel W., 2005, A&A, 440, 775
- Kelley, Ayasli, & Rappaport (1982) Kelley R. L., Ayasli S., Rappaport S., 1982, IAUC, 3667, 3
- Kelley, Rappaport & Ayasli (1983) Kelley R. L., Rappaport S., Ayasli S., 1983, ApJ, 274, 765
- Krimm et al. (2007) Krimm H. A., et al., 2007, ATel, 1345, 1
- Liu et al. (2006) Liu Q. Z., van Paradijs J., van den Heuvel E., 2006 A&A, 455, 1165
- Liu et al. (2007) Liu Q. Z., van Paradijs J., van den Heuvel E., 2007 A&A, 469, 807
- Lupton (2005) Lupton, R., 2005, https://www.sdss3.org/dr8/algorithms /sdssUBVRITransform.phpLupton2005
- Lutovinov et al. (2013) Lutovinov A. A., Revnivtsev M. G., Tsygankov S. S., Krivonos R. A., 2013, MNRAS, 431, 327
- O’Donoghue et al. (2006) O’Donoghue D., Buckley D.A.H., Balona L., et al. 2006, MNRAS, 372, 151
- Okazaki & Negueruela (2001) Okazaki A., Negueruela I., 2001, A&A, 377, 161
- Negueruela (1998) Negueruela I., 1998, A&A, 338, 50
- Negueruela & Coe (2002) Negueruela I., Coe M.J., 2002, A&A, 385, 517
- Pahari & Pal (2012) Pahari M., Pal S., 2012, MNRAS, 423, 3352
- Pecaut & Mamajek (2013) Pecaut M.J., Mamajek E.E., 2013, ApJS, 208, 9
- Pellizza et al. (2011) Pellizza L., Chaty S., Chisari N., 2011, A&A, 526, A15
- Predehl & Schmitt (1995) Predehl P., Schmitt, J. H. M. M., 1995, A&A, 293, 889
- Reig (2014) Reig P., Blinov D., Papadakis I., Kylafis N., Tassis K., 2014, MNRAS, 445, 4235
- Riquelme, Torrejon & Negueruela (2012) Riquelme M.S., Torrejon J.M., Negueruela I., 2012, A&A, 539, A114
- Shaw et al. (2009) Shaw S., Hill A., Kuulkers E., Brandt S., Chenevez J., Kretschmar P., 2009, MNRAS, 393, 419
- Sugizaki et al. (2015) Sugizaki M., et al., 2015, ATel, 7018, 1
- Tsygankov & Lutovinov (2005) Tsygankov S.S., Lutovinov A.A., 2005, Astron. Lett., 31, 88
- Tsygankov et al. (2016) Tsygankov S. S., Lutovinov A.A., Krivonos R.A., Molkov S.V., Jenke P.J., Finger M.H., Poutanen J., 2016, MNRAS, 457, 258
- Urquard et al. (2014) Urquard et al., 2014, MNRAS, 437, 1791
- Walter (1976) Walter F., 1976, IAUC, 2959, 2
- Walter et al. (2015) Walter R., Lutovinov A. A., Bozzo E., Tsygankov S. S., 2015, ARAA, 23, 2
- Wegner (1994) Wegner, W., 1994, MNRAS, 270, 229
- Wijnands et al. (2013) Wijnands R., Degenaar N., Page D., 2013, MNRAS, 432, 2366