Competition of tolerant strategies in the spatial public goods game
Abstract
Tolerance implies enduring trying circumstances with a fair and objective attitude. To determine whether evolutionary advantages might be stemming from diverse levels of tolerance in a population, we study a spatial public goods game, where in addition to cooperators, defectors, and loners, tolerant players are also present. Depending on the number of defectors within a group, a tolerant player can either cooperate in or abstain from a particular instance of the game. We show that the diversity of tolerance can give rise to synergistic effects, wherein players with a different threshold in terms of the tolerated number of defectors in a group compete most effectively against defection and default abstinence. Such synergistic associations can stabilise states of full cooperation where otherwise defection would dominate. We observe complex pattern formation that gives rise to an intricate phase diagram, where invisible yet stable strategy alliances require outmost care lest they are overlooked. Our results highlight the delicate importance of diversity and tolerance for the provisioning of public goods, and they reveal fascinating subtleties of the spatiotemporal dynamics that is due to the competition of subsystem solutions in structured populations.
pacs:
89.75.Fb, 87.23.Ge, 89.65.-s1 Introduction
The stability of modern human societies relies on public goods that future generations have, for many decades past, increasingly often taken for granted [1]. This is likely to have dire consequences, because we fail to grasp the long-term consequences of unsustainable exploitation of natural resources and the unchecked growth of consumerism as the dominating social and economic order [2]. Tolerance, as the ability or willingness to steadfastly endure something, in particular a trying circumstance such as the existence of opinions or behaviour that one does not necessarily agree with, might be an important part of the equation to take us back on track. Although according to Darwin’s The Origin of Species natural selection favours the fittest and the most successful individuals, which in turn implies an innate selfishness that greatly challenges the concept of cooperation, tolerance and social norms in human societies may just be the missing ingredient for cooperative behaviour to prevail [3, 4, 5, 6, 7, 8, 9, 10, 11, 12]. In the realm of these considerations, evolutionary game theory waits ready as the theoretical foundation that is fit for addressing such challenges in a concise and relevant manner [13, 14, 15, 16, 17]. The public goods game [18], in particular, has been established for addressing situations that, if left unattended, may evolve towards the tragedy of the commons [19].
The crux of the underlying social dilemma lies in the fact that cooperation foresees an altruistic act that is costly to perform but benefits another. Although mutual cooperation would be optimal for all involved, a higher payoff, at least in the short term, is possible by exploiting the cooperative efforts of others. An often explored remedy is to punish defectors who do not contribute to the public good [20, 21, 22, 23, 24, 25, 26, 27, 28], or to reward cooperators who do contribute to the public good [29, 30, 31, 32, 33, 34, 35, 36]. However, the problem with both actions is that they are costly. Punishment entails bearing a cost for somebody else to incur a cost, while rewarding entails bearing a cost for somebody else to incur a benefit. As such, the basic dilemma is simply transferred to another level, hence the term second-order free-riding [37, 38], which describes all those who benefit from either reward or punishment but do not contribute towards covering the related costs. Another option is to simply abstain from the game if the outlook is not sufficiently rosy, and to settle for a small, but secure payoff instead [39, 40]. Previous research has shown, however, that defectors, cooperators, and loners become entailed in a closed loop of dominance [41, 42, 43, 44, 45, 46, 47], which maintains a Red Queen existence of cooperative behaviour that on average is no better than if everybody would abstain [48, 49].
Here we consider diverse levels of tolerance in the public goods game as an alternative to the aforementioned strategies. Indeed, instead of simply abandoning a less prospective public goods enterprise by abstaining, it may make much more sense to tolerate the situation and to endure against an emerging negative trend. Thus, in addition to cooperators, defectors, and loners, we also consider tolerant players. They are those who monitor the strategies of their neighbors and behave accordingly. In particular, if the number of defectors in the group exceeds a certain threshold tolerant players behave as loners, while otherwise they cooperate. Such behavior is similar in spirit to conditional cooperation [50, 51, 52, 53], but in the present case we do not neglect the fact that monitoring others to know the actual number of defectors in the group requires an additional effort, and thus comes with an additional cost of inspection. Importantly, instead of the application of a single level of tolerance [54], the question is whether diverse tolerance strategies offer evolutionary advantages over default abstinence, and whether there is synergy or competition among them? As we will show, advantages to tolerance and synergies do exist, such that players with a different threshold in terms of the tolerated number of defectors in a group provide an optimal response to the public goods dilemma. These solutions are made possible by the spontaneous emergence of complex spatial patterns that require a sufficiently large system size to emerge from random initial conditions. In fact, we will show that some globally stable subsystem solutions remain completely invisible even at a large system size, which is a striking manifestation of the subtleties that self-organising processes in a complex system may evoke. Before presenting these results in more detail, however, we first proceed with the description of the public goods game with diverse levels of tolerance.
2 Public goods game with diverse tolerance levels
The public goods game is staged on a square lattice with periodic boundary conditions where players are arranged into overlapping groups of size such that everyone is connected to its nearest neighbours. Accordingly, each individual belongs to different groups. The square lattice is the simplest of networks that allows us to go beyond the well-mixed population assumption, and as such it allows us to take into account the fact that the interactions among players that are engaged in group interactions are often inherently structured rather than random [18]. Nevertheless, for comparison and to provide some primer intuition about the competition of tolerant strategies, we also present results obtained in a well-mixed population, where groups are formed randomly.
Initially each player on site is designated either as a defector (), a cooperator (), a loner (), or a tolerant player (). Evidently, there are as many levels of tolerance as there are possible defectors in the group, so that . If the number of defectors in a group is smaller than the player acts as a cooperator, while otherwise it acts as a loner. As such, the value of determines the level of tolerance a particular player has. The higher the value of , the higher the number of defectors that are tolerated by an player within a group without it refusing cooperation. As the two extreme cases, indicates that an player will always remain in the non-participatory loner state, while indicates that an player will switch to a loner state only if all the other neighbors are defectors. Importantly, regardless of the choice an player makes, it always bears the cost as a compensation for knowing the number of defectors in a group.
As is standard practice, all cooperative strategies contribute a fixed amount , here considered without loss of generality, to the public good while defectors and loners contribute nothing. The sum of all contributions in each group is multiplied by the synergy factor and the resulting public goods are distributed equally amongst all the group members that are not loners. Importantly, the factor is applied only if there are at least two contributions made to the common pool from within the group. Otherwise, a lonely contributor is unable to utilize on the synergistic effect of a group effort, and hence applies. It is also an accepted protocol that loners, who do not participate in the game, obtain a moderate but secure payoff . By following previous related research [39, 48], we use but emphasize that using other values does not change our main findings as long as the rank of payoff values remains unchanged.
As we have argued, the behavior of tolerant players depends sensitively on the number of defectors within a group, which we denote as . Diverse tolerance thresholds can be introduced by using different prefactors, which are if and if . Hence, the total number of contributors to the common pool is
| (1) |
where denotes the number of players in the group who follow strategy . By using this notation, the payoff values of the competing strategies obtained from each group are:
| (2) | |||||
| (3) | |||||
| (4) | |||||
| (5) |
Monte Carlo simulations of the public goods game are carried out comprising the following elementary steps. A randomly selected player plays the public goods game with its partners as a member of all the groups, whereby its overall payoff is thus the sum of all the payoffs acquired in each individual group. Next, player chooses one of its nearest neighbours at random, and the chosen co-player also acquires its payoff in the same way. Finally, player adopts the strategy from player with a probability given by the Fermi function
| (6) |
where quantifies the uncertainty by strategy adoptions [55, 56, 57], implying that better performing players are readily adopted, although it is not impossible to adopt the strategy of a player performing worse. Each full Monte Carlo step () gives a chance to every player to change its strategy once on average. Further regarding the applied strategy update dynamics, we emphasize that only imitation is allowed but mutation is not considered. If we would apply a permanent mutation rate , then all competing strategies would be present in the system. In particular, the smallest fraction of a strategy would be at least proportional to the mutation rate . Under such circumstances, we can no longer speak about transitions between different solutions, and this effectively makes the presentation of phase diagrams meaningless. One could measure the stationary frequency of every strategy in the presence of mutation, but this is beyond the scope of the present work.
In case of well-mixed populations, we have used players, while the system size for the square lattice topology was varied from to . As we will discuss in detail later, the appropriately chosen system size is essential to get reliable results that are valid in the large size limit. As expected, the relaxation time depends sensitively on both the system size and the proximity to the phase transition points, which is why it was varied from to s. We note that the random initial state may not necessarily yield a relaxation to the most stable solution of the game even at such a large system size (). To verify the stability of different subsystem solutions, we have therefore conducted an appropriate stability analysis that involves the usage of prepared initial states, as illustrated in Fig. 2. In the next section, we present the main results.
3 Results
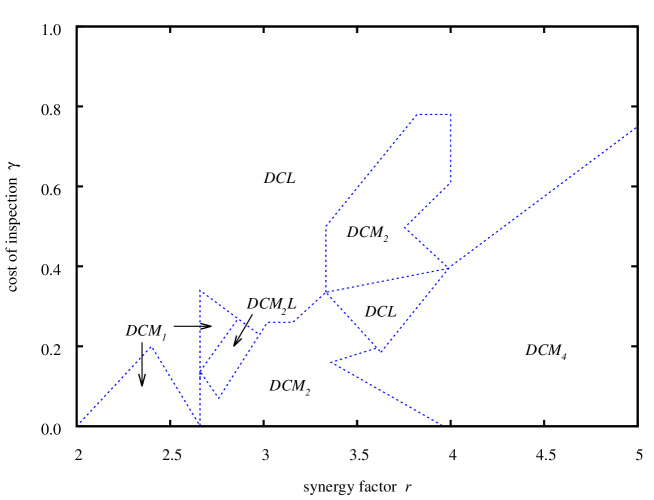
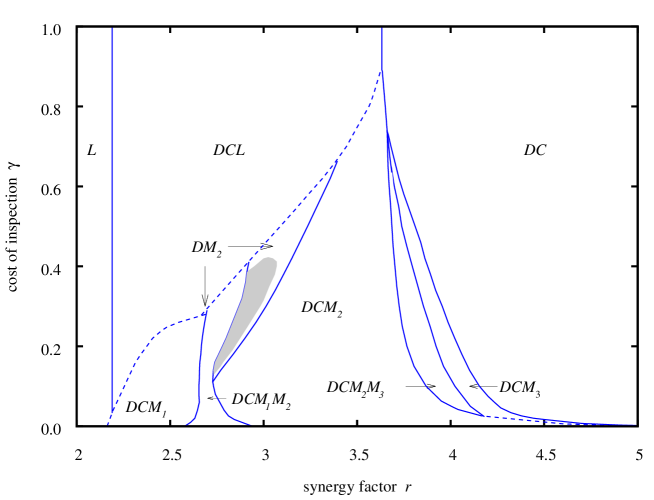
Before presenting the main results obtained in structured populations, we first present results obtained in well-mixed populations, where players do not have fixed neighbours but rather form groups randomly. Due to the large number of independent variables analytical solutions are unattainable, but we can perform individual-based simulations to explore different outcomes of the evolutionary process. It is a well-known fact that the behaviour of a well-mixed system may depend sensitively on the initial conditions. We therefore restrict ourself to the case when all competing strategies are initially present in equal proportions. Moreover, to further simplify the calculation, we applied deterministic strategy updating in this case, such that a player adopts the strategy of a randomly chosen partner only if the latter achieved a higher payoff. Despite of these simplifications, the outcome of evolution still remains ambiguous in a well-mixed population. More precisely, there are parameter values where the final outcome is different despite the fact that we have used exactly the same parameters and initial conditions, and only different seeds for the random number generator (the latter provides an inseparable source of noise that influences the outcome of the evolution). While this behaviour is more pronounced in smaller populations, we could still observe it even when using the largest available system size ( players). Consequently, it is impossible to present a rigorously valid phase diagram that depicts the outcome of the system unambiguously at specific parameter values. Nevertheless, the analysis does provide an intuition about the competition of the strategies at different parameter values. More precisely, the upper panel of Fig. 1 depicts the most commonly selected stable solutions, as obtained for a given combination of the synergy factor and the cost of inspection . This statistically valid diagram was obtained by using players and independently repeating the evolution times for every point of the parameter plane. The presented results indicate that the competition among strategies will always select a sole winner that can coexist with unconditional and players. Also, it can be observed that the lower the synergy factor , the lower the threshold from the winning tolerant strategy. These results thus suggest that, under harsh conditions, tolerant players do not have the luxury of tolerating too many defectors in the group because the small value of simply cannot compensate their lack of contributions to the public good. The reverse is also true, namely that at larger values of the strategy with a higher threshold outperforms the less tolerant strategies. In the extreme case, when is also high, then all conditionally tolerant strategies extinct and unconditionally cooperators coexist with defectors due to the well-known consequence of network reciprocity: if players manage to form compact clusters then their resulting payoff could be high enough to compensate the presence of defectors at the border of such domains. In this way we can observe a pattern where cooperator domains are separated by defector players where their time-independent fractions depends sensitively on the value of .
As was frequently observed for various other evolutionary games before [56, 58, 46, 59], going from well-mixed to structured populations significantly affects the results, and the presently considered model is in this regard no different. Importantly, the outcome of the evolutionary process in a structured population is always unambiguous if only the system size is large enough. In other words, if a solution that emerges somewhere in the population is capable to dominate other solutions, it will gradually spread and prevail in the whole system. In this way, the original meaning of the phase diagram is restored, as it informs us about the stable solutions that are obtained in dependence on the main system parameters. For the square lattice, such a phase diagram is shown in the bottom panel of Fig. 1. The presented results reveal several fundamental features that can be associated with the viability of tolerant strategies in the public goods game. In agreement with the preceding results obtained in well-mixed populations, it can be observed that the higher the value of , the higher the tolerance can be, and vice versa. This observation resonates with our naive expectation and perception of tolerance in that overly tolerant strategies cannot survive in the presence of other less tolerant strategies. From the viewpoint of the considered evolutionary game this is not surprising, because players adopting the strategy act as loners only if everybody else in the group is a defector. And such sheer unlimited tolerance is simply not competitive with other less tolerant strategies. Also, if the cost of inspection is too high, or if the value of the synergy factor is either very low or very high, then tolerant players cannot survive even if they exhibit different levels of tolerance. This observation is in agreement with preceding research on the subject, where only uniform tolerance levels were considered [54].
More precisely, as the lower panel of Fig. 1 reveals, at very low values of , similarly as in the simplest three-strategy model, the loners prevail. At slightly larger values of , this single-strategy phase gives way to the three-strategy phase where , and strategies dominate each other cyclically. Interestingly, unlike in the uniform tolerance public goods game [54], here the closed loop of dominance is the only way for loners to survive at higher values [39]. In all the other cases the loners die out due to the fact that the diversity of tolerant players is able to provide a more competitive response to the exploitation of defectors. Indeed, if we increase the synergy factor further, we find that, through a succession of different phase transitions, the phase gives way to a rich variety of two-, three- or even four-strategy phases, in all of which tolerant strategies are present. These solutions are the , the , the , and the phase, as well as two four-strategy phases and , which are unique to the public goods game with diverse strategy levels. We emphasize that the coexistence of tolerant strategies with different tolerance levels is due entirely to the consideration of structured populations. We remind that such evolutionary outcomes are impossible in well-mixed populations, as evidence by the results presented in the upper panel of Fig. 1.
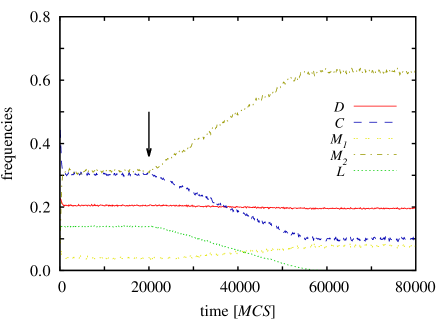
According to the phase diagram in the bottom panel of Fig. 1, the first transition from the phase to one of the mentioned phases is always discontinuous. The accurate position of these kind of phase transition points, as denoted by the dashed line in the phase diagram, can only be determined by means of a stability analysis of competing subsystem solutions. A subsystem solution can be formed by any subset of all the competing strategies, and on their own (if separated from other strategies) these subsystems solutions are stable. This is trivially true if the subsystem solution is formed by a single strategy, but is likewise true if more than one strategy forms such a solution. Evidently then, for any specific set of parameter values, more than one subsystem solution exists. The dominant subsystem solution, and hence the phase that is ultimately depicted in the phase diagram such as the one shown in the bottom panel of Fig. 1, can only be determined by letting all the subsystem solutions compete against each other. As an example, we show in Fig. 2 the competition between the three-strategy phase and the four-strategy phase at both sides of the discontinuous phase transition point, although on both sides the two phases are individually stable, i.e., are proper subsystem solutions. To monitor the competition between the two subsystem solutions, we launch the evolution from a prepared initial state, where one half of the lattice initially contains only strategies , and distributed uniformly at random, while the other half of the lattice contains only the strategies , and distributed uniformly at random. As the next step, we let the two subsystem solutions evolve to their representative state in terms of the strategy frequencies and the typical spatial pattern. Only when both reach their stationary state we open the border by allowing strategy invasion through the separating interface. Lastly, we monitor how the competition between the two solutions evolves, i.e., which subsystem solution will turn out as the victor. The example depicted in Fig. 2 demonstrates clearly that the final outcome depends sensitively on the value of the synergy factor . At the smaller value of the solution wins, while at the slightly larger value of the solution turns out to be the dominant one.
We emphasize that finite-size effects can easily play an obstructive role in the processes illustrated in Fig. 2. If we start the evolution from a random initial state using a small system size, it can easily happen that we observe a misleading evolutionary outcome, simply because the phase that would be a stable solution at large system size has no chance to emerge – for example, one of the strategies that would be necessary to form it dies out beforehand due to the small system size. But that is not the only caveat. Even if we use prepared initial states for the stability analysis, we should be careful because the space (part of the lattice) allocated to each potential subsystem solution should be large enough for the latter to emerge. For example, the fluctuations of strategies in the cyclically dominant phase could be extremely large, and therefore this subsystem solution alone requires a large population to avoid fixation before the characteristic stationary pattern emerges. We note that the upper panels of Fig. 2 show just a small patch around the border where the two solutions meet, which is cut out of a large lattice (not shown). This is also why the periodic boundary conditions cannot be detected in the four depicted snapshots.
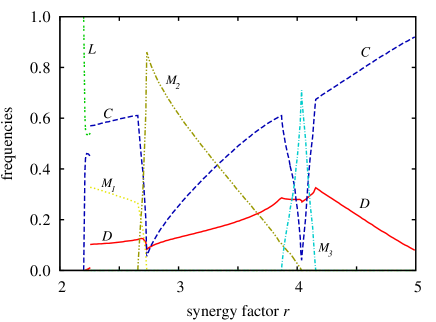
We proceed with the exploration of the main phase diagram obtained on the square lattice, and to have a more accurate insight with regards to the recorded solutions, we show in Fig. 3 two representative cross sections. The presented results reveal that there is a clear selection among the different tolerant strategies, and hence often only one of them survives and forms a stable solution with either the or / and the players. There are, however, also specific parameter values where the stable solution contains two different tolerant strategies. While an explanation for such a coexistence will be presented later, the message is that, sometimes, diverse levels of tolerance do provide an optimal response to the public goods dilemma.
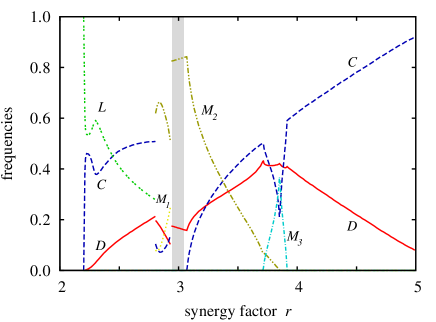
A more accurate comparison of the two plots in Fig. 3 reveals qualitatively different behaviour. When the cost is low (left), we can observe continuous transitions between the phases. Starting from the phase, we first see that the fraction of the players increases gradually while the fraction of the players decreases. Similarly, when we leave the phase, the fraction of the players in the population grows while the fraction of the players decreases. Finally, when the synergy factor provides a sufficiently comfortable environment for pure cooperators, the last tolerant strategy () dies out, giving way to the phase. Intuitively, one might expect that a higher inspection cost would make the tolerant strategies more vulnerable. Yet this is true only for very high values. The left panel of Fig. 3 illustrates that the four-strategy phase terminates qualitatively differently from the way it does for the low value. In the high- case the time average of the fraction of each strategies is well above zero, but the four-strategy phase becomes unstable as we increase due to invincible fluctuations of strategy frequencies.
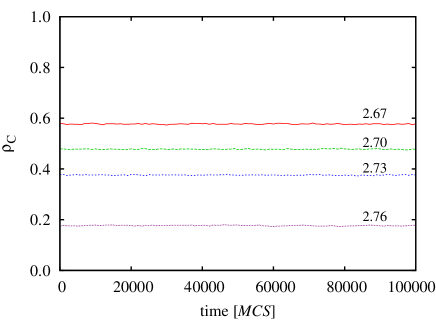
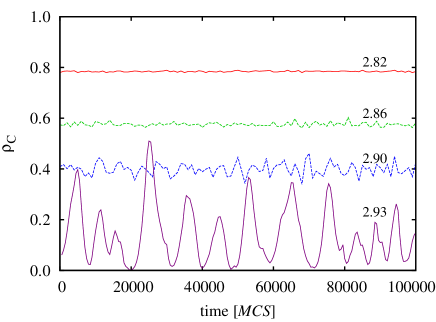
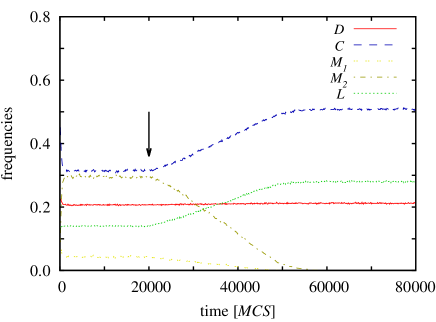
This behaviour is illustrated in Fig. 4, where we show how the fraction of cooperators varies over time for different values of at two different values of . To emphasise the remarkably different behaviour, we have used a notably large system size, , where normally the fluctuations of strategy densities should be virtually invisible. This expectation is confirmed in the left panel when the system leaves the four-strategy phase via a continuous phase transition. But in the right panel, when a higher cost is applied, the fluctuations in amplitude are increasing drastically as we increase the value of and approach the discontinuous phase transition point.
In this “unstable” parameter region the final solution depends sensitively on which strategy dies out first. According to our observations, strategies , , , and die out very soon, and the fundamental question remains whether the strategy or the strategy will die out next, because this ultimately dictates two very different solutions. If the strategy dies out first, we return to the previously studied uniform-tolerance public goods game [54], where the system terminates into the two-strategy phase. Indeed, this scenario materialises almost always if the system size is small. If the system size is large, however, the strategy dies out first, which allows the two tolerant strategies to form the stable two-strategy phase. In this case the presence of diverse tolerance levels thus ensures that defectors are wiped out completely, leaving the population in defector-free, full-cooperator state.
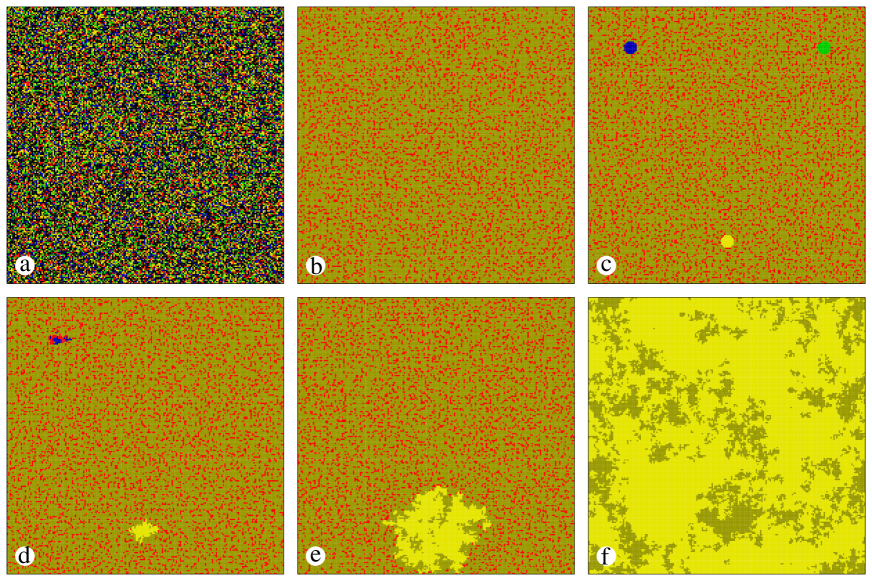
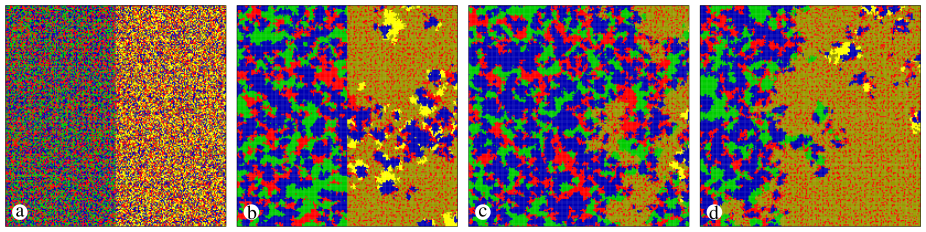
To illustrate how the combination of different tolerant strategies is the most effective response to a public goods dilemma, we present a series of snapshots that is carefully engineered to illustrate exactly what otherwise remains invisible if a small population starts from a random initial state. In the panel (a) of Fig. 5, we start exactly like that – with a small lattice where initially all eight strategies are distributed uniformly at random. After a relatively short relaxation time only and players survive in panel (b) to form what appears to be the dominating two-strategy phase at these parameter values. In fact, this phase is the dominant stable solution in the previously studied uniform-tolerance public goods game [54]. But in the game studied here, we have other options because of the diverse tolerance levels that we consider. Therefore, to test the stability of the phase properly, we insert small compact patches of other strategies in panel (c). These are the pure cooperators (), the loners (), and the tolerant strategy (), positioned from the left-upper part of the lattice in a clockwise manner. Subsequently, panels (d) and (e) demonstrate clearly that first the loners die out, followed by the pure cooperators. However, the strategy forms a powerful alliance with the strategy, whose domain is able to grow, as shown in panel (e). Gradually, all the defectors are crowded out, and in the final state illustrated in panel (f), only the two different tolerant strategies remain to provide the maximal cooperation level in the defector-free state. Thus, it turns out that the subsystem solution is ultimately stronger than the subsystem solution. This outcome can be interpreted so that players are efficient at sweeping out and players, who, as the two extreme limits of tolerance, prevent other strategies to function efficiently. At the same time, players are capable to beat strategy . Accordingly, we need the features of both and players to reach the happy end.
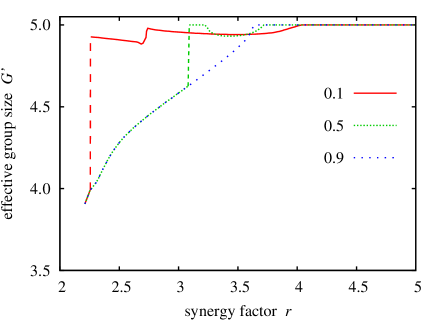
The optional participation in the public goods game can easily result in a smaller effective group size because not only but also players may refuse participation in the joint venture. This raises the possibility that the fixed value of the synergy factor becomes larger than the effective group size , which would transform the public goods dilemma to a game where players would actually have an incentive to prefer cooperation over defection. To clarify this, we have calculated the average size of every group where the public goods game was played, along with the value of the synergy factor that was used to determine the payoffs. The obtained results are presented in Fig. 6, where we show the average value of in dependence on the synergy factor , as obtained for three representative values of the cost. Here , and represent low, intermediate and high cost values of tolerant players, respectively. As the results show, is always well-above the corresponding value of , thus leaving the public goods dilemma intact, even if effective group size changes. This quantity, however, helps us to gain a deeper understanding of why the above-discussed coexistence can provide a competitive solution against , or other strategies. As the middle curve in Fig. 6 shows, the value of jumps up and approaches the maximal level at an intermediate value of , where we have observed the stable phase. At this point we note again that is measured only for those groups where the public goods game is actually played. Accordingly, the high value of indicates that players contribute to the common pool almost exclusively when players of the same type are present dominantly in the group. In this case they can collect the highest mutual payoff, otherwise, when they form groups with players, they refuse to participate and prefer a safer payoff that is warranted by the loner strategy. In the latter case the public goods game does not take place, and hence the average value of is not lowered. Although it is possible to claim that other strategies behave similarly, the intermediate tolerance threshold level applied by the strategy is the best compromise under this conditions to reach the most competitive payoff.
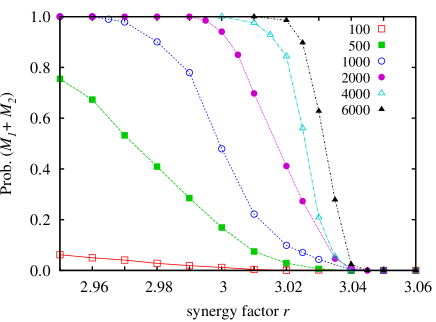
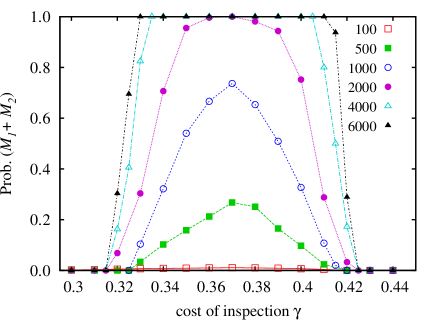
Turning back to the properties of the phase diagram depicted in the bottom panel of Fig. 1, the example shown in Fig. 5 highlights that the order in which the strategies die out is crucial for the final evolutionary outcome. To give a more quantitatively accurate prediction of whether the system will terminate into the or the phase, we show in Fig. 7 the fixation probability to the latter for different combinations of and . Here, we have always started the evolution from a random initial state (containing all the eight strategies distributed uniformly at random), and we have simply counted how many times the system terminates into the phase. The alternative destination of the evolutionary process was to arrive to the phase, which for all the considered parameter combinations used in Fig. 7 is the only other stable subsystem solution. To get a reliable statistics, we have repeated these runs times for linear system sizes, while for even larger lattices we have averaged over 500 independent runs. The results depicted in Fig. 7 show a remarkable finite-size effect. More precisely, there are parameter values of and where the strategy dies out first, thus allowing the phase to conquer the whole system. But this solution remains completely invisible if the system size is too small. And these are the specific combinations of the parameters and that are shaded grey in the phase diagram shown in Fig. 1 – these are the invisible solutions for the large majority of the system sizes that are in widespread use in the literature nowadays.
4 Discussion
Summarising, we have studied the evolution of cooperation in a spatial public goods game entailing traditional cooperators, defectors, and loners, as well as five different types of tolerant players. Our research has confirmed the naive expectation that minimal tolerance levels are best applied under adverse conditions for cooperation, while higher tolerance levels are preferred under conditions favourable to cooperation. More importantly, we have shown that the diversity of tolerance can give rise to synergistic effects, such that only players with a different threshold provide the optimal response to defection and default abstinence, and in fact become dominant where otherwise, in the absence of tolerance, cooperation would not be viable. The results also reveal, however, that more commonly the evolution selects a single tolerance level to coexist with one or more of the three traditional strategies. This highlights the subtle balance between punishment and reward that must be met for tolerance to have the desired effect. Namely, when a tolerant player decides to abstain, it effectively punishes cooperators by not cooperating with them, and it also punishes defectors by denying them the possibility to exploit a cooperative act. On the other hand, when a tolerant player decides to cooperate, if effectively rewards the defectors by giving them an opportunity to exploit, and it also rewards other cooperators by supporting the joint enterprise. The right balance between the two choices, it turns out, is subtle and difficult to pinpoint, and as such it favours a single tolerance level over a multitude of them. Yet, as we have shown, this does not preclude diverse tolerance levels to constitute an optimal response to the public goods dilemma.
In addition to the more general observations related to the viability of tolerance and its evolutionary advantages, the reported results reveal one of the most striking system-size effects. Namely, we have shown that some globally stable subsystem solutions, and in particularly those that manifest synergies between different tolerance levels, can remain completely invisible even at a relatively large system size. It is only when a sufficiently large system size is used do these invisible solutions sometimes emerge as the victors of the evolutionary process. And only if the system size is really very large does to fixation probability for these invisible solution tends to one. This carries an important warning that is frequently overlooked when random initial conditions are used in structured populations where competing strategies are three or more. Although the usage of random initial conditions may appear as the most ’democratic’ setup, giving every strategy an equal opportunity to succeed, in reality it is not the strategies that compete, but rather stable subsystem solutions. Subsystem solutions are solutions that are formed by different subsets of all the competing strategies. In addition to which strategies form a particular subsystem solution, each such solution is characterised by a particular spatiotemporal dynamics that supports its stability. Most importantly, some subsystem solutions therefore require longer than others to emerge, or they require a larger system size than other, usually simpler subsystem solutions. The more complex subsystem solutions therefore often never even get a chance to compete against the faster emerging simpler subsystem solutions. It is thus absolutely vital that the stability of subsystem solutions is verified for all possible strategy combinations, and that the competition among the stable solutions is carried out so that all get a fair chance, as demonstrated in Fig. 3.
It is also important to note that the argument claiming that such demanding subsystem solutions are not relevant because they simply require an unrealistically large system size is wrong. Once such solutions emerge, they can remain stable also in very small populations. The large system size is initially needed simply to give a chance to all possible subsystem solutions to fully emerge, and then for all of them to engage in a fair evolutionary competition. In effect, the usage of a sufficiently large system size simply ensures that all imaginable initial conditions will be realised before an accidental extinction, even if the latter is to occur only locally, would prevent the emergence of a stable subsystem solution. But in reality, the realisation of a particular initial condition, however special it may be, is mainly a matter of time, and in case of intelligence also a matter of craftsmanship towards initiating a particular change, rather than a matter of vast population size. Arguments against solutions that are valid and remain stable in the large population size limit are futile, as they go against the fundamental principles that have been established a long time ago in the realm of nonequilibrium statistical physics and the theory of phase transitions [60, 61]. And it is of paramount importance for the research relying on simulations of complex systems in biology, ecology, sociology, and economy to adhere to these fundamental principles if it aspires to have any merit.
References
References
- [1] Ostrom E 1990 Governing the commons: The Evolution of Institutions for Collective Action (Cambridge, U.K.: Cambridge University Press)
- [2] Deaton A and Muellbauer J 1980 Economics and Consumer Behavior (Cambridge: Cambridge University Press)
- [3] Smith A 2010 The Theory of Moral Sentiments (London: Penguin Books)
- [4] Nowak M A and Highfield R 2011 SuperCooperators: Altruism, Evolution, and Why We Need Each Other to Succeed (New York: Free Press)
- [5] Chen X, Fu F and Wang L 2009 Phys. Rev. E 80 051104
- [6] Jiang L L, Wang W X, Lai Y C and Wang B H 2010 Phys. Rev. E 81 036108
- [7] Rand D A and Nowak M A 2013 Trends in Cognitive Sciences 17 413–425
- [8] Helbing D, Szolnoki A, Perc M and Szabó G 2010 PLoS Comput. Biol. 6 e1000758
- [9] Xu B and Wang J 2015 Sci. Rep. 5 16447
- [10] Capraro V and Cococcioni G 2015 Proc. R. Soc. B 282 20150237
- [11] Biziou-van Pol L, Haenen J, Novaro A, Liberman A O and Capraro V 2015 Judgment and Decision Making 10 538–548
- [12] Pavlogiannis A, Chatterjee K, Adlam B and Nowak M A 2015 Sci. Rep. 5 17147
- [13] Sigmund K 1993 Games of Life: Exploration in Ecology, Evolution and Behavior (Oxford, UK: Oxford University Press)
- [14] Weibull J W 1995 Evolutionary Game Theory (Cambridge, MA: MIT Press)
- [15] Hofbauer J and Sigmund K 1998 Evolutionary Games and Population Dynamics (Cambridge, U.K.: Cambridge University Press)
- [16] Nowak M A 2006 Evolutionary Dynamics (Cambridge, MA: Harvard University Press)
- [17] Sigmund K 2010 The Calculus of Selfishness (Princeton, NJ: Princeton University Press)
- [18] Perc M, Gómez-Gardeñes J, Szolnoki A and Floría and Y Moreno L M 2013 J. R. Soc. Interface 10 20120997
- [19] Hardin G 1968 Science 162 1243–1248
- [20] Fehr E and Gächter S 2000 Am. Econ. Rev. 90 980–994
- [21] Gardner A and West S A 2004 Am. Nat. 164 753–764
- [22] Henrich J, McElreath R, Barr A, Ensminger J, Barrett C, Bolyanatz A, Cardenas J, Gurven M, Gwako E, Henrich N, Lesorogol C, Marlowe F, Tracer D and Ziker J 2006 Science 312 1767–1770
- [23] Sigmund K 2007 Trends Ecol. Evol. 22 593–600
- [24] NJ Raihani A T and Bshary R 2012 Trends Ecol. Evol. 27 288–295
- [25] Rand D G and Nowak M A 2011 Nat. Commun. 2 434
- [26] Powers S T, Taylor D J and Bryson J J 2012 J. Theor. Biol. 311 107–116
- [27] Shimao H and Nakamaru M 2013 PLoS ONE 8 e59894
- [28] Hauser O P, Traulsen A and Nowak M A 2014 J. Theor. Biol. 343 178–185
- [29] Dreber A, Rand D G, Fudenberg D and Nowak M A 2008 Nature 452 348–351
- [30] Rand D G, Dreber A, Ellingsen T, Fudenberg D and Nowak M A 2009 Science 325 1272–1275
- [31] Hilbe C and Sigmund K 2010 Proc. R. Soc. B 277 2427–2433
- [32] Hauert C 2010 J. Theor. Biol. 267 22–28
- [33] Szolnoki A and Perc M 2010 EPL 92 38003
- [34] Szolnoki A and Perc M 2012 New J. Phys. 14 093016
- [35] Szolnoki A and Perc M 2015 Proc. R. Soc. B 282 20151975
- [36] Gao L, Wang Z, Pansini R and an Rui-Wu Wan Y T L 2015 Sci. Rep. 5 17752
- [37] Fehr E 2004 Nature 432 449–450
- [38] Fowler J H 2005 Nature 437 E8–E8
- [39] Hauert C, De Monte S, Hofbauer J and Sigmund K 2002 Science 296 1129–1132
- [40] Szabó G and Hauert C 2002 Phys. Rev. Lett. 89 118101
- [41] Kerr B, Riley M A, Feldman M W and Bohannan B J M 2002 Nature 418 171–174
- [42] Kirkup B C and Riley M A 2004 Nature 428 412–414
- [43] Reichenbach T, Mobilia M and Frey E 2006 Phys. Rev. E 74 051907
- [44] Arenas A, Camacho J, Cuesta J A and Requejo R 2011 J. Theor. Biol. 279 113–119
- [45] Wang W X, Ni X, Lai Y C and Grebogi C 2011 Phys. Rev. E 83 011917
- [46] Szolnoki A, Mobilia M, Jiang L L, Szczesny B, Rucklidge A M and Perc M 2014 J. R. Soc. Interface 11 20140735
- [47] Grošelj D, Jenko F and Frey E 2015 Phys. Rev. E 91 033009
- [48] Hauert C, De Monte S, Hofbauer J and Sigmund K 2002 J. Theor. Biol 218 187–194
- [49] Semmann D, Krambeck H J and Milinski M 2003 Nature 425 390–393
- [50] Taylor M 1976 Anarchy and Cooperation (New York: Wiley)
- [51] Boyd R and Richerson P 1988 J. theor. Biol. 132 337–356
- [52] Szolnoki A and Perc M 2012 Phys. Rev. E 85 026104
- [53] Nakamaru M and Yokoyama A 2014 PLoS ONE 9 e108423
- [54] Szolnoki A and Chen X 2015 Phys. Rev. E 92 042813
- [55] Szabó G and Tőke C 1998 Phys. Rev. E 58 69–73
- [56] Szabó G and Fáth G 2007 Phys. Rep. 446 97–216
- [57] Szolnoki A, Perc M and Szabó G 2009 Phys. Rev. E 80 056109
- [58] Perc M and Szolnoki A 2010 BioSystems 99 109–125
- [59] Szabó G and Borsos I 2016 Phys. Rep. 624 1–60
- [60] Liggett T M 1985 Interacting Particle Systems (New York: Springer)
- [61] Binder K and Hermann D K 1988 Monte Carlo Simulations in Statistical Physics (Heidelberg: Springer)