Direct observation of spatio-temporal dynamics of short electron bunches in storage rings
Abstract
In recent synchrotron radiation facilities, the use of short (picosecond) electron bunches is a powerful method for producing giant pulses of Terahertz Coherent Synchrotron Radiation (THz CSR). Here we report on the first direct observation of these pulse shapes with a few picoseconds resolution, and of their dynamics over a long time. We thus confirm in a very direct way the theories predicting an interplay between two physical processes. Below a critical bunch charge, we observe a train of identical THz pulses (a broadband Terahertz comb) stemming from the shortness of the electron bunches. Above this threshold, a large part of the emission is dominated by drifting structures, which appear through spontaneous self-organization. These challenging single-shot THz recordings are made possible by using a recently developed photonic time stretch detector with a high sensitivity. The experiment has been realized at the SOLEIL storage ring.
- PACS numbers
-
41.60.Ap, 29.27.Bd, 42.65.Re, 07.57.Hm
pacs:
41.60.Ap, 29.27.Bd, 42.65.Re, 07.57.HmIn last generation storage ring facilities, it has become possible to produce pulses of Coherent Synchrotron Radiation (CSR), with powers that exceed “classical” (incoherent) synchrotron radiation by factors greater than 10000 Carr et al. (2001); Abo-Bakr et al. (2002); Byrd et al. (2002); Mochihashi et al. (2006); Karantzoulis et al. (2010); Barros et al. (2013); Billinghurst et al. (2015), and may be organized in Terahertz combs Steinmann et al. (2015); Tammaro et al. (2015).
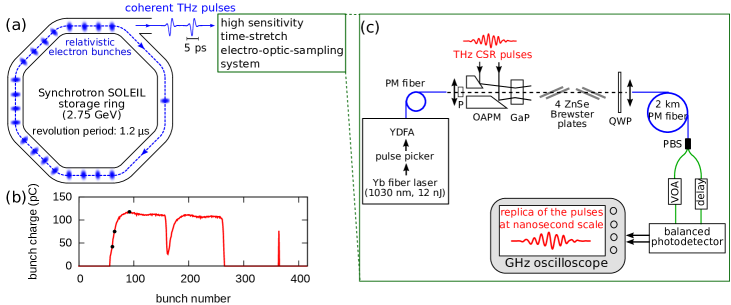
A priviledged way for obtaining this type of emission with the stability required for users, consists in operating the storage ring facilities with short (picosecond) electron bunches Abo-Bakr et al. (2002, 2003); Mathis et al. (2003); Feikes et al. (2011); Martin et al. (2011); Barros et al. (2013); Billinghurst et al. (2015); Barros et al. (2015). As the main idea, if the longitudinal shape of an electron bunch presents Fourier components at terahertz frequencies, an intense and stable emission of coherent terahertz radiation is generally expected in bending magnets of accelerators, as illustrated in Figure 1.
This simple conceptual picture is nevertheless deeply complicated by a physical phenomenon of very fundamental nature: the interaction of electron bunches with their own emitted radiation leads to a spatiotemporal instability, which is characterized by the spontaneous appearance of microstructures at the millimeter scale Stupakov and Heifets (2002); Venturini and Warnock (2002); Roussel et al. (2014a). In turn, these structures also emit CSR. Hence the interplay between these two modes of emission (i.e., from the ”shortness” of the electron bunches and from the spontaneously formed microstructures) plays a central role in the knowledge and improvement of the present and future CSR sources.
However, it is only recently that direct experimental observation of the emitted THz electric field pulse shapes became possible. As an important milestone, electro-optic sampling has become possible in storage rings either for recording CSR pulses Katayama et al. (2012); Müller et al. (2012), and electron bunch near-field shapes Hiller et al. (2014). Then the so-called photonic time-stretch strategy Coppinger et al. (1999); Goda and Jalali (2013) opened the way to direct recordings of CSR electric field pulse shapes, over successive shots at ultra-high repetition rates Roussel et al. (2015).
Nevertheless, the limited sensitivity of these new high-repetition-rate picosecond detectors limited experimental investigation of THz signals to special conditions of high bunch charge and long electron bunches. This configuration corresponds to highest possible peak powers, but also to strongly unstable operation Roussel et al. (2014a, 2015). Thus, characterization of CSR pulse shape dynamics remained an open question for short (picosecond-scale) and low-charge electron bunches, i.e., the specific conditions where exploiting this fundamental phenomenon, as a THz source, are foreseen.
In this Letter, we present the actual shapes (the electric field evolution, including envelope and carrier) of the Terahertz CSR pulses emitted in short bunch operation in a storage ring. This analysis has been possible by combining two recent advances in Terahertz electric field detection: high-sensitivity electro-optic sampling Ahmed et al. (2014); Savolainen et al. (2013) for obtaining the required signal-to-noise ratio with picosecond resolution, and the so-called time-stretch strategy Coppinger et al. (1999); Goda and Jalali (2013); Roussel et al. (2015), which enables single-shot recordings at ultra-high acquisition rates. As a main result, we present a direct characterization of the transition from stable Terahertz emission to dynamically evolving pulses: the microbunching instablity threshold, which plays a central role in theories of CSR Venturini and Warnock (2002); Stupakov and Heifets (2002). We also show that numerical integration of the Vlasov-Fokker-Planck equation reproduces the main characteristics of the experimental signals.
The experiment has been performed at the SOLEIL storage ring in a so-called low-alpha user shift. This mode is characterized by the operation of short bunches (of about 5 ps RMS Tordeux et al. (2012)), which emit CSR with a stability which is compatible with THz user experiments. Moreover the 209 bunches which circulate in the storage ring have typically different charges [Fig. 1(b)]. This allows investigations as a function of bunch charge by simply studying the emission of each individual electron bunches, without change of the storage ring operating conditions.
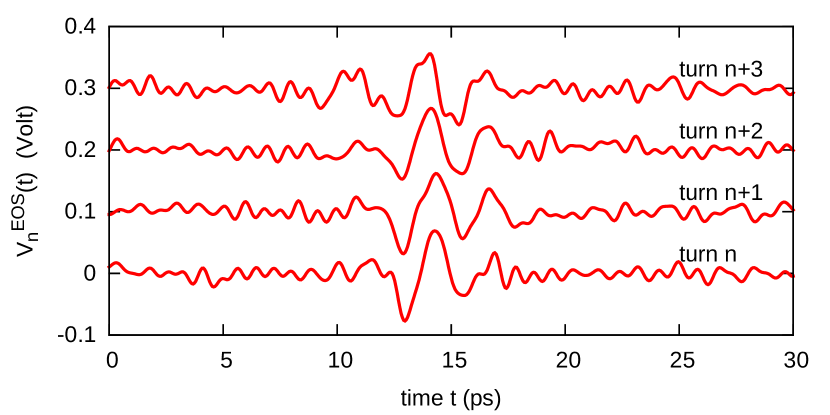
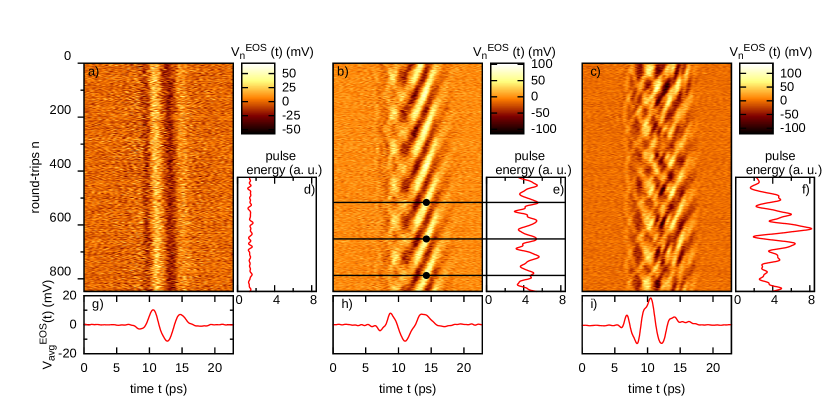
The THz CSR pulses are recorded on the AILES beamline, using a photonic time-stretch electro-optic sampling setup, which is specially designed for high sensitivity [Fig. 1(c)]. This detection system is composed of two parts, which are partly intertwined (see also Ref. Szwaj et al. (2016) for details). The first part is a single-shot EOS Jiang and Zhang (1998); Wilke et al. (2002) system based on the design developped at SLS Müller et al. (2012), FLASH Steffen et al. (2009) and ANKA Hiller et al. (2014), which imprints the THz electric evolution onto the longitudinal profile of a chirped laser pulse at 1030 nm. As a key point for reaching the required high sensitivity, we follow the special strategy recently published by Ahmed, Savolainen and Hamm Ahmed et al. (2014); Savolainen et al. (2013), which consists in using balanced detection, and introducting a set of Brewster plates as shown in Figure 1(c). In order to obtain the necessary high acquisition rates, we associated this EOS setup with the so-called photonic time stretch technique developed by B. Jalali and coworkers Coppinger et al. (1999); Wong et al. (2011). The chirped laser pulses containing the THz pulse shape information are stretched within a 2 km-long fiber Goda and Jalali (2013), up to the nanosecond scale. At the balanced photodetector’s output, we thus obtain a ”replica” of CSR pulse, that is temporally magnified, by a factor of about 200. The optical performances of the setup are described in detail in Ref. Szwaj et al. (2016). The acquisition window is of the order of 15 ps, and the sensitivity is of 2.5 V/cm/ at 300 GHz in the electro-optic crystal (i.e., 1.25 V/cm). Since the frequency range of the CSR pulses is typically in the 150-600 GHz range Barros et al. (2013, 2015), the “stretched signal” to be recorded by the oscilloscope is in the 0.75-3 GHz range. Here we use a Teledyne LeCroy LabMaster 10-65Zi oscilloscope (with an – overdimensioned – 30 GHz bandwidth), and the acquired data are numerically low-pass filtered at 6 GHz. We recorded 3 ms long time series, which corresponds to approximately 2500 turns in the storage ring. Typical single-shot recordings of the THz CSR pulses (electric field versus time) are represented in Figure 2. In order to obtain a synthetic view of the CSR pulse dynamics over a large number of turns in the storage ring, we also represented the pulse series in a colorscale diagram, versus time and number of turns, as displayed in Figure 3(a)-(c), for three values of bunch charge.
These diagrams clearly reveal two different emission processes. First, the data evidence the coherent emission which was predicted to occur from the “shortness” of the electron bunch Sannibale et al. (2004). This process is directly visible below the microbunching instability threshold [Fig. 3(a)]. The emission occurs as a few-period coherent THz pulses, without dynamical evolution from turn-to-turn. This corresponds to a quasi-perfect Terahertz frequency comb Tammaro et al. (2015).
A second process occurs when the charge exceeds the so-called microbunching instability threshold [Figs. 3(b,c)]. An important part of the THz radiation is then emitted in the form of an oscillation, that drifts at each turn in the storage ring. This carrier-envelope phase drift stems from the appearance of microstructures which are continuously moving inside the electron bunch, as described in the numerical simulations presented later. In addition, the first process, i.e. the coherent emission due to the bunch shortness, is expected to exist above the microbunching instability threshold. The signature of this contribution from the data presented in Figs. 3(b,c) can be evidenced by computing the electric field pulse average over a large number of turns:
| (1) |
where is the electro-optic sampling signal of the THz pulses. This processing filters out the drifting component and may thus be viewed as a measure of the component due to the bunch shortness. This contribution (with ) is visible in Figures 3(g,h,i). Note that this component is linked to the short-bunch mode operation, i.e., is not observed when long electron bunches are used Roussel et al. (2014a, 2015).
From these data, it is also possible to reconstruct the turn-by-turn evolution of the THz pulse energy , with
| (2) |
where and are taken near the boundaries of the THz pulse. This signal corresponds to the signal that would be recorded with a standart ”slow” detector [see Figs. 3(d-f)]. It permits to confirm in a very direct way that the modulation in the THz signal, which can be clearly seen in Fig. 3(e) and which had been observed in numerous studies Kuske (2009); Feikes et al. (2011); Evain et al. (2012); Roussel et al. (2014b); Judin et al. (2012); Bartolini et al. (2011); Billinghurst et al. (2016), is directly related to the period of apparition of the micro-structures in the bunch [Fig. 3(b)].
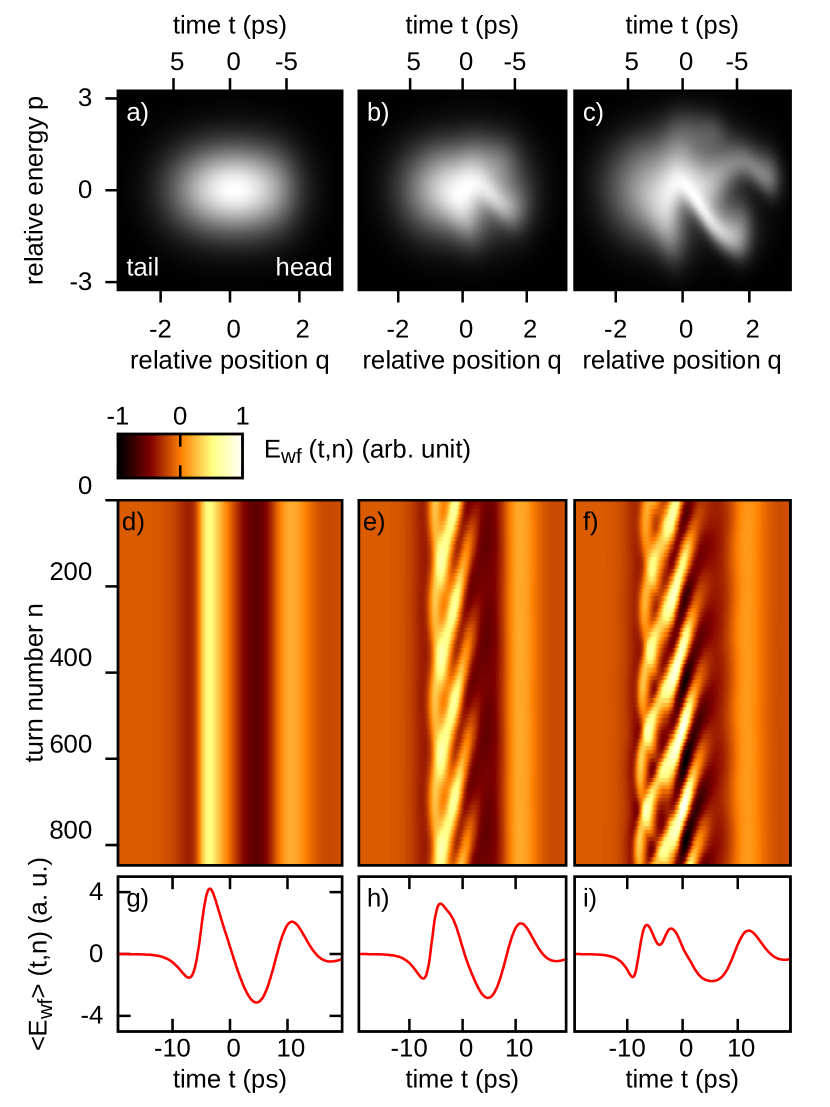
We have then performed numerical integrations of analytic models, to make a comparison with these experimental data (obtained for the first time in a short-bunch mode), and also to access the 2D longitudinal phase-space. We present here the results obtained with one of the most elementary models: the one-dimensional Vlasov-Fokker-Planck model with shielded CSR wakefield Venturini and Warnock (2002). The evolution of the electron density is described by the phase space distribution , where is the time associated to the number of round-trips in the ring, and and are longitudinal coordinate, and electron energy variables respectively. The dynamical evolution of is determined by the following Vlasov-Fokker-Planck equation Venturini and Warnock (2002):
| (3) |
The time associated to round-trips is a dimensionless variable: , where is the time (in seconds) and is the synchrotron frequency. The longitudinal position and relative momentum are the deviation from the so-called synchronous electron (with position and energy ). and are expressed in units of the equilibrium bunch length and energy spread at zero current: , and . , where is the synchrotron damping time. , with is the average beam current (), the dipole radius of curvature, and the revolution period. All parameters are in MKS units.
The interaction between electrons is described by the term which represents the electron bunch wakefield (expressed in V/m, per Ampere of average current in the storage ring). We use here the CSR wakefield created by an electron bunch in a circular trajectory, between two parallel plates with distance 2h. The exact expression of is well known Murphy et al. (1997), and detailed in Roussel et al. (2014b). Integration of Eq. (1) is performed using the semi-Lagrangian scheme, described in Ref. Warnock and Ellison (2000), and parameters are listed in the figure 4 caption.
Figure 4 shows the results of the numerical integration of equation (1) for three bunch charges pC, 94.4 pC and 141.6 pC. We retreive here qualitatively important features observed experimentally. Below the instability threshold, no micro-structures are observable on the phase-space [Fig. 4(a)] and the shape of the electron bunch is constant from turn-to-turn [Fig. 4(d)]. Just above the instability threshold, ”branches” continuously appears on the bottom part of the phase-space, and display a rotational motion at the synchrotron frequency [see Fig. 4(b) and supplemental movie]. As a main consequence, the wakefield presents an oscillation which is drifting toward the bunch head [Fig. 4(e)]. For higher currents, the micro-structures are more prominent [see Fig. 4(c) and supplemental movie] and can reach the upper part of phase space. In this case, the wakefield [Fig. 4(f)] also presents an oscillation which is drifting toward the tail of the bunch (in addition to the oscillation drifting to the head).
We believe that the availability of this new type of data (CSR pulse shapes versus round-trips) is a precious tool for testing models of bunch dynamics (including wakefields), in a more clear-cut way than with classical means (i.e., average spectra, THz pulse energies, microbunching instability threshold, etc.). In the example presented here (where one of the most elementary model of wakefields is used), agreement as well as differences can clearly be seen. For instance below threshold, the wakefield displays a longer period in the numerical simulation [Fig. 4(g)] than experimentally [Fig. 3(g)]. This may be attributed to differences in the wakefield modeling and/or in filter effects in the beamline wich are not taken into account in the modeling. Differences at higher current are also perceptible, as experimental data [Fig. 3(c)] are more irregular than numerical ones [Fig. 4(f)]. We think that such comparisons of numerical and experimental diagrams can now be used as an important guide for the modeling process, including the crucial work of accelerator impedance modeling.
In conclusion, it is now possible to analyze in a complete way the coherent synchrotron radiation emission due to short electron bunches in storage rings. As a main result, we could directly visualize the predicted transition between a stable THz coherent emission (due to the “bunch shortness”) and the emission due to the so-called microbunching instability. In the future, we believe that this viewing of CSR dynamics enables new and stringent tests for modeling the present and future storage ring facilities.
In another perspective, there results show that THz spectra can be obtained at a MHz repetition rate, paving the way for ultra high repetition rate time resolved THz spectroscopy.
We would like to thanks Menlo Systems for important advices. The work has been supported by the BQR of Lille University (2015), by the Ministry of Higher Education and Research, Nord-Pas de Calais Regional Council and European Regional Development Fund (ERDF) through the Contrat de Projets État-Région (CPER) 20072013, and by the LABEX CEMPI project (ANR-11-LABX-0007).
References
- Carr et al. (2001) G. L. Carr, S. L. Kramer, J. B. Murphy, R. P. S. M. Lobo, and D. B. Tanner, Nucl. Instrum. Methods Phys. Res., Sect. A 463, 387 (2001).
- Abo-Bakr et al. (2002) M. Abo-Bakr, J. Feikes, K. Holldack, G. Wüstefeld, and H.-W. Hübers, Phys. Rev. Lett. 88, 254801 (2002).
- Byrd et al. (2002) J. M. Byrd, W. P. Leemans, A. Loftsdottir, et al., Phys. Rev. Lett. 89, 224801 (2002).
- Mochihashi et al. (2006) A. Mochihashi, M. Hosaka, M. Katoh, M. Shimada, and S. Kimura, EPAC 2006 THPLS042, 3380 (2006).
- Karantzoulis et al. (2010) E. Karantzoulis, G. Penco, A. Perucchi, and S. Lupi, Infrared Physics & Technology 53, 300 (2010).
- Barros et al. (2013) J. Barros, C. Evain, L. Manceron, et al., The Review of scientific instruments 84, 033102 (2013).
- Billinghurst et al. (2015) B. E. Billinghurst, J. C. Bergstrom, C. Baribeau, et al., Phys. Rev. Lett. 114, 204801 (2015).
- Steinmann et al. (2015) J. L. Steinmann, M. Brosi, E. Bruendermann, et al., 2015 International Particule Accelerator Conference (2015).
- Tammaro et al. (2015) S. Tammaro, O. Pirali, P. Roy, et al., Nature communications 6 (2015).
- Abo-Bakr et al. (2003) M. Abo-Bakr, J. Feikes, K. Holldack, et al., Phys. Rev. Lett. 90, 094801 (2003).
- Mathis et al. (2003) Y.-L. Mathis, B. Gasharova, and D. Moss, Journal of Biological Physics 29, 313 (2003).
- Feikes et al. (2011) J. Feikes, M. von Hartrott, M. Ries, et al., Phys. Rev. ST Accel. Beams 14, 030705 (2011).
- Martin et al. (2011) I. P. S. Martin, G. Rehm, C. Thomas, and R. Bartolini, Phys. Rev. ST Accel. Beams 14, 040705 (2011).
- Barros et al. (2015) J. Barros, C. Evain, E. Roussel, et al., Journal of Molecular Spectroscopy 315, 3 (2015).
- Stupakov and Heifets (2002) G. Stupakov and S. Heifets, Phys. Rev. ST Accel. Beams 5, 054402 (2002).
- Venturini and Warnock (2002) M. Venturini and R. Warnock, Phys. Rev. Lett. 89, 224802 (2002).
- Roussel et al. (2014a) E. Roussel, C. Evain, C. Szwaj, et al., Phys. Rev. Lett. 113, 094801 (2014a).
- Katayama et al. (2012) I. Katayama, H. Shimosato, M. Bito, et al., Applied Physics Letters 100, 111112 (2012).
- Müller et al. (2012) F. Müller, P. Peier, V. Schlott, et al., Phys. Rev. ST Accel. Beams 15, 070701 (2012).
- Hiller et al. (2014) N. Hiller, A. Borysenko, E. Hertle, et al., Proceedings of IBIC2014 (2014).
- Coppinger et al. (1999) F. Coppinger, A. S. Bhushan, and B. Jalali, IEEE Trans. Microw. Theory Techn. 47, 1309 (1999).
- Goda and Jalali (2013) K. Goda and B. Jalali, Nature photonics 7, 102 (2013).
- Roussel et al. (2015) E. Roussel, C. Evain, M. Le Parquier, et al., Scientific Reports 5, 10330 (2015).
- Ahmed et al. (2014) S. Ahmed, J. Savolainen, and P. Hamm, Review of Scientific Instruments 85, 013114 (2014).
- Savolainen et al. (2013) J. Savolainen, S. Ahmed, and P. Hamm, Proceedings of the National Academy of Sciences 110, 20402 (2013).
- Tordeux et al. (2012) M.-A. Tordeux, J. Barros, A. Bence, et al., 2012 International Particule Accelerator Conference , 1608 (2012).
- Szwaj et al. (2016) C. Szwaj, C. Evain, M. L. Parquier, et al., arxiv , 1607.07168 (2016).
- Jiang and Zhang (1998) Z. Jiang and X.-C. Zhang, Applied Physics Letters 72, 1945 (1998).
- Wilke et al. (2002) I. Wilke, A. M. MacLeod, W. A. Gillespie, et al., Phys. Rev. Lett. 88, 124801 (2002).
- Steffen et al. (2009) B. Steffen, V. Arsov, G. Berden, et al., Phys. Rev. ST Accel. Beams 12, 032802 (2009).
- Wong et al. (2011) J. Wong, H. Q. Lam, R. M. Li, et al., J. Lightwave Technol. 29, 3099 (2011).
- Sannibale et al. (2004) F. Sannibale, J. M. Byrd, A. Loftsdóttir, et al., Phys. Rev. Lett. 93, 094801 (2004).
- Kuske (2009) P. Kuske, PAC09 , 4682 (2009).
- Evain et al. (2012) C. Evain, J. Barros, A. Loulergue, et al., EuroPhysics Letters 98, 40006 (2012).
- Roussel et al. (2014b) E. Roussel, C. Evain, C. Szwaj, and S. Bielawski, Phys. Rev. ST Accel. Beams 17 (2014b).
- Judin et al. (2012) V. Judin, N. Hiller, A. Hofmann, et al., IPAC12 , 1623 (2012).
- Bartolini et al. (2011) R. Bartolini, G. Cinque, I. Martin, G. Rehm, and C. Thomas, IPAC11 , 3050 (2011).
- Billinghurst et al. (2016) B. E. Billinghurst, J. C. Bergstrom, C. Baribeau, et al., Phys. Rev. Accel. Beams 19, 020704 (2016).
- Murphy et al. (1997) J. B. Murphy, S. Krinsky, and R. L. Gluckstern, Part. Accel. 57, 9 (1997).
- Warnock and Ellison (2000) R. L. Warnock and J. A. Ellison, SLAC PUB , 8404 (2000).