Laboratory von Hámos X-ray Spectroscopy for Routine Sample Characterization
Abstract
High energy resolution, hard X-ray spectroscopies are powerful element selective probes of the electronic and local structure of matter, with diverse applications in chemistry, physics, biology and materials science. The routine application of these techniques is hindered by the complicated and slow access to synchrotron radiation facilities. Here we propose a new, economic, easily operated laboratory high resolution von Hámos type X-ray spectrometer, which offers rapid transmission experiments for X-ray absorption, and is also capable of recording X-ray emission spectra. The use of a cylindrical analyzer crystal and a position sensitive detector enabled us to build a maintenance free, flexible setup with low operational costs, while delivering synchrotron grade signal to noise measurements in reasonable acquisition times. We demonstrate the proof of principle and give examples for both measurement types. Finally, tracking of a several day long chemical transformation, a case better suited for laboratory than synchrotron investigation, is also presented.
I Introduction
Spectroscopies based on the absorption of hard X-rays by core electrons are powerful element specific probes of the local nuclear and electronic structure Bunker (2010); Koningsberger and Prins (1987); Stern and Heald (1983). X-ray absorption near edge structure (XANES) investigates the intensity and position of the features in a 50–100 eV region around the absorption edge to extract information on valence and spin states as well as coordination number. Extended X-ray absorption fine structure spectroscopy (EXAFS) gives a local structural description of the environment of the studied atom, complementary to X-ray or neutron diffraction, with the advantage of element selectivity, but without the requirement of long range order. X-ray emission spectroscopy (XES) complements X-ray absorption spectroscopies (XAS): while XANES traces the lowest-lying unoccupied electronic levels, the fluorescent photons appearing after the core hole excitation by the incoming hard X-rays, which make up the XES spectra, provide information about the occupied electronic states.
Benefiting from these spectroscopic techniques requires a high brilliance hard X-ray source providing sufficient photon flux, combined with a monochromator providing a narrow energy bandwidth necessary to resolve the variations of the absorption coefficient around a specific absorption edge of an element in XAS or the fine structure of the fluorescence spectra in XES. The development of the generation synchrotrons made hard XAS, XES and related techniques available to frontier researchBunker (2010); Glatzel and Bergmann (2005); de Groot (2001), even at extreme conditions and low concentration.Torchio, Mathon, and Pascarelli (2014); Rueff and Shukla (2010); Rovezzi and Glatzel (2014) The technique evolved quickly and both XAS and XES have developed into indispensable tools in many disciplines including materials and earth sciences, biology and chemistry.
In addition to frontier research, there is a high demand for X-ray spectroscopies as routine characterization tools in most universities and research institutes. Due to the required high brilliance and energy scanning, X-ray spectroscopy experiments are normally performed at synchrotron beamlines. The exploitation of these techniques is thus hindered by the limited accessibility, and high relative price. The limited number of these oversubscribed beamlines, and the relatively slow proposal review and scheduling system leads to a 6–12 month waiting period. Even industrial customers, with sufficient budget to purchase the expensive beamtime, have a long wait before their experiment can be scheduled. Many modern research projects cannot wait months for simple answers, and thus X-ray techniques are often ignored. Moreover, synchrotrons provide only short access periods (typically a few days), which makes long-term studies hardly possible. Thus, chemical reactions or biological processes with time scales longer than a couple of days are also excluded. Furthermore, the high X-ray flux provided by modern synchrotron sources often exceed the requirements for routine samples, and therefore an otherwise important experiment wastes precious resources. Finally, another disadvantage of the dependence of XAS and XES methods on synchrotrons is that their rare accessibility does not favor the involvement and proper training of the new generation of X-ray scientists/students, and it is even more difficult to popularize it among a wider user community.
Traditional laboratory XAS has been very time consuming due to the low brilliance of radiation from X-ray tubes. However, advances in monochromatization, detection technology, and sources offer new convenient and affordable solutions for assembling such an instrument. In a recent pioneering work G. Seidler and coworkers Seidler et al. (2014); Mortensen et al. (2015); Seidler et al. (2015) have reported a new spectrometer that allows laboratory XAS and XES investigations. It is based on a 1m-diameter Rowland-circle spectrometer, where a spherically-bent Johann analyzer crystal serves as a monochromator, which selects a single wavelength from the radiation of a bright microfocus X-ray source and focuses it on a sample placed in front of a Silicon drift diode (SDD) detector. During acquisition, the X-ray source, the crystal and the detector are all translated to maintain the Rowland circle geometry for each wavelength during the energy scan. The inner space is filled with He to reduce air absorption in the almost 2m path inside the spectrometer. The results confirmed that XAS and XES spectra can be indeed acquired with sufficient count rates in acceptable time frames with the same resolution as is the case with synchrotrons Seidler et al. (2014). The presented the K absorption edge of a Co foil were taken for 80s/point, which would require ca. 6.5 hours net acquisition time for a 300 point XANES spectrum. A complete K XES spectrum of a CoO sample requires about the same acquisition time. While the performance of this apparatus is respectable, it’s operation requires simultaneous precise movements of the source and sample, analyzer, and detector. This might render the experimental setup less flexible, not compatible with complex sample environments, and also requires maintenance. Moreover, the instrument is also relatively bulky, and requires a substantial amount of expensive He gas for the operation.
Recently, table-top high-resolution X-ray spectrometers using a different working principle have also been realized, which are based on a laser-powered plasma X-ray source and an energy-dispersive cryogenic microcalorimeter detector.Uhlig et al. (2013); Joe et al. (2016) Such instruments offer the possibility of ultrafast time resolved XAS and XES studies in the laboratory. However, their energy resolution lags behind those of the wavelength dispersive spectrometers. The limitations on the overall detected count rates can also be disadvantageous. Moreover, this type of setup will hardly be available to a wide community due to the large construction and maintenance costs.
We propose an alternative approach using a spectrometer based on cylindrical analyzer crystals in the von Hámos geometry Szlachetko et al. (2012). These crystals are bent perpendicular to the desired X-ray propagation plane to focus as many photons as possible onto the detector, but flat in the parallel direction to map the energy dispersed spectrum to different detector positions. The von Hámos geometry, which is used more and more at synchrotrons and X-ray free electron lasers,Szlachetko et al. (2012); Alonso Mori et al. (2012); Hoszowska and Dousse (2004), has rarely been used in laboratory based hard X-ray spectrometers. The first examples for dispersive-mode laboratory X-ray spectrometers adapted flat single crystals to monochromatize the white X-ray radiation of common sourcesLecante et al. (1994); Inada, Funahashi, and Ohtaki (1994), but the lack of the focusing bending of the von Hámos type analyzers in these cases hamper both count rate and resolution. C. Schlesiger et al. built an XAS spectrometer based on a HOPG mosaic crystal.Schlesiger et al. (2015) Although it could produce both XANES and EXAFS spectra of a Ni foil, it is optimized for lowering the necessary acquisition time but cannot provide enough resolution to resolve the fine structure of the XANES spectra. Y. Kayser et al. assembled recently a von Hámos spectrometer for XES with a 0D SDD detector, which can track or scan a specific energy from the analyzer, but does not exploit the potential of the von Hámos geometry.Kayser et al. (2014)
The herein proposed instrument uses a single Si crystal (which can be upgraded to e.g. Ge) analyzer to obtain high energy resolution. In order to make it more economical, instead of bending, a segmented analyzer was used. This has been prepared by cutting narrow strips from a single crystal wafer, and the resulting set of crystals are glued to a cylindrical substrate of 250 mm radius Szlachetko et al. (2012). This projects a wavelength-dispersed spectrum to the detector, which should be a spatially resolving, 1- or 2-dimensional pixel detector. As a spectrum range spanning several hundred eVs is collected simultaneously, there is no need for scanning, thus the whole setup is fixed during the acquisition for a given energy region, for example the XANES region around a given elemental absorption edge. Furthermore, the spectrometer is relatively small, does not require He or vacuum, and can operate even with conventional X-ray tubes at relatively small power. Easily exchangeable fixed setups can be prepared for different edges, with crystal and detector mounts arranged on portable breadboards. Alternatively, such mounts can be motorized to drive the crystal and detector into appropriate positions for different edges.
This spectrometer can easily give fast feedback on valence- and spin state as well as local geometry selectively for a wide range of elements with a very moderate operational cost. The spectrometer is easy to operate and doesn’t rely on scanning motors or special environments. The von Hámos method has the advantage of measuring the full spectra at once, while the Johann spectrometer, which works with scanning spherically bent crystals, focuses only a single wavelength, a clear advantage at low count rate experiments. In this sense the two setups are complementary, and not competitive. Typically, the count rate in a given channel between the two setups (using 25 cm radius segmented crystals for the von Hámos vs. a 1 m radius Johann crystal) differ by a factor of 20. When many channels (20) need to be scanned, and the signal to noise ratio is satisfactory, von Hámos is more advantageous. Many experiments with low count rates and bad S/N conditions would not have been possible with a von Hámos setup in a reasonable time (e.g. refs Vankó et al., 2010; March et al., 2015). On the other hand, in most cases with high count rate and sufficient S/N, which seem to include laboratory XANES, the experiments can be substantially faster with the von Hámos than with Johann.
In this paper we outline the new setup based on the above-mentioned approach: a quick response and cost-effective high resolution von Hámos type laboratory X-ray spectrometer capable of recording either XAS or XES spectra. After describing the necessary components and the actual setup, we test the working method with an energy sensitive point (0D) detector and analyze potential distortions of the spectral shape. Afterwards we show examples for a K-edge XANES spectra of Ni and Co based compounds, demonstrating the chemical sensitivity of the method. We also describe an example for tracking a long chemical reaction with the case of the hydrolysis of a Ni(IV) compound. Finally, we demonstrate the capability of XES spectroscopy with K and K spectra of CoO and the K spectrum of a Ni-foil.
II Experimental
The three main components of the laboratory X-ray spectrometer are a fixed X-ray tube, a von Hámos type cylindrical analyzer crystal and a position sensitive detector.
A conventional water-cooled Seifert DX-Cu 12x0.4-s X-ray tube was used for this experiment. The electron beam is focused onto a copper anode, with dimensions of . In the so-called point focus geometry, which was exploited in the present work, the emitted X-rays are taken by a window at elevation angle, with the projected source size of (focusing and dispersing directions, respectively). The radiation at 25 cm from the tube was measured to have a quasi-circular shape with a diameter of ca. 33 mm. The X-ray tube was operated at 10 kV voltage and 40 mA (XAS) as well as 60 mA (XES) currents for all measurements. The X-ray flux at the exit window of the tube was measured using a Silicon Drift Diode (Amptek) detector. The X-ray tube was set to 10 kV and 2 mA (the lowest working current), and the flux was further attenuated by a 1.56 m thin Al foil. Applying the corresponding corrections, the estimated flux extrapolated for 40 mA tube current is 1.5 109 photons/(smm2) for a 300 eV wide Ni K edge absorption spectrum, e.g. shown in Fig. 8A, or 5.2 109 photons/(smm2) for photons with energy between the absorption edge of Ni (8333 eV) and the 10 keV upper limit of the present XES measurements, using 60 mA tube current.
The von Hámos analyzer used was composed of segments of 300 m thin Si(111) wafers, arranged on a cylindrical substrate with 250 mm bending radius, with total crystal size of 50 mm 100 mm (dispersion focusing).
A position sensitive 1 dimensional Dectris Mythen 1K detector was used to record the dispersed X-ray photons during the experiments. The detector consists of 1280 pixels with 50 m pixel size in the dispersive direction and 8 mm height. The threshold was set – if not indicated differently – to 8 keV and 5 keV for the Ni and Co K edges, respectively, and a 2 mm high lead-foil slit was placed in front of the detector to match the focus size of the segmented analyzer, and thus reduce background. Energy was calibrated using EXAFS standard metal foils and additionally appearing K fluorescent peaks (Cu radiation in the case of the Co XAS spectra, Fe K lines from Si(333) reflections in the case of Ni XAS spectra). Alternatively, an energy sensitive Amptek X-123 0D Silicon drift detector (SDD) was also used to measure the energy spectrum of the radiation at the detector position. The active detector surface is 25 . The energy of the 0D SDD detector was calibrated with a radioactive \ce^57Co source in a Rh matrix, using its emitted Fe K and Fe K radiation, as well as the 14.412 keV nuclear transition of the nucleogenic \ce^57Fe and the Rh K fluorescence.
The samples used for the transmission mode XAS experiments were measured in the form of a 13 mm diameter pellet stuck between two pieces of 25 m Kapton tape. All these samples were mixed with cellulose as a solid solvent except the \ceK2NiF6, which was mixed with boron nitride to avoid too fast decomposition. The composition of the pellets was optimized to get an ideal edge jump of 1 in and was calculated by the ABSORBIX (v3.2) module of the MAX software packageAlain et al. (2009). During the measurements the samples were placed right in front of the exit window of the X-ray tube. All the measurements were carried out in air atmosphere. For the X-ray emission measurements, pristine samples of the compounds were pressed into pellets and positioned as described in Section III.2.
III Spectrometer setup
III.1 X-ray absorption spectrometer
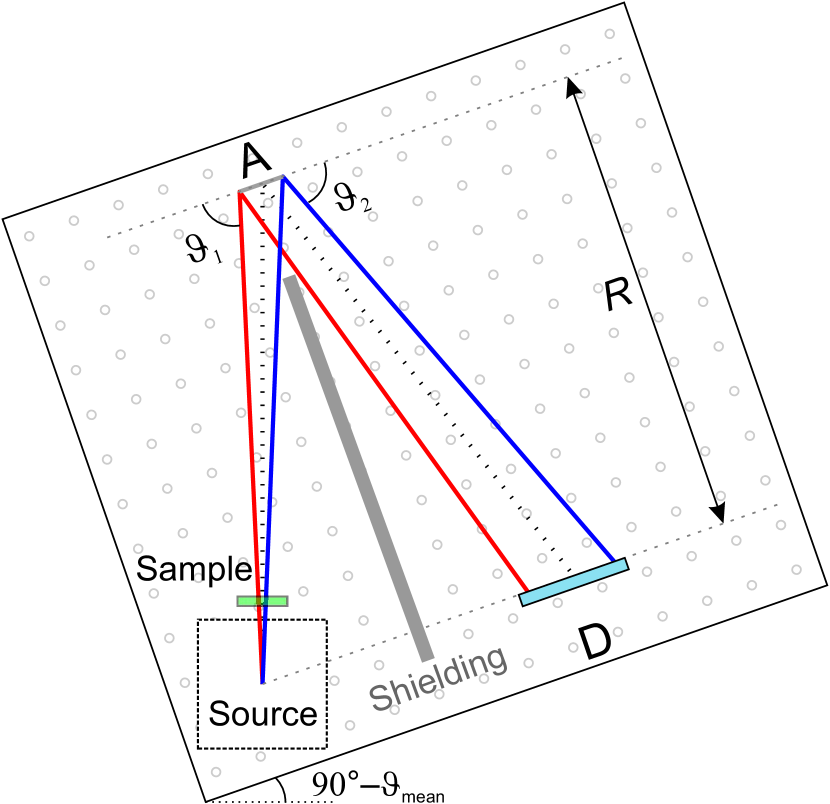
The configuration of the X-ray absorption spectrometer is depicted in Fig. 1. Both the analyzer crystal and the detector are mounted on a common breadboard, which is partially fixed in a way that in order to be able to optimally position the analyzer crystal in the X-ray beam, it can be rotated with a rotation center exactly below the fixed X-ray source. The positions of the analyzer and detector are calculated to fulfill the Bragg-diffraction of the investigated energy range and the = 250 mm focusing radius of the crystal (cf. red and blue lines in Fig. 1 simulating the propagation of photons with lower and higher energy, respectively). The crystal and the detector are on a 3-axis positioning stage with the possibility for tilting or rotation. Most importantly, the setup includes two long parallel linear translation stages separated by , which, after the initial alignment, are the only ones needed to change the measured energy range (to extend it, or to reach a different edge). This setup allows a several hundred electronvolt wide energy range to be recorded without the need to move any part of the spectrometer. The sample can be placed anywhere in the beam path, however, the optimal position is the closest to the source. The spatial inhomogeneity in the effective thickness of the sample can introduce unwanted intensity variations in the transmitted spectrum, thus the smaller the area of the sample irradiated, the better. Moreover, as the present setup measures only an energy range of a few hundreds of electonvolts, the absorption edge jump cannot be normalized exactly to unity. In order to achieve the best signal to noise ratio, appropriate shielding is necessary to prevent the measured spectrum from being contaminated with unwanted scattered X-rays. The actual setup for absorption measurement is shown in Fig. 2 without the lead shielding.
III.2 X-ray emission spectrometer
In the case of the X-ray emission spectroscopy setup, the source is no longer the anode surface in the X-ray tube, but the excited part of the sample. The Bragg geometry will then be calculated from this origin for the positions of the analyzer and the detector. For the effective recording of the fluorescent photons, the analyzer is best situated perpendicular to the irradiating X-ray beam and the sample is rotated 45∘ to face both the X-ray tube and the crystal. As the diverging radiation of the X-ray tube excites the sample on a several mm wide surface, the source for the XES becomes big, decreasing the resolution to an unacceptable level. Thus, the sample emission has to be slitted down to have a sub-millimeter projection into the direction of the analyzer.

IV Results
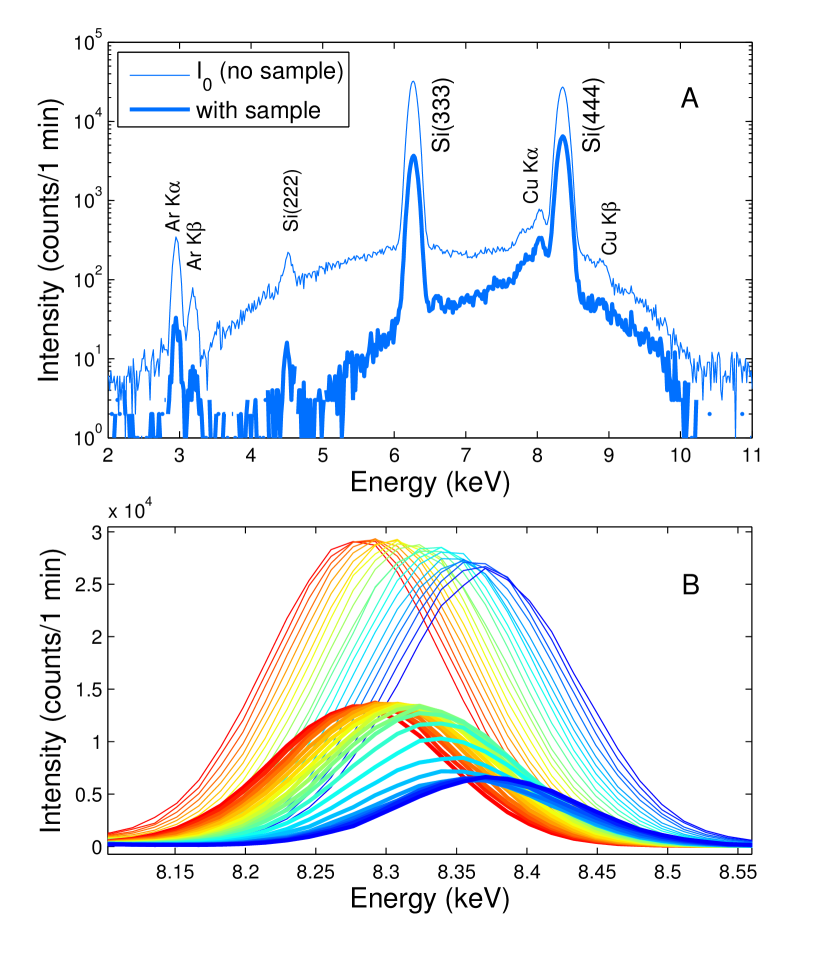
B: Dispersion of the Si(444) peak during a detector position scan along the dispersive plane, from the low- to high energy side (direction from red to blue in Fig. 1. Thin and thick lines denote again spectra recorded with and without NiO).
IV.1 Correlation of detector position and energy
First we explored the energy spectra of the X-ray radiation diffracted by the crystal and recorded at the detector position along the dispersive plane with the energy-dispersive SDD placed in the focus of the analyzer. The measurements were performed with and without a NiO absorber in the sample position and with the analyzer crystal aligned to diffract energies around the Ni K-edge. The energy spectrum, shown in Fig. 3A, reveals a very wide reflected Bremsstrahlung background, from which the Si(111) crystal reflects intense narrow bands through its diffraction harmonics. Additionally, fluorescence from the Cu tube and the Ar in the air contributes to the background. Translating the 0D detector along the dispersive plane, the Si(111) harmonic peaks drift in energy, as expected from the working principle of the von Hámos spectrometer. This is shown in Fig. 3B for the Si(444) reflection and X-ray energies around the Ni K-edge. Without an absorber, the reflected intensity is almost flat, this corresponds to the of the XAS.
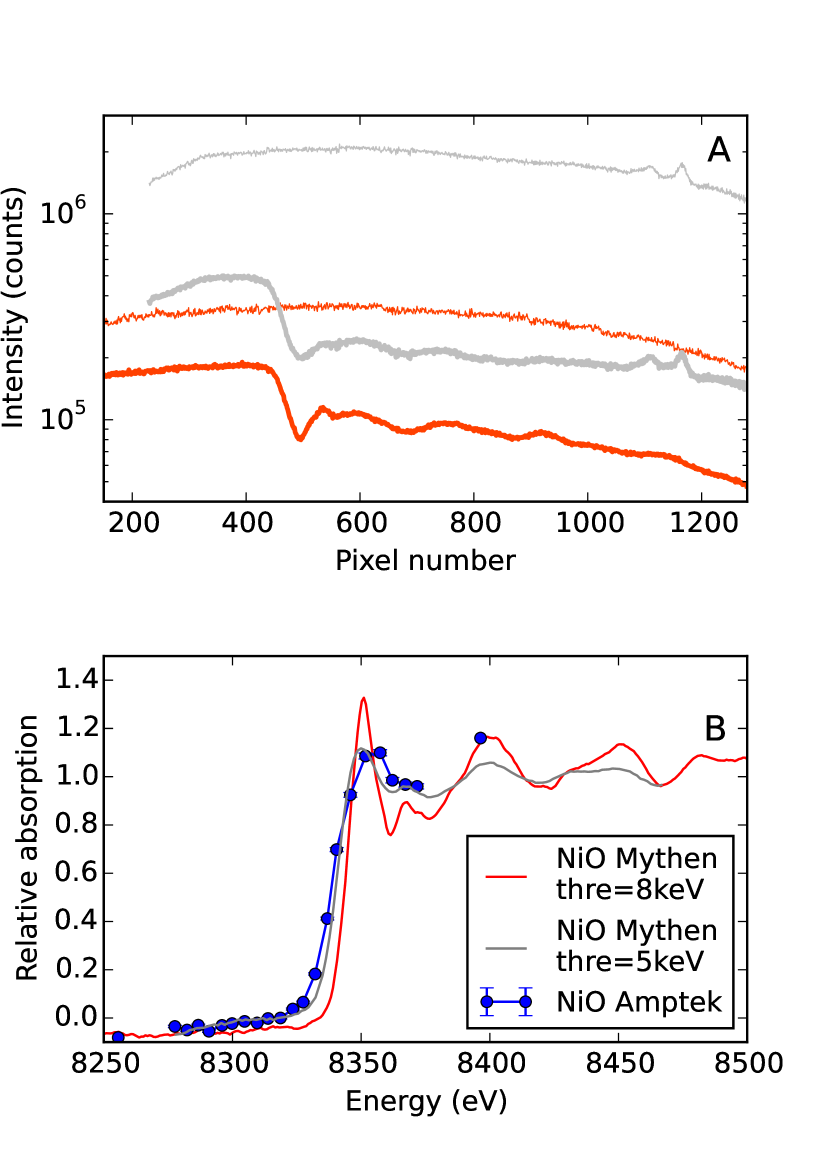
With a NiO sample in the beam, a drop in the detected intensity is noticed with additional intensity variations when the diffracted energy is higher than the Ni K-edge, as seen on the lower intensity peaks in Fig. 3B. Indeed, from the logarithm of the ratio of measured intensities the energy dependence of the absorption can be plotted, and it unveils the absorption edge, as is shown in Fig. 4B as dots. Although the procedure described above is useful to characterize the spectrometer, it is not a practical method to measure the absorption spectra. Moreover, the big surface of the Amptek sensor decreases the energy resolution considerably, as seen in Fig. 4B. The Mythen detector, on the other hand, can measure the intensity simultaneously at 1280 detector positions with 50 m pitch size. Fig. 4A shows the Mythen-detected spectra again with and without the NiO sample, as reflected by the von Hámos Si(111) analyzer crystal (at 69.7∘ mean Bragg-angle) with two different detector threshold settings, while Fig. 4B compares the normalized XANES spectra of the same sample measured with both detectors. In Fig. 4A two sets of and NiO transmission spectra is shown: one with detecting in a wide energy window using a low (5 keV) threshold and one with a narrow energy window (8 keV threshold), indicated as gray and red curves, respectively. The former settings let the detector capture about one order of magnitude more photons, while the latter may cut in the number of photons even in the energy range of interest. However, the fine structure is clearly damped with the low threshold due to the high background, a relevant part of which originates from the 3rd harmonics contribution (cf. Fig. 3A). Unless one uses an SDD grade discrimination, the role of this background contribution remains an important issue, as analyzed in section IV.2. (In the low-threshold data a pair of peaks is visible between pixels 1100 and 1200, which stem from the iron K fluorescence lines via the Si(333) reflection and arising from X-ray tube anode impurities. This is gone when the threshold exceeds 6.4 keV.)
The energy range covered by the setup is determined by the size of the Mythen detector along the dispersive axis (provided that the X-ray beam spot is sufficiently large on the analyzer). At the Ni K-edge with Si(444) diffraction and for the length of the detector of 64 mm, an energy range of about 320 eV is obtained. Since the detector consists of 1280 pixels with a 50 m pixel size, the sampling intervals on the energy axis are calculated to be about 0.25 eV/pixel. In order to utilize the same setup for EXAFS measurements, a longer energy range will require data collection at different angles, which requires translating the analyzer and the detector to a set of different positions, and turning the base plate accordingly. In this case, sample inhomogeneity, differences in collection geometry and detector (pixel) sensitivity have to be carefully investigated, as similar to data acquisition at synchrotrons, any systematic errors can compromise the data quality.
The spectrometer resolution is determined as the convolution of several factors. First the X-ray diffraction crystal introduces broadening at the level of the Darwin width, which is about 0.1 eV. Since we employed a segmented-type crystal for the X-ray diffraction, we do not expect additional broadening, as is observed for bent-crystals where the strain causes significant degradation of the resolution. Second, the spatial resolution of the detector will contribute to the total energy resolution by about 0.25 eV. The third factor is the source size in the dispersive plane. As used in the experiments, the X-ray tube is characterized by a 400 m spot size, which at the Ni K-edge energy and Si(444) diffraction gives rise to about 2 eV broadening. The total resolution is calculated as the convolution of these three factors, and therefore the setup resolution is estimated to be 2 eV, primarily due to the effect of the employed source size. Since the spectral sampling of 0.25 eV is much smaller than the energy resolution of the setup, the measured data can be binned by a factor 4-6 without introducing any further loss of energy resolution to spectral features, resulting in a spectrum with 1-1.5 eV step size. Should the experiment require, the energy resolution can thus be increased by using a microfocus X-ray tube with a source size of some tens of micrometers or slitting the available X-ray radiation.
With the present setup, in about 2 hours more than counts per pixel can be achieved for even with the higher (8 keV) threshold, which clearly shows that the experiment is not count-rate limited. From Fig. 4A we note that the incident X-ray flux equals 50 photons/(pixels) (i.e. 200 photons/(eVs)). The spectrometer is operated in counting mode, therefore the spectral quality will be directly correlated with the statistical error resulting from measured count rates. Consequently, for an acquisition time of 1 h the error of the measurement at the level of 0.12% for , and 0.33% for is achieved. The latter numbers may be used as estimate for detection limits of the setup.
IV.2 Effect of background on the spectral intensities
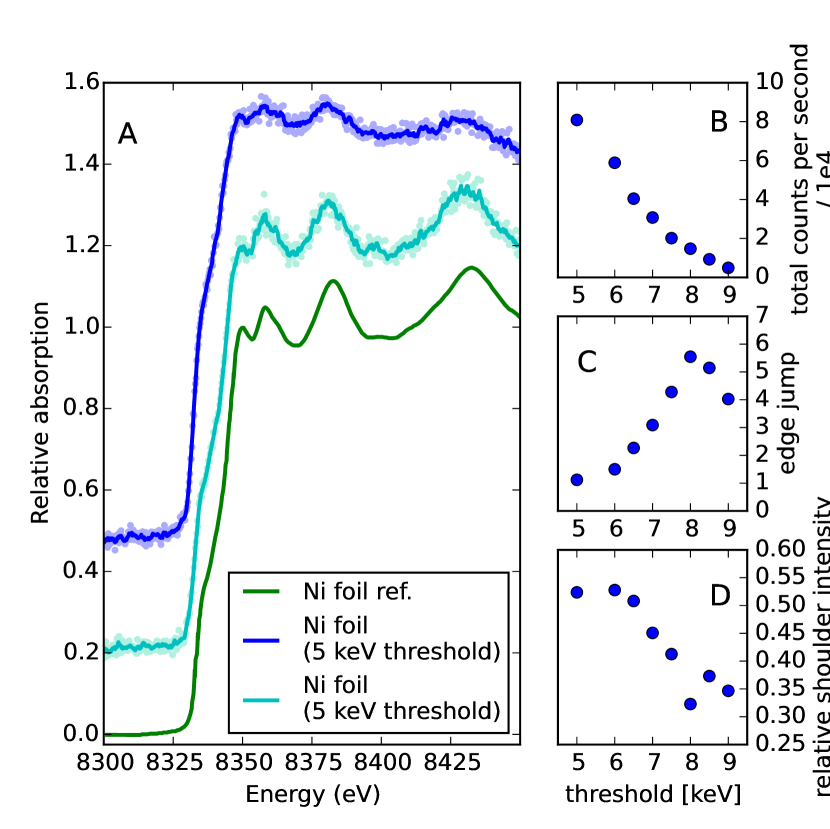
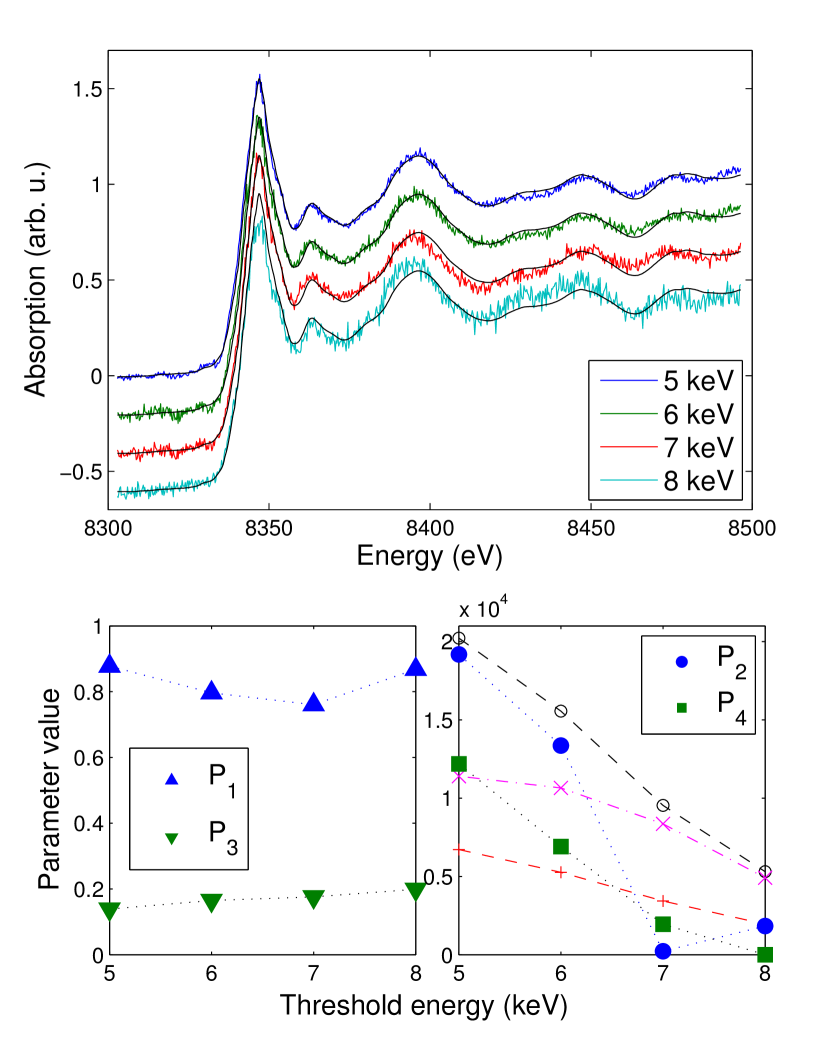
In order to investigate the effect of the background, first we recorded a set of quick XANES spectra in the laboratory on a Ni-foil, for a short (10 min) acquisition time, and at two different detector threshold settings (5 and 8 keV). These are shown in Figure 5, in raw and smoothed form, and they are compared to synchrotron data. While the absorption jump is very clearly visible in all spectra, at the lower threshold the fine structure appears smeared out, as it was also shown in Fig. 4B for the case of NiO. The reference and the higher threshold spectra shows a reasonable match, and all main features are visible in the laboratory spectrum, but a careful comparison reveals that it has an extra broadening due to a slightly decreased resolution of 2 eV. Although the non-monochromatic nature of our source does not allow the exact determination of the spectral resolution, this decrease may only come from the relatively large source size, which in our case is 0.4 mm in the dispersive direction. Both the analyzer crystal and the applied pixel detector have been used at synchrotrons where they were proved to be able to provide an energy resolution well below 1 eV Szlachetko et al. (2012). However, the present 2 eV resolution is more than enough to reveal most of the features of the XANES spectra, and the flux rate enables one to record a spectrum with sufficient quality in a few tens of minutes.
The effect of threshold on the absorption spectra is followed in the right panels of Fig. 5 with three characteristic parameters. As expected, the total number of photons recorded with the detector decreases monotonically with the increase of the threshold (Fig. 5B). However, the relative absorption jump in the absorption spectrum, calculated as the difference between the absorbance below and above the edge and normalized to the absorbance below the edge, increases with higher thresholds until about 8 keV (Fig. 5C). Finally, a characteristic and well comparable value is the relative intensities of different spectral features, for example, the height of the low-energy ( 8335 eV) shoulder to the edge in the normalized Ni foil absorption edge, which is around 0.35 in the reference spectra. This parameter is substantially deformed with lower thresholds, i.e. with considerably higher background flux both from other harmonics from the analyzer crystal and scattering fluorescence, as shown in Fig. 5D.
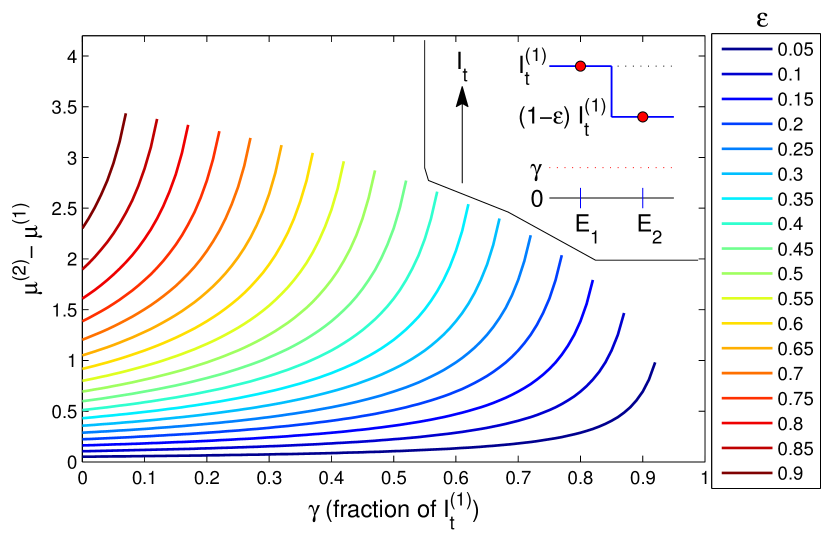
With a simple model we can examine how the observed (absorption coefficient) values vary with the background. For this, we select a pre-edge () and a post edge () energy point in a hypothetical XAS spectrum, expressing the intensities scaled to the transmitted intensity observed at the pre-edge, . Thus the intensity drop at is . The background at the two points can be approximated to be identical, denoted as , where . This is illustrated in the inset of Fig. 6. The absorption difference is described by the relation that follows:
| (1) |
The effect of the background, modeled by Eq. 1 is illustrated in Fig. 6 at different absorption jumps () and different background levels (). As it is seen from the figure, the distorsion effect of the background can be very large.
Next, we examine in a more detailed manner how spectra measured with background can be treated and compared to references. In case of harmonic contamination from the analyzer, the measured intensity without () and with () the sample can be approximated with the following terms:
| (2) | |||
| (3) |
where is the intensity of the radiation from the desired reflection, while is the background from other harmonics (approximated as ), while and is the background from fluorescence and scattering. Using the above relations, the absorption can be expressed as
| (4) |
In order to arrive to a model that can be directly compared with reference spectra, we need to introduce some further approximations, normalize the data to the unit edge jump, after flattening the pre-edge and the post-edge with the usual linear and quadratic approximations, respectively. With these, we arrive to what corresponds to the XAS , as seen in Eq. 5.
| (5) | ||||
The above equation can be fitted to the data to separate the background contributions and recover the true signal, with the as fit parameters. ( is a scale factor to produce unit edge jump, and are and approximated with constants, respectively, corresponds to the factor scaling the intensity through the wrong harmonics, and are for the linear pre-edge, and is the , and and flattens the post-edge, which is achieved with the heavyside step function . (Rigorously, , and are vectors corresponding to the length of the spectra with the identical or value for each components.)
Using the model in Eq. 5 to fit NiO spectra taken with different detector thresholds, the absorption spectrum can be reconstructed to reasonable accuracy, as shown in Fig. 7. The background parameters and show a decrease with the increase in the threshold, and while seems to slightly increase, its product with , which corresponds to the harmonic contamination, drops as the latter term also decreases rapidly. Further insights are blocked by the too many parameters in the model, which give rise to large correlations between physically formally independent parameters.
IV.3 Chemical sensitivity of K-edge XAS, at synchrotrons and in the lab
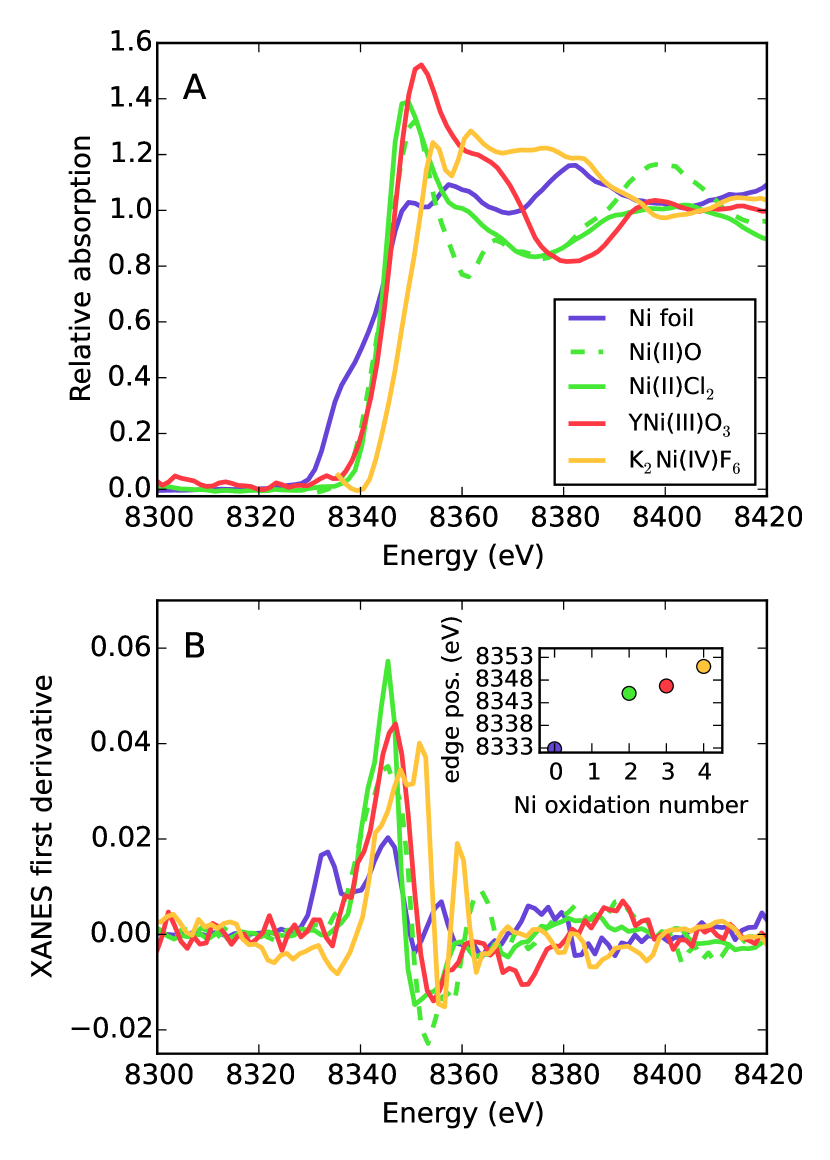
One of the most promising applications of a laboratory XAS spectrometer is the utilization of the high chemical sensitivity of the absorption edge of the selected metal atom. It is well known that the absorption edge position shifts towards higher energies with higher oxidation state of the investigated element due to the increase of the effective nuclear charge, even if a strict relationship between edge position and oxidation state can only be established for compounds with similar coordination sphere and approximately isotropic variations.Glatzel, Smolentsev, and Bunker (2009) During the past decades a complete set of absorption edge energies has been published for different elements with different oxidation-, spin- and coordination states, and the appropriate calibration compounds are also often easily accessible. Hence this method provides a quick way to characterize the electronic structure of any atoms in novel materials with an absorption edge in the energy range of hard X-rays.
In order to test the chemical sensitivity, we measured the K edge XANES of a few distinct Ni compounds: a metallic Ni-foil, divalent NiO, divalent \ceNiCl2, trivalent \ceYNiO3 and tetravalent \ceK2NiF6. The recorded absorption spectra (Fig. 8A) resemble well those in previous studies using synchrotron radiation Mori, Taga, and Yamashita (2015); Tirez et al. (2011); Medarde et al. (2009); Zhang et al. (2015); Woolley et al. (2011); O’Grady et al. (1996). The edge positions, determined as the maximum of the first derivative, clearly show the expected increasing trend with the oxidation state of nickel (see Fig. 8B and its inset).
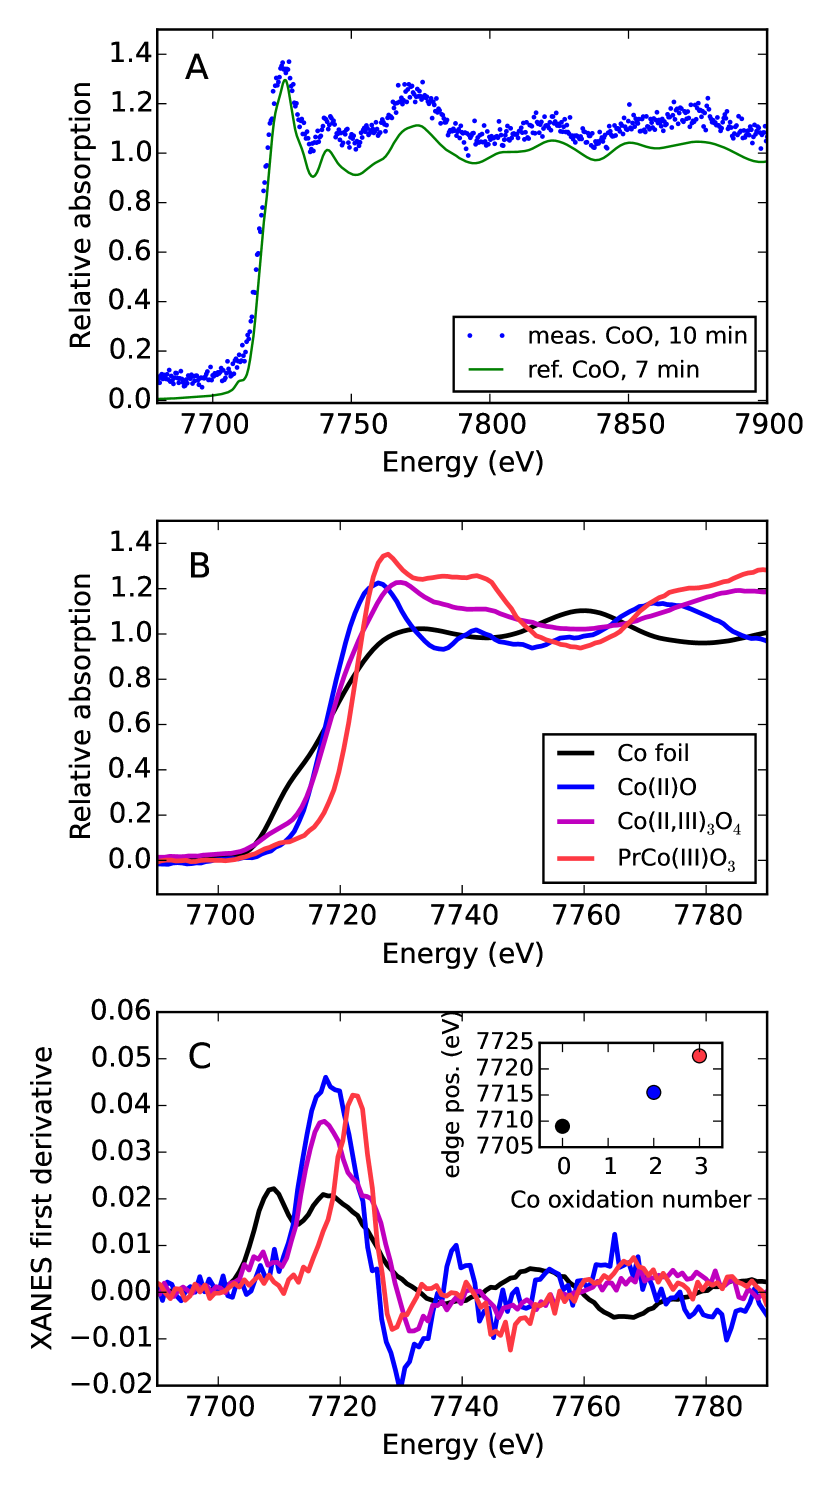
The flexibility of the presented setup allows us to reach other edges easily with the same setup. A linear translation of the analyzer crystal and (twice as much of) the detector to obtain 53.3∘ mean Bragg-angle at the Si(333) reflection, and the corresponding rotation of the spectrometer breadboard to bring the analyzer back in the beam makes the Co K edge accessible. In Figure 9 some selected Co K edge spectra are plotted, recorded with the laboratory spectrometer. In Fig. 9A a comparison between the laboratory spectrum and a synchrotron scan is shown for CoO powder sample. The acquisition times (10 min and 7 min) are comparable, and the resolution is enough to observe all main features of the edge jump and above the edge. It is worth noting that the decreased resolution smears out the sharp pre-edge peak, but this can be addressed if a microfocus X-ray tube is used as source. Figs. 9B and C showcase the chemical sensitivity of the present XAS spectrometer. A metallic cobalt foil, a divalent (CoO), a trivalent \cePrCoO3 and a mixed valence (\ceCo3^2+,3+O4) Co compound were measured and analyzed. The edge positions, deduced from the first derivative of the absorption curve, change monotonically with the oxidation state of the cobalt ion. Even the two distinct oxidation states in the mixed \ceCo3O4 oxide can be clearly separated.
IV.4 Applications: monitoring a slow chemical transformation
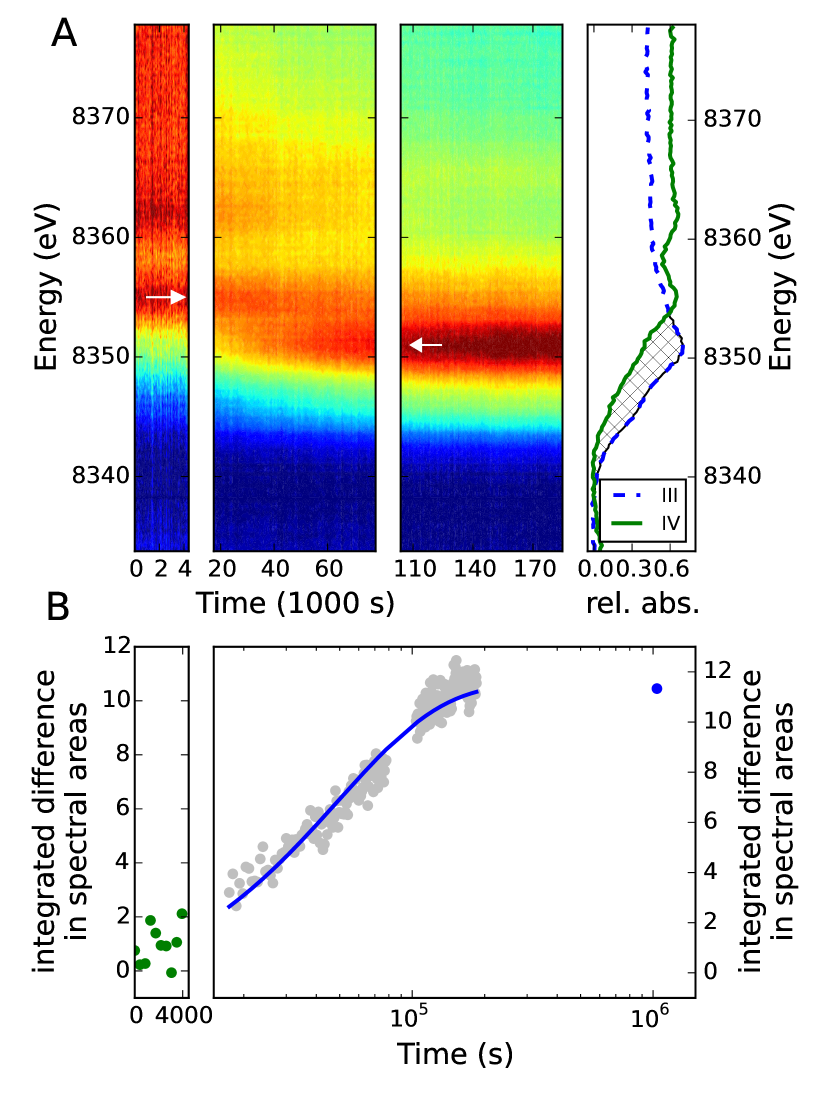
A typical case which cannot be performed at a synchrotron is the monitoring of slow chemical reactions. To demonstrate this, our selected example is the hydrolysis of \ceK2Ni(IV)F6 with humidity in the air. In this compound the unstable tetravalent state of the nickel ion reduces to trivalent in the presence of water. Depending on how efficiently the powder is sealed from air, this transformation can last for days. Figure 10 shows the evolution of the Ni XANES as a function of time. The spectra were recorded in four time slices: a short acquisition for the first 73 minutes with 1 min steps, a longer one after 3.5 h with 10 min steps for ca. 17 hours, a third batch after 29 h for ca. 23 hours, and a last set after 12 days to check the final state of the sample. The observed spectra tracks clearly the reduction of the Ni(IV) ions. The absorption edge maximum corresponding to the tetravalent state (at around 8356 eV) fades away in the first hours giving rise to a second absorption edge peaking at around 8351 eV. This latter stabilizes at the end of the second measurement series and remains the dominant component even days after, as shown in the right panel of Fig. 10A. In order to get a quantitative description of the reaction kinetics, in Fig. 10B the difference in the two spectral areas integrated between 8338 eV and 8354 eV is plotted, these energies correspond to the two isosbestic points before and after the absorption edge of the trivalent component compared to the one of the tetravalent one. This area can help to easily follow the concentration of the evolving species. The graph depicts an apparent simple exponential kinetics with a first order rate constant of 1/s. This demonstrates that with a careful control of the experimental conditions, such measurements can be exploited to study kinetics of slow transport or transformation processes.
IV.5 Laboratory XES with the von Hámos setup
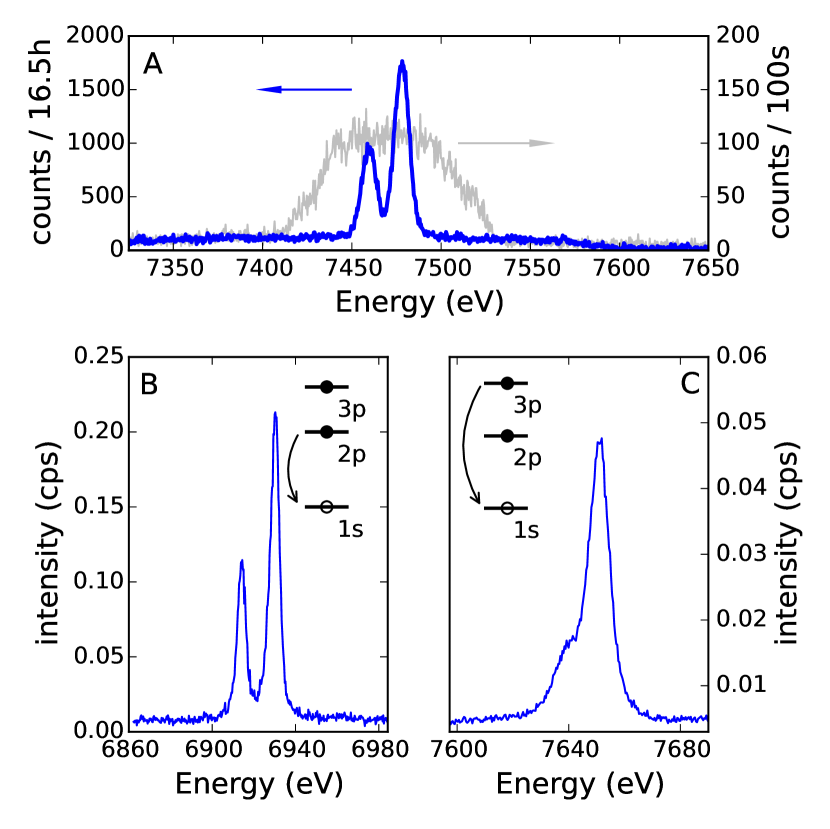
XAS and XES spectroscopies are complementary techniques in terms of information provided. The laboratory X-ray spectrometer can be quickly realigned to be able to record XES spectra by rotating and shifting its breadboard to bring the sample in the source position, as described in Section III.2. Figure 11A shows two K spectra of a Ni-foil recorded on our setup. The incident radiation on the sample was generated in the X-ray tube with 10 keV and 60 mA settings. The gray line showcases the spectra from a larger Ni-foil, with an estimated apparent source size of 2 mm in the projection to the analyzer crystal. The resolution in this case is clearly insufficient to resolve the K and K lines. Although slitting the sample emission results in a decrease in total fluorescent photon intensity, the resolution can be drastically increased up to the limit set by the analyzer, e.g. comparable to standard generation synchrotron XES spectrometers. The blue curve in Fig. 11A represents the latter case. The slit applied was in the order of 0.1 mm in the projection onto the crystal.
Besides the most intense K lines, the spectrometer is well capable of recording decent quality K spectra, as well. Figs. 11B and C show both K and K emission spectra of CoO, acquired for 70 min and 19 h, respectively. Although the count rate with the applied slit and flux is rather limited, the K line at 7649 eV and its K shoulder around 7640 eV, which is one of the most sensitive features to identify the spin state in transition metals Vankó et al. (2006), can be recorded with satisfactory signal-to-noise ratio.
V Summary and Outlook
We have presented a laboratory scale, cost effective high resolution X-ray spectrometer based on von Hámos single crystal analyzers, capable of recording both XAS and XES spectra with a standard X-ray tube in acceptable time periods. The spectrometer consists of commercially available components, and provides a flexible, quickly adjustable setup. One of the key advantages of this spectrometer is that it does not need any scanning components. A fixed and stable setup can be operated even for long acquisition times. Moreover, with a 25 cm bending radius crystal the intensity loss in the spectrometer due to air absorption can be tolerated for many edges, which makes the setup simpler and cheaper compared to the previously reported ones Seidler et al. (2014). The single crystal analyzer and the high resolution position sensitive detector ensures a resolution comparable to X-ray spectrometers at generation synchrotrons.
While the present paper demonstrates the potential of this spectrometer, further extensions can help to improve its capabilities. A major shortcoming of the present setup is the relatively large source size, and the resulting decrease in spectral resolution. This can be resolved by a using microfocus X-ray source, which provides an X-ray beam focused to a few tens of micrometers, sufficient for high resolution XAS and XES experiments. In addition, using a microscopic X-ray beam, the chemical inhomogenities will no longer modulate the spectra, enabling one to combine several XAS regions with different energy ranges to cover the whole EXAFS region. Finally, while in high background (low S/N) cases, such as measuring pre-edges or valence-to-core XES, Johann-spectrometers seem more advantageous, it is to be examined how the von Hámos setup will perform with the higher brilliance microfocus sources.
A simpler version of the present setup could be based on a set of interchangable breadboards with optimized, fixed crystal- and detector positions, where one can easily switch between XAS and XES setups or between different elements, making the instrument flexible, more economic and user friendly. This spectrometer has the potential to allow the wider scientific community to access the unique information provided by hard X-ray spectroscopies while simultaneously allowing overbooked synchrotron facilities to focus on challenging experiments to which they are better suited.
Acknowledgements.
This project was supported by the European Research Council via contract ERC-StG-259709 (X-cited!), and the ’Lendület’ (Momentum) Program of the Hungarian Academy of Sciences (LP2013-59). ZN acknowledges support from the Bolyai Fellowship of the Hungarian Academy of Sciences. We thank Csilla Bogdán, Francesco Raiola and Gábor Rozipál for assistance at different phases of this project, and Chris Milne and Jesse Weil for their comments on the manuscript.References
- Bunker (2010) G. Bunker, Introduction to XAFS A Practical Guide to X-ray Absorption Fine Structure Spectroscopy, edited by G. Bunker (Cambridge University Press, 2010).
- Koningsberger and Prins (1987) D. Koningsberger and R. Prins, X-Ray Absorption Principles, Applications, Techniques of EXAFS, SEXAFS and XANES Chemical Analysis: A Series of Monographs on Analytical Chemistry and Its Applications, edited by D. Koningsberger and R. Prins (Wiley & Sons Ltd, 1987).
- Stern and Heald (1983) E. A. Stern and S. M. Heald, Handbook of Synchrotron Radiation: Basic Principles and Applications of EXAFS, edited by E. E. Koch, Vol. Chapter 10 (North-Holland, 1983) pp. pp 995–1014.
- Glatzel and Bergmann (2005) P. Glatzel and U. Bergmann, Coord. Chem. Rev. 249, 65 (2005).
- de Groot (2001) F. M. F. de Groot, Chem. Rev. 101, 1779 (2001).
- Torchio, Mathon, and Pascarelli (2014) R. Torchio, O. Mathon, and S. Pascarelli, Coordination Chemistry Reviews 277–278, 80 (2014).
- Rueff and Shukla (2010) J.-P. Rueff and A. Shukla, Rev. Mod. Phys. 82, 847 (2010).
- Rovezzi and Glatzel (2014) M. Rovezzi and P. Glatzel, Semiconductor Science and Technology 29, 023002 (2014).
- Seidler et al. (2014) G. T. Seidler, D. R. Mortensen, A. J. Remesnik, J. I. Pacold, N. A. Ball, N. Barry, M. Styczinski, and O. R. Hoidn, Review of Scientific Instruments 85, 113906 (2014).
- Mortensen et al. (2015) D. R. Mortensen, G. T. Seidler, A. S. Ditter, and P. Glatzel, ArXiv e-prints (2015), arXiv:1509.05711 [cond-mat.mtrl-sci] .
- Seidler et al. (2015) G. T. Seidler, D. R. Mortensen, A. S. Ditter, N. A. Ball, and A. J. Remesnik, ArXiv e-prints (2015), arXiv:1509.05708 [physics.ins-det] .
- Uhlig et al. (2013) J. Uhlig, W. Fullagar, J. N. Ullom, W. B. Doriese, J. W. Fowler, D. S. Swetz, N. Gador, S. E. Canton, K. Kinnunen, I. J. Maasilta, C. D. Reintsema, D. A. Bennett, L. R. Vale, G. C. Hilton, K. D. Irwin, D. R. Schmidt, and V. Sundström, Phys. Rev. Lett. 110, 138302 (2013).
- Joe et al. (2016) Y. I. Joe, G. C. O’Neil, L. Miaja-Avilaand J W Fowler, R. Jimenez, K. L. Silverman, D. S. Swetz, and J. N. Ullom, Journal of Physics B: Atomic, Molecular and Optical Physics 49, 024003 (2016).
- Szlachetko et al. (2012) J. Szlachetko, M. Nachtegaal, E. de Boni, M. Willimann, O. Safonova, J. Sa, G. Smolentsev, M. Szlachetko, J. A. van Bokhoven, J.-C. Dousse, J. Hoszowska, Y. Kayser, P. Jagodzinski, A. Bergamaschi, B. Schmitt, C. David, and A. Lücke, Review of Scientific Instruments 83, 103105 (2012).
- Alonso Mori et al. (2012) R. Alonso Mori, J. Kern, D. Sokaras, T.-C. Weng, D. Nordlund, R. Tran, P. Montanez, J. Delor, V. K. Yachandra, J. Yano, and U. Bergmann, Review of Scientific Instruments 83, 073114 (2012).
- Hoszowska and Dousse (2004) J. Hoszowska and J.-C. Dousse, Journal of Electron Spectroscopy and Related Phenomena 137–140, 687 (2004).
- Lecante et al. (1994) P. Lecante, J. Jaud, A. Mosset, J. Galy, and A. Burian, Review of Scientific Instruments 65, 845 (1994).
- Inada, Funahashi, and Ohtaki (1994) Y. Inada, S. Funahashi, and H. Ohtaki, Review of Scientific Instruments 65, 18 (1994).
- Schlesiger et al. (2015) C. Schlesiger, L. Anklamm, H. Stiel, W. Malzer, and B. Kanngießer, J. Anal. At. Spectrom. 30, 1080 (2015).
- Kayser et al. (2014) Y. Kayser, W. Błachucki, J.-C. Dousse, J. Hoszowska, M. Neff, and V. Romano, Review of Scientific Instruments 85, 043101 (2014).
- Vankó et al. (2010) G. Vankó, P. Glatzel, V.-T. Pham, R. Abela, D. Grolimund, C. N. Borca, S. L. Johnson, C. J. Milne, and C. Bressler, Angewandte Chemie International Edition 49, 5910 (2010).
- March et al. (2015) A. M. March, T. A. Assefa, C. Bressler, G. Doumy, A. Galler, W. Gawelda, E. P. Kanter, Z. Németh, M. Pápai, S. H. Southworth, L. Young, and G. Vankó, The Journal of Physical Chemistry C 119, 14571 (2015), http://dx.doi.org/10.1021/jp511838q .
- Alain et al. (2009) M. Alain, M. Jacques, M.-B. Diane, and P. Karine, Journal of Physics: Conference Series 190, 012034 (2009).
- Pan et al. (2012) D. Pan, J. K. Jian, A. Ablat, J. Li, Y. F. Sun, and R. Wu, Journal of Applied Physics 112, 053911 (2012), http://dx.doi.org/10.1063/1.4749408.
- Glatzel, Smolentsev, and Bunker (2009) P. Glatzel, G. Smolentsev, and G. Bunker, Journal of Physics: Conference Series 190, 012046 (2009).
- Mori, Taga, and Yamashita (2015) K. Mori, T. Taga, and H. Yamashita, ChemCatChem 7, 1285 (2015).
- Tirez et al. (2011) K. Tirez, G. Silversmit, L. Vincze, K. Servaes, C. Vanhoof, M. Mertens, N. Bleux, and P. Berghmans, J. Anal. At. Spectrom. 26, 517 (2011).
- Medarde et al. (2009) M. Medarde, C. Dallera, M. Grioni, B. Delley, F. Vernay, J. Mesot, M. Sikora, J. A. Alonso, and M. J. Martínez-Lope, Phys. Rev. B 80, 245105 (2009).
- Zhang et al. (2015) N. Zhang, J. Brugger, B. Etschmann, Y. Ngothai, and D. Zeng, PLoS ONE 10, 1 (2015).
- Woolley et al. (2011) R. J. Woolley, B. N. Illy, M. P. Ryan, and S. J. Skinner, J. Mater. Chem. 21, 18592 (2011).
- O’Grady et al. (1996) W. E. O’Grady, K. I. Pandya, K. E. Swider, and D. A. Corrigan, Journal of The Electrochemical Society 143, 1613 (1996).
- Vankó et al. (2006) G. Vankó, T. Neisius, G. Molnár, F. Renz, S. Kárpáti, A. Shukla, and F. M. F. de Groot, J. Phys. Chem. B 110, 11647 (2006).