Quantitative analysis of valence photoemission spectra
and quasiparticle excitations
at chromophore/semiconductor interfaces
Abstract
Investigating quasiparticle excitations of molecules on surfaces through photoemission spectroscopy forms a major part of nanotechnology research. Resolving spectral features at these interfaces requires a comprehensive theory of electron removal and addition processes in molecules and solids which captures the complex interplay of image charges, thermal effects and configurational disorder. We here develop such a theory and calculate the quasiparticle energy-level alignment and the valence photoemission spectrum for the prototype biomimetic solar cell interface between anatase TiO2 and the N3 chromophore. By directly matching our calculated photoemission spectrum to experimental data we clarify the atomistic origin of the chromophore peak at low binding energy. This case study sets a new standard in the interpretation of photoemission spectroscopy at complex chromophore/semiconductor interfaces.
The interfaces between solids and molecules form the backbone of many areas of nanotechnology research Somorjai2011 , including biomimetic photovoltaics Gratzel20012 , molecular electronics Nitzan2003 , surface-transfer doping Wehling2008 , catalysis Marshall2010 , and photocatalysis Fujishima2008 . Developing an understanding of electron energetics and dynamics at these interfaces is an essential step towards rational strategies of device optimization, as well as a key challenge for the theory of excitations in highly anisotropic and inhomogeneous systems.
For example, in dye-sensitized solar cells electrical current is generated by electron injection from a photo-excited molecular chromophore into a wide gap semiconductor Gratzel20012 . This process crucially relies on the type-II alignment between the discrete energy levels of the chromophore and the energy bands of the semiconductor. In this context a quantitative understanding of the energetics of charge transfer across the interface, as provided by the quasiparticle spectrum, is important for gaining insight into the physics of charge injection.
The prototypical dye-sensitized solar cell interface consists of N3 dyes [Ru(dcbpyH2)2(NCS)2] adsorbed on anatase TiO2 Nazeeruddin1993 .
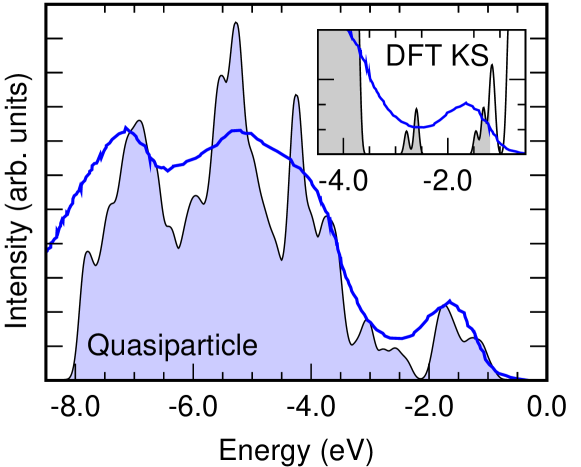
The quasiparticle spectrum of this interface, as measured by valence photoemission spectroscopy (PES) experiments, has been reported in several studies Hahlin2011 ; Rensmo1997 ; Hagfeldt2000 ; Schwanitz2007 ; Westermark20023 . The most recent measurements Hahlin2011 are shown in Fig. 1 (blue line).
The standard qualitative interpretation of the N3/TiO2 PES spectrum is to assign the feature at a binding energy of 1.8 eV to the highest occupied molecular orbital (HOMO) of the N3 dye, and the leading edge at a binding energy of 3 eV to the valence band top (VBT) of TiO2. However, owing to considerable spectral broadening in the range of 1-2 eV, the precise location of the TiO2 VBT in the spectrum is unkown and the unanbiguous assignment of the feature at low-binding energy to specific excitations in the dye is still missing. In this context a first-principles calculation of the PES spectrum is highly desirable as it would enable a quantitative interpretation of the measured spectrum based on the underlying interface structure at the atomic scale. Despite considerable progress in this area Neaton2006 ; Angelis2007b ; Marom2011 , systematic comparisons of calculated energy-level alignments and quasiparticle spectra with PES have been scarce so far. This situation is to be ascribed to the inherent complexity of chromophore/semiconductor interfaces, and to the lack of quasiparticle techniques suitable for atomistic models with hundreds of atoms.
In this work we propose a procedure for calculating from first principles quasiparticle energy-level alignments and valence photoemission spectra at complex chromophore/semiconductor interfaces. Our procedure combines density-functional calculations on large interface models, bulk GW calculations, molecular SCF calculations, image-charge renormalization, thermal broadening, and configurational disorder to obtain the most accurate possible quasiparticle spectrum at the interface.
Within the sudden approximation, in a PES experiment the photocurrent for a binding energy is proportional to the quasiparticle spectral function through a factor incorporating matrix elements and escape-depth effects Hufnerbook ; Hedin1965 ; Damascelli2003 . At small binding energy quasiparticles are well defined excitations and the spectral function is given by the quasiparticle density of states. Under these standard assumptions the calculation of valence PES spectra reduces to the calculation of quasiparticle energies for occupied electronic states.
As GW quasiparticle calculations at interfaces Neaton2006 ; Rignanese2008 are computationally prohibitive for large systems such as the N3/TiO2 interface considered here (299 atoms), we need to devise a practical alternative retaining the accuracy of a complete GW calculation. For this purpose we partition the spectral function of the interface into contributions from the bulk semiconductor and the isolated chromophore , and evaluate these contributions separately. If and are referred to the VBT of the semiconductor and to the HOMO of the molecule, respectively, and indicates the difference between the quasiparticle energies of VBT and HOMO at the interface, then the photocurrent is obtained as
| (1) |
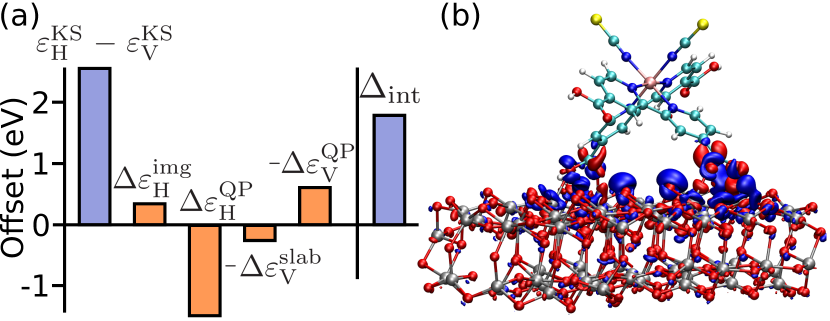
This simple procedure is illustrated in Fig. 2(a).
The partitioning that we propose is legitimate as long as the frontier orbitals of the molecule do not hybridize with the valence manifold of the oxide, i.e. they are well separated from the substrate and retain the original gas-phase character. This condition is verified in most type-II interfaces between large chromophores and wide-gap semiconductors Martsinovich2010 , and is also common in the case of molecular physisorption Kanai2010 .
We now proceed to describe how , , , , and are calculated. The HOMO/VBT offset is obtained as:
| (2) |
In this equation and are the standard density-functional theory (DFT) Kohn-Sham (KS) eigenvalues of the semiconductor and of the molecule, respectively, both obtained from an interface calculation. is a correction to the valence band top of the semiconductor which removes spurious quantum confinement and surface effects associated with the semiconductor slab in the interface model VandeWalle1987 . is the GW quasiparticle shift of the semiconductor VBT, and is obtained from a separate bulk calculation. is the quasiparticle renormalization of the molecular HOMO. This is determined by explicitly computing electron removal energies for the isolated molecule using the SCF method. is the substrate-induced renormalization of the molecular HOMO energy, and arises from the dielectric screening by the semiconductor of the photo-hole in the chromophore Neaton2006 . In addition to reducing the complexity of the calculation, the decomposition of in Eq. (2) allows us to determine and using the most accurate techniques available for bulk solids and molecules, respectively. This point is especially relevant since molecular systems require going beyond many-body GW perturbation theory using self-consistency or improved starting Hamiltonians Blase2011 ; Rostgaard2010 ; Stenuit2010 ; Stan2006 .
The spectral function of the chromophore with the zero of energy set at the HOMO is calculated using the DFT KS density of states, broadened to include electron-vibration interactions. This choice corresponds to applying the same quasiparticle shift to all the molecular levels of the dye, an approximation which is expected to hold quite generally for states near the HOMO Stenuit2010 . The broadening of is calculated within the adiabatic approximation Grimvall1981 by performing explicit first-principles molecular dynamics simulations at the experimental temperature. The spectral function of the semiconductor substrate is obtained in the same way as for the chromophore. Lifetime broadening arising from electron-electron interactions is vanishing below the threshold for electron-hole pair generation (i.e. the semiconductor band gap) hence is not explicitly considered in our description. Configurational disorder is included in Eq. (1) through by performing separate calculations on the most likely interface conformations.
The prefactors and in Eq. (1) depend on surface coverage, inelastic scattering of the photoelectrons, transmission losses, and dipole matrix elements. The evaluation of these terms still poses a significant challenge Stojic2008 ; Husser2011 . For simplicity it is convenient to assume that, at low binding energy, the size of the dipole matrix elements in the semiconductor and the molecule is similar. This approximation is sensible for organic and metal-organic chromophores adsorbed on semiconducting oxides where both VBT and HOMO have significant -character Greiner2012 . Dissipative effects are taken into account using a phenomenological escape-depth model based on the universal curve of inelastic mean free paths Hufnerbook , and surface coverage is chosen so as to match the experimental conditions. With these choices the energy dependence of the prefactors drops, and their ratio sets the relative intensity of the photocurrents originating in the substrate and in the molecular layer.
After illustrating our theoretical framework we now describe the computational details. All calculations are performed within the generalized gradient approximation to DFT of Ref. 31, using ultrasoft pseudopotentials Vanderbilt1990 and planewaves basis sets as implemented in the Quantum ESPRESSO distribution quantumespresso . The Ti semicore 3 and 3 states are explicitly included and the kinetic energy cutoffs for wavefunctions and charge density are 35 and 200 Ry, respectively. The atomistic structures of the TiO2/N3 interface models are described in detail in our previous work Ref. 34. In these models the N3 dye is anchored to the Ti atoms of the anatase TiO2(101) surface through the O atoms of its carboxylic groups [Fig. 2(b)]. We consider six possible adsorption geometries in order to cover all the interface models studied in the literature Nazeeruddin2003 ; Rensmo1999 ; Schiffmann2010 ; Angelis2010 . The typical size of our extended interface models is of 299 atoms, and for all models we use -point sampling. In order to prevent incorrect orbital occupancies at the N3/TiO2 interface we include a Hubbard correction Ansimov1991 for the Ti-3 states, using the method of Ref. 40. The Hubbard parameter is set to 7.5 eV, as determined from first principles using a self-consistent + calculation Patrick2012 . The energy levels of the TiO2 slab are corrected for finite-size effects by referring all the excitation energies to the Ti-3 semicore states. The quasiparticle corrections for bulk anatase TiO2 are calculated within the approximation Hedin1965 ; Hybertsen1986 ; Onida2002 using the self-consistent + procedure described in Ref. 41.
The ionization potential (IP) of the chromophore is determined using the SCF method. The spurious Coulomb interaction between periodic replicas is eliminated using the Coulomb truncation technique of Ref. 44. We ran extensive test calculations on molecules ranging from thiophene to fullerenes, and obtained IPs with a mean average error with respect to experiment of 0.22 eV. This level of accuracy is similar to those reported in Refs. 23; 24 for similar molecules, and superior to the best GW calculations reported so far, which yield errors of 0.32 eV Blase2011 and 0.4 eV Rostgaard2010 on average. In order to determine both the HOMO energy of the chromophore and the image-charge renormalization from the substrate we perform two separate calculations. In the first calculation we determine the removal energy of one electron in the isolated chromophore. In the second calculation we determine the removal energy of one electron (from the dye) in a finite model of the chomophore/semiconductor interface Angelis2007 ; Lundqvist22006 . The difference of these two calculations yields by construction the image-charge renormalization of the HOMO. The nanocluster model contains 68 TiO2 units, and is obtained by cutting a slab of bulk anatase along the (101) direction.
The broadening of energy levels due to finite temperature is calculated using Car-Parrinello molecular dynamics CarParrinello ; Laasonen1993 with a Nosé-Hoover thermostat Nose1984 ; Hoover1985 . In order to match the experimental temperature Hahlin2011 we thermalize the system at 300 K for 3 ps, and then monitor the evolution of the energy levels for 6 ps. The calculated broadening is then included in the final PES spectrum by convolving the raw spectra with gaussians of the same width. Quantum zero-point broadening could increase our calculated thermal broadening by up to 0.1 eV Cardona2005 , however calculating the precise magnitude of this effect is beyond the scope of this work Giustino20102 . In order to account for configurational disorder we determine by repeating the DFT calculations for the six interface models with isolated dyes described in Ref. 34. The escape depth of the photoelectrons is included by dividing the interface models into layers coplanar to the surface and weighting the contributions from each layer using the factor . In this expression is the layer height and =5 Å is the electron escape depth corresponding to 450 eV photons Hahlin2011 ; Hufnerbook . For the surface coverage we take an areal density of 0.5 molecules/nm2 based on standard dye loading Patrick2011 .
We now present our results. As shown in Fig. 2(b) for a representative N3/TiO2 interface (model I2b of Ref. 34), our requirement that the chromophore HOMO retains its gas-phase character is perfectly verified for the N3/TiO2 interface. In fact the HOMO is well separated from the underlying semiconductor (5 Å), and the overlap of the state shown in Fig. 2(b) with the HOMO state of the isolated molecule is 99%.
Figure 3 shows the calculated contributions to in Eq. (2). For the model of Fig. 2(b) the KS energy-level alignment is =2.60 eV, while the quasiparticle energy offset is =1.82 eV. The largest correction to the KS alignments comes from the quasiparticle shift of the N3 HOMO, eV. The quasiparticle shift of the TiO2 VBT, eV, is rather large when compared to other semiconductors Hybertsen1986 . This result indicates that a simplified scissor correction would not be adequate for this interface.
An interesting result of this study concerns image-charge effects. The redistribution of charge on creation of the photohole is illustrated in Fig. 3(b). In addition to a screening charge layer concentrated on the TiO2 surface and arising from image-charge effects Neaton2006 , 0.11 electrons/dye are transferred to the chromophore through its anchor groups. This additional screening, which is not observed in the case of physisorbed molecules Neaton2006 ; Garcia2009 , is enabled by the presence of covalent bonds between N3 and TiO2 which provide a direct pathway for charge transfer. In order to capture this effect, eventual GW calculations on entire interfaces will need to include self-energy corrections to the KS wavefunctions. Our calculated correction =0.35 eV is smaller than the quasiparticle shifts but cannot be neglected in a quantitative analysis.
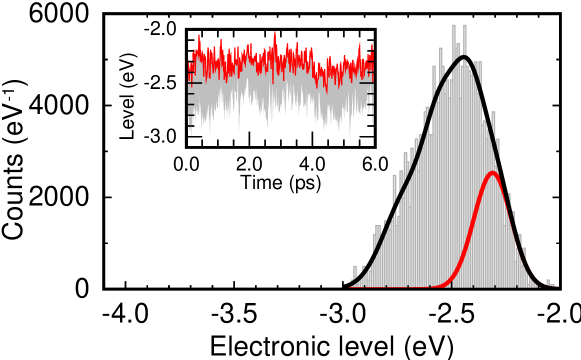
Figure 4 shows the time-evolution at 300 K of the energy of the four highest electronic states at the N3/TiO2 interface and the corresponding energy distribution. These states are similar in character to the dye HOMO, and consists of S-3 and N-2 orbitals from the thiocyanate ligands and of Ru-4 orbitals Fantacci2003 . In the ground state geometry these states lie within 0.3 eV of each other. The electron-vibration interaction is found to induce a thermal broadening of 0.18 eV for each of these states. As a result the four highest-energy states merge into a single peak, whose centre is redshifted by 0.19 eV with respect to the HOMO in the ground state.
Configurational disorder is found to provide the largest source of spectral broadening. In fact the KS HOMO/VBT separation varies between 1.81 eV and 2.46 eV depending on the N3 adsorption mode. A similar trend was observed in a hybrid functional study of the related N719 dye on a TiO2 cluster Angelis2007 .
Figure 1 reports the principal result of the present work, namely the PES photocurrent at the N3/TiO2 interface calculated using Eq. (1). PES experiments reported HOMO/VBT offsets at the interface of 1.2 eV Hagfeldt2000 , 1.4 eV Rensmo1997 ; Westermark20023 , and 1.6 eV Schwanitz2007 ; Hahlin2011 . When we compare our calculations with the latest data from Ref. 8 [Fig. 1(inset)] it is clear that the DFT KS spectrum is in sharp disagreement with experiment. Indeed standard DFT yields a finite density of states at the Fermi level, due to the conduction band of TiO2 being degenerate with the HOMO of N3. The inclusion of Hubbard corrections lifts this degeneracy but yields a HOMO/VBT offset which is 1 eV larger than in the experiments. On the other hand, the photocurrent calculated through Eqs. (1),(2) by including quasiparticle shifts and spectral broadening are in good agreement with the experimental PES data. Given the huge complexity of the N3/TiO2 interface and the first-principles nature of our calculations we regard the comparison shown in Fig. 1 as very satisfactory. We note in particular that the agreement between calculated and measured peak intensities is non trivial and is being reported here for the first time. Our results indicate that the procedure described here captures the relevant physics of quasiparticle excitations at the N3/TiO2 interface.
A detailed analysis of the spectra in Fig. 1 allows us to clarify some aspects of PES at the N3/TiO2 interface: (i) Our calculations indicate that the thermal broadening is of the same magnitude as configurational disorder. This observation implies that the fingerprints of specific dye adsorption geometries are blurred by temperature and cannot be resolved in PES experiments at 300 K. (ii) What is commonly identified as the N3 HOMO peak actually corresponds to an average over the four highest-energy states of the dye (Fig. 4) and is affected by a thermal redshift of 0.2 eV. (iii) the finite PES intensity at binding energies around 3 eV in Fig. 1 does not arise from the TiO2 substrate, but corresponds instead to lower-lying Ru-4 orbitals. (iv) The interaction with the semiconductor affects the quasiparticle energies of N3 via image-charge screening (as for physisorbed molecules) and via charge transfer through the anchor groups. Taken together these observations point to the necessity of calculating complete photoemission spectra as opposed to individual KS energy levels in order to formulate a quantitative interpretation of measured PES data.
In conclusion, we developed a comprehensive theory of the quasiparticle energy-level alignment and the photoemission spectra at complex chromophore/semiconductor interfaces. For the prototypical biomimetic solar cell interface between anatase TiO2 and the N3 chromophore we were able to directly match the calculated photoemission spectrum to experimental data and achieve quantitative accuracy. The present work sets a new standard for reverse-engineering structure-property relations at solid/molecule interfaces of direct interest for nanotechnology and energy applications.
This work is supported by the UK EPSRC and the ERC under the EU FP7 / ERC grant no. 239578. Calculations were performed in part at the Oxford Supercomputing Centre. Figures rendered using VMD VMD .

References
- (1) G. A. Somorjai and Y. Li, Proc. Natl. Acad. Sci. USA 108, 917 (2011)
- (2) M. Grätzel, Nature 414, 338 (2001)
- (3) A. Nitzan and M. A. Ratner, Science 300, 1384 (2003)
- (4) T. O. Wehling et al., Nano Lett. 8, 173 (2008)
- (5) S. T. Marshall et al., Nat. Mater. 9, 853 (2010)
- (6) A. Fujishima, X. Zhang, and D. A. Tryk, Surf. Sci. Rep. 63, 515 (2008)
- (7) M. K. Nazeeruddin et al., J. Am. Chem. Soc. 115, 6382 (1993)
- (8) M. Hahlin et al., J. Phys. Chem. C 115, 11996 (2011)
- (9) H. Rensmo et al., Chem. Phys. Lett. 274, 51 (1997)
- (10) A. Hagfeldt and M. Grätzel, Accounts Chem. Res. 33, 269 (2000)
- (11) K. Schwanitz et al., J. Phys. Chem. C 111, 849 (2007)
- (12) K. Westermark et al., Chem. Phys. 285, 157 (2002)
- (13) J. B. Neaton, M. S. Hybertsen, and S. G. Louie, Phys. Rev. Lett. 97, 216405 (2006)
- (14) F. De Angelis et al., J. Am. Chem. Soc. 129, 14156 (2007)
- (15) N. Marom et al., Phys. Rev. B 84, 245115 (2011)
- (16) S. Hüfner, Photoelectron Spectroscopy, 2nd ed. (Springer, 1996)
- (17) L. Hedin, Phys. Rev. 139, A796 (1965)
- (18) A. Damascelli, Z. Hussain, and Z.-X. Shen, Rev. Mod. Phys. 75, 473 (2003)
- (19) R. Shaltaf et al., Phys. Rev. Lett. 100, 186401 (2008)
- (20) N. Martsinovich, D. R. Jones, and A. Troisi, J. Phys. Chem. C 114, 22659 (2010)
- (21) Y. Kanai, Z. Wu, and J. C. Grossman, J. Mater. Chem. 20, 1053 (2010)
- (22) C. G. Van de Walle and R. M. Martin, Phys. Rev. B 35, 8154 (1987)
- (23) X. Blase, C. Attaccalite, and V. Olevano, Phys. Rev. B 83, 115103 (2011)
- (24) C. Rostgaard, K. W. Jacobsen, and K. S. Thygesen, Phys. Rev. B 81, 085103 (2010)
- (25) G. Stenuit et al., Phys. Chem. Chem. Phys. 12, 10812 (2010)
- (26) A. Stan, N. E. Dahlen, and R. van Leeuwen, Europhys. Lett. 76, 298 (2006)
- (27) G. Grimvall, The Electron-Phonon Interaction in Metals (North-Holland, New York, 1981)
- (28) N. Stojić et al., Phys. Rev. B 77, 195116 (2008)
- (29) H. Husser, J. van Heys, and E. Pehlke, Phys. Rev. B 84, 235135 (2011)
- (30) M. T. Greiner et al., Nat. Mater. 11, 76 (2012)
- (31) J. P. Perdew, K. Burke, and M. Ernzerhof, Phys. Rev. Lett. 77, 3865 (1996)
- (32) D. Vanderbilt, Phys. Rev. B 41, 7892 (1990)
- (33) P. Giannozzi et al., J. Phys.: Condens. Matter 21, 395502 (2009)
- (34) C. E. Patrick and F. Giustino, Phys. Rev. B 84, 085330 (2011)
- (35) M. K. Nazeeruddin et al., J. Phys. Chem. B 107, 8981 (2003)
- (36) H. Rensmo et al., J. Chem. Phys. 111, 2744 (1999)
- (37) F. Schiffmann et al., J. Phys. Chem. C 114, 8398 (2010)
- (38) F. De Angelis et al., J. Phys. Chem. C 114, 6054 (2010)
- (39) V. I. Anisimov, J. Zaanen, and O. K. Andersen, Phys. Rev. B 44, 943 (1991)
- (40) M. Cococcioni and S. de Gironcoli, Phys. Rev. B 71, 035105 (2005)
- (41) C. E. Patrick and F. Giustino, J. Phys.: Condens. Matter 24, 202201 (2012)
- (42) M. S. Hybertsen and S. G. Louie, Phys. Rev. B 34, 5390 (1986)
- (43) G. Onida, L. Reining, and A. Rubio, Rev. Mod. Phys. 74, 601 (2002)
- (44) G. J. Martyna and M. E. Tuckerman, J. Chem. Phys. 110, 2810 (1999)
- (45) F. De Angelis et al., Nano Lett. 7, 3189 (2007)
- (46) M. Lundqvist et al., Int. J. Quantum Chem. 106, 3214 (2006)
- (47) R. Car and M. Parrinello, Phys. Rev. Lett. 55, 2471 (1985)
- (48) K. Laasonen et al., Phys. Rev. B 47, 10142 (1993)
- (49) S. Nosé, J. Chem. Phys. 81, 511 (1984)
- (50) W. G. Hoover, Phys. Rev. A 31, 1695 (1985)
- (51) M. Cardona and M. L. W. Thewalt, Rev. Mod. Phys. 77, 1173 (2005)
- (52) F. Giustino, S. G. Louie, and M. L. Cohen, Phys. Rev. Lett. 105, 265501 (2010)
- (53) J. M. Garcia-Lastra et al., Phys. Rev. B 80, 245427 (2009)
- (54) S. Fantacci, F. De Angelis, and A. Selloni, J. Am. Chem. Soc. 125, 4381 (2003)
- (55) W. Humphrey, A. Dalke, and K. Schulten, J. Mol. Graphics 14, 33 (1996)